Université de Montréal
Utilisation et développement de techniques
pharmacocinétiques avancées afin d’améliorer le
développement de molécules pharmaceutiques
Improving drug development through the use and development of
advanced pharmacokinetic techniques
par
Corinne Seng Yue
Faculté de pharmacie
Thèse présentée à la Faculté des études supérieures et postdoctorales en vue de l’obtention du grade de Ph.D.
en Sciences pharmaceutiques option Pharmacologie
Octobre 2014
Faculté des études supérieures et postdoctorales
Cette thèse intitulée:
Utilisation et développement de techniques pharmacocinétiques avancées afin d’améliorer le développement de molécules pharmaceutiques
Présentée par: Corinne Seng Yue
a été évaluée par un jury composé des personnes suivantes :
Jacques Turgeon, PhD, président-rapporteur Murray P Ducharme, PharmD, directeur de recherche
Line Labbé, PhD, co-directeur France Varin, PhD, membre du jury David Z D’Argenio, PhD, examinateur externe Yves Théorêt, PhD, représentant du doyen de la FESP
i
Résumé
Malgré le progrès technologique et nos connaissances pharmaceutiques et médicales croissantes, le développement du médicament demeure un processus difficile, dispendieux, long et très risqué. Ce processus mérite d'être amélioré pour faciliter le développement de nouveaux traitements. À cette fin, cette thèse vise à démontrer l’utilité de principes avancés et d’outils élaborés en pharmacocinétique (PK), actuels et nouveaux. Ces outils serviront à répondre efficacement à des questions importantes lors du développement d’un médicament, sauvant ainsi du temps et des coûts.
Le premier volet de la thèse porte sur l’utilisation de la modélisation et des simulations et la création d’un nouveau modèle afin d’établir la bioéquivalence entre deux formulations de complexe de gluconate ferrique de sodium en solution de sucrose pour injection. Comparé aux méthodes courantes, cette nouvelle approche proposée se libère de plusieurs présuppositions, et requiert moins de données. Cette technique bénéficie d’une robustesse scientifique tout en étant associée à des économies de temps et de coûts. Donc, même si développé pour produits génériques, elle pourra également s’avérer utile dans le développement de molécules innovatrices et « biosimilaires ».
Le deuxième volet décrit l’emploi de la modélisation pour mieux comprendre et quantifier les facteurs influençant la PK et la pharmacodynamie (PD) d’une nouvelle protéine thérapeutique, la pegloticase. L’analyse a démontré qu’aucun ajustement posologique n’était nécessaire et ces résultats sont inclus dans la monographie officielle du produit. Grâce à la modélisation, on pouvait répondre à des questions importantes concernant le dosage d’un médicament sans passer par des nouvelles études ni d'évaluations supplémentaires sur les patients. Donc, l’utilisation de cet outil a permis de réduire les dépenses sans prolonger le processus de développement. Le modèle développé dans le cadre de cette analyse pourrait servir à mieux comprendre d’autres protéines thérapeutiques, incluant leurs propriétés immunogènes.
Le dernier volet démontre l’utilité de la modélisation et des simulations dans le choix des régimes posologiques d’un antibiotique (TP-434) pour une étude de Phase 2. Des
devenaient disponibles, afin de construire un modèle décrivant le profil pharmacocinétique du TP-434. Ce processus de modélisation exemplifiait les cycles exploratoires et confirmatoires décrits par Sheiner. Ainsi, en se basant sur des relations PK/PD d’un antibiotique de classe identique, des simulations ont été effectuées avec le modèle PK final, afin de proposer de nouveaux régimes posologiques susceptibles d’être efficace chez les patients avant même d'effectuer des études. Cette démarche rationnelle a mené à l’utilisation de régimes posologiques avec une possibilité accrue d’efficacité, sans le dosage inutile des patients. Ainsi, on s’est dispensé d’études ou de cohortes supplémentaires coûteuses qui auraient prolongé le processus de développement. Enfin, cette analyse est la première à démontrer l’application de ces techniques dans le choix des doses d’antibiotique pour une étude de Phase 2.
En conclusion, cette recherche démontre que des outils de PK avancés comme la modélisation et les simulations ainsi que le développement de nouveaux modèles peuvent répondre efficacement et souvent de manière plus robuste à des questions essentielles lors du processus de développement du médicament, tout en réduisant les coûts et en épargnant du temps.
Mots-clés : modélisation de population, pharmacocinétique, pharmacodynamie, développement du médicament
iii
Abstract
Despite the scientific and technological breakthroughs that have graced the last century, the path to bringing a drug to the market is fraught with risk and remains an expensive and time-consuming process. Significant improvements to this process are needed if patients are to continue to benefit from new therapies. The objective of this thesis is to demonstrate the use of modeling and simulations in this regard. It will show how advanced pharmacokinetic (PK) techniques can be used to answer critical questions that arise during the drug development process, and that their use can lead to cost and time savings.
The first part of this thesis shows how modeling and simulations, including the development of an innovative model, can be used for the relative bioequivalence assessment of a new sodium ferric gluconate complex intravenous formulation. Compared to traditional methods, this approach did not make inaccurate assumptions about drug characteristics, nor did it necessitate the enrollment of hundreds of subjects. Thus, this scientifically robust approach was associated with significant financial savings and economy of time. Although this research was conducted within the generic drug development, it could also be applied to innovator or biosimilar drug development.
The second section illustrates the use of modeling and simulations in the development of an innovative biological therapeutic agent, pegloticase. This approach allowed us to answer important questions pertaining to the factors influencing pegloticase’s PK and pharmacodynamics (PD), confirming that no special dosing adjustments were required, thus contributing to the official product labeling. These questions were answered without conducting additional trials or performing supplementary assessments on patients, which resulted in significant cost and time savings. In the future, such PK/PD models could be used to better understand other biological agents, including their immunogenicity profiles which remain a concern for clinicians.
The third part of this thesis focuses on the use of modeling and simulations to select optimal dosing regimens for the Phase 2 study of the novel antibiotic TP-434. A PK model
confirmed as new Phase 1 data became available, similar to the approach advocated by Sheiner’s learn and confirm paradigm. Based on simulations performed with this model, and knowledge of PK/PD relationships for another compound, Phase 2 dosing regimens were recommended that were likely to show efficacy in the patient population. This rational approach to dose selection ensured that patients were not needlessly exposed to the drug, and that efficacy would likely be demonstrated in Phase 2. Consequently, it was unnecessary to dose additional cohorts or conduct additional trials, which would have lengthened the process and been expensive. Moreover, this was the first published account of Phase 2 dose regimen selection based solely on simulated Phase 1 data for an antimicrobial drug.
In summary, the research presented in this thesis illustrates how advanced pharmacokinetic techniques like modeling and simulations, including the creation of innovative models, can efficiently answer key drug development questions, leading to significant cost and time savings.
Keywords : population modeling, pharmacokinetics, pharmacodynamics, drug development
v
Table of contents
Résumé ... i Abstract ... iii Table of contents... v List of Tables ... ix List of Figures ... xiList of Abbreviations and Symbols ...xiii
Dedication ... xv
Acknowledgments ... xvi
Preface ... 1
Chapter 1 – Introduction ... 3
1. The Drug ... 3
2. Pharmacokinetic and Pharmacodynamic Principles ... 6
2.1 Pharmacokinetics ... 6
2.2 Pharmacodynamics ... 14
3. Quantification of Pharmacokinetic and Pharmacodynamic Properties ... 19
3.1 Noncompartmental Analysis ... 19
3.2 Compartmental Analysis ... 22
3.3 Differences Between Noncompartmental and Compartmental Approaches ... 32
4. The Drug Development Process ... 33
4.1 Pre-clinical ... 34
4.2 Clinical ... 34
4.3 Generic Product Development ... 37
5. Current Use of Modeling and Simulations in the DDP ... 41
5.1 Innovator Drugs ... 41
5.2 Generic Drugs ... 44
6. Challenges in the Drug Development Process ... 44
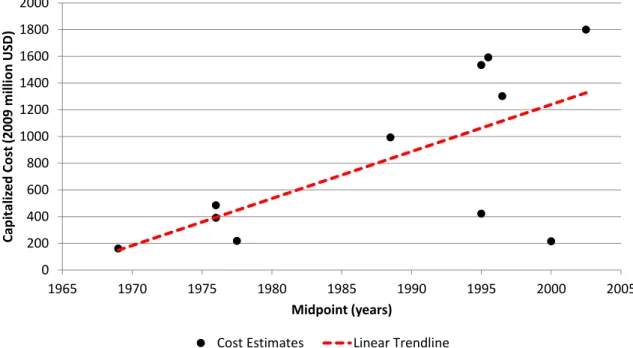
6.1 High Costs... 45
vii
Chapter 2 – Article #1 ... 55
Novel Population Pharmacokinetic Method Compared to the Standard Noncompartmental Approach to Assess Bioequivalence of Iron Gluconate Formulations ... 55
2.1 Preface ... 56
2.2 Abstract ... 59
2.3 Introduction ... 60
2.4 Subjects and Methods ... 63
2.4.1 Study Design ... 63
2.4.2 Population ... 64
2.4.3 Ethics ... 64
2.4.4 Sample Handling and Bioanalytical Method ... 65
2.4.5 Population Pharmacokinetic Modeling... 65
2.4.6 Statistical Analyses for Bioequivalence Assessment ... 67
2.4.7 Noncompartmental Analyses ... 68 2.5 Results ... 69 2.5.1 Population Characteristics ... 69 2.5.1 Population PK Approach ... 71 2.5.1 Noncompartmental Approach ... 79 2.6 Discussion ... 80 2.7 Conclusions ... 84 2.8 Abbreviations ... 85 2.9 References... 87
Population pharmacokinetic and pharmacodynamic analysis of pegloticase administered by
intravenous infusion in two dose regimens to subjects with chronic gout ... 92
3.1 Preface ... 93 3.2 Abstract ... 96 3.3 Introduction ... 96 3.4 Methods ... 98 3.4.1 Study Design ... 98 3.4.2 Ethics ... 100
3.4.3 Inclusion and Exclusion Criteria ... 100
3.4.4 Analytical Methods ... 100 3.4.5 Population PK/PD Analysis ... 101 3.5 Results ... 103 3.6 Discussion ... 111 3.6.1 Pharmacokinetics ... 111 3.6.2 Pharmacodynamics ... 113 3.6.3 Antibodies ... 117 3.7 Conclusion ... 118 3.8 Conflict of Interest/Disclosure ... 119 3.9 References ... 119
ix
Chapter 4 – Article #3 ...124
Optimizing Drug Development of TP-434, a Novel Fluorocycline, with Adaptive Learn & Confirm Cycles of Modeling & Simulation Using Single Ascending Dose Data ...124
4.1 Preface ...125
4.2 Abstract ...128
4.3 Introduction ...129
4.4 Materials and Methods ...130
4.4.1 Study Design ...130 4.4.2 Analytical Methods ...131 4.4.3 Pharmacokinetic Analyses ...132 4.4.4 Simulations...134 4.5 Results ...135 4.6 Discussion ...146 4.7 Conclusion ...149 4.8 References...149
Population Pharmacokinetic Modeling of TP-434 Following Multiple Dose Administration
... 152
5.1 Preface ... 153
5.2 Abstract ... 154
5.3 Introduction ... 156
5.4 Materials and Methods ... 157
5.4.1 Study Design ... 157 5.4.2 Analytical Methods ... 158 5.4.3 Pharmacokinetic Analyses ... 158 5.5 Results ... 161 5.6 Discussion ... 168 5.7 Conclusion ... 171 5.8 References ... 171
Chapter 6 – General Discussion ... 173
xi
List of Tables
CHAPTER 1Table 1. Comparison of Least-Squares Methods... 25
Table 2. Advantages and Disadvantages of Noncompartmental and Compartmental Population Analyses ... 32
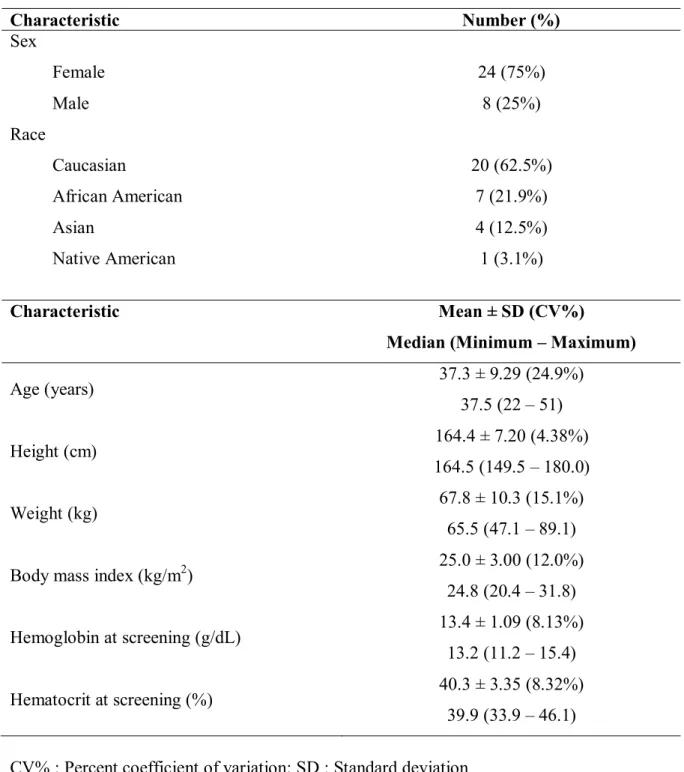
CHAPTER 2 Table 1. Demographic Traits of Subjects Included in the Population PK Analysis ... 70
Table 2. PK Model Discrimination ... 71
Table 3. Population PK Parameter Estimates ... 74
Table 4. Secondary PK Parameters ... 77
Table 5. Summary of the Statistical Analyses for Ln-transformed PK Parameters ... 78
CHAPTER 3 Table 1. Sampling Schedule ... 99
Table 2. Summary Demographics of Subjects ... 104
Table 3. Population PK/PD Parameters of Pegloticase ... 109
Table 4. Bayesian Terminal Elimination Half-life Estimates ... 110
CHAPTER 4 Table 1. Subject Demographics ... 136
Table 2. Structural Model Determination for TP-434 using Standard Two-Stage Analysis ... 137
Table 3. Population Pharmacokinetic Parameter Estimates for TP-434 ... 141
Table 4. Predicted Secondary Pharmacokinetic Parameters for TP-434 ... 142
Table 5. Secondary Simulated Steady-State Pharmacokinetic Parameters for TP-434 ... 144
Table 1. Subject Demographics ... 161 Table 2. Structural Model Determination for TP-434 using Standard Two-Stage
Analysis ... 162 Table 3. Population Pharmacokinetic Parameter Estimates for TP-434 Following Repeated
Administration ... 166 Table 4. Secondary Pharmacokinetic Parameters for TP-434 ... 167
xiii
List of Figures
CHAPTER 1Figure 1. Illustration of Typical Pharmacokinetic Processes ... 7
Figure 2. Relationship between Drug Pharmacokinetics and Pharmacodynamics ... 16
Figure 3. Indirect PD Models ... 18
Figure 4. Example of a Concentration Time Profile from Individual Compartmental Analysis ... 24
Figure 5. Example of Concentration Time Profiles from Population Compartmental Analysis ... 28
Figure 6. Phases of the Drug Development Process ... 33
Figure 7. Example of a Dose-Response Curve in a Therapeutic Equivalence Study ... 39
Figure 8. Biopharmaceutics Classification System ... 40
Figure 9. Capitalized Estimates (in 2009 Million US Dollars) of Drug Development Costs Over Time... 46
CHAPTER 2 Figure 1. Final PK Model ... 73
Figure 2. Goodness-of-Fit Plots ... 75
Figure 3. Visual Predictive Checks... 76
Figure 4. Mean Concentration Versus Time Profiles ... 79
CHAPTER 3 Figure 1. Final PK/PD Model for Pegloticase ... 107
Figure 2. Example of Predicted Profiles for One Patient ... 108
Figure 3a. Predicted (Simulated) Uric Acid Profiles by Treatment Group and Anti-pegloticase Antibody Category - Pegloticase Administered Every 2 Weeks .... 115
Figure 3b. Predicted (Simulated) Uric Acid Profiles by Treatment Group and Anti-pegloticase Antibody Category - Pegloticase Administered Every 4 Weeks .... 116
Figure 1. Final Pharmacokinetic Model for TP-434 ... 138 Figure 2. Predicted versus Observed TP-434 Concentrations ... 139 Figure 3. Mean Observed versus Predicted Plasma TP-434 Concentrations (Semi-log
scale) ... 140 Figure 4. Predictive performance of the final model ... 143 Figure 5. Percentage of target attainment for different dosing regimens over a range of MIC values ... 145
CHAPTER 5
Figure 1. Final Pharmacokinetic Model for TP-434 ... 163 Figure 2. Predicted versus Observed TP-434 Concentrations ... 164 Figure 3. Mean Observed versus Predicted Plasma TP-434 Concentrations (Semi-log
scale) ... 165 Figure 4. Predictive performance of the final model ... 168
xv
List of Abbreviations and Symbols
Abbreviation Definition
AAG 1-acid glycoprotein
ABE Average bioequivalence
AIC Akaike information criterion
ANOVA Analysis of variance
AUC Area-under-the-curve
BCS Biopharmaceutics classification system
BE Bioequivalence
BIC Bayesian information criterion
BID Twice daily
CI Confidence interval
Cmax Maximal observed concentration
Cmax(pred) Maximal predicted concentration
Cmin Minimum observed concentration
CV% Percent coefficient of variation
DDP Drug development process
i Error associated with prediction for ith observation
Empirical Bayes’ estimate
F Bioavailability
Frel Relative bioavailability
ƒ Function
FDA Food and Drug Agency
FO First order
FOCE First order conditional estimation
IV Intravenous(ly)
kDa Kilodalton
LSM Least squares means
mL Milliliter
MLEM Maximum likelihood expectation maximization
min Minute
NCE New chemical entity
NME New molecular entity
NTBI Non-transferrin bound iron
j Vector of model parameters for jth subject
Population (mean) model parameter estimates
OF Objective function
PEG Polyethylene glycol
PK Pharmacokinetics
PD Pharmacodynamics
POC Proof-of-concept
QD Once daily
R2 Coefficient of determination
SAEM Stochastic approximation expectation maximisation
SD Standard deviation
SUPAC Scale-up and post approval changes
TBI Transferrin-bound iron
TE Therapeutic equivalence
TEmax Time associated with maximal pharmacodynamic effect
TI Total iron
TIBC Total iron binding capacity
Tmax Time of maximal concentration
Wi Weighting factor
Xi Vector of known quantities
Yi ith observed value
Ŷi i
th predicted value
xvii
This work is dedicated to my parents, Noel and Shirlie, who have fostered, nurtured and supported my desire to continue learning, and who continue to inspire me by showing through example that it is possible to learn at any age.
Acknowledgments
“It was the best of times, it was the worst of times”.
- Charles Dickens, A Tale of Two Cities
This labour of love would not have been possible without the support and encouragement of many individuals, but there some who deserve a special mention.
Firstly, I would like to extend my gratitude to the thesis review committee, who have graciously accepted to review this thesis despite their hectic schedules and other commitments. Their time, efforts and constructive criticism are greatly appreciated.
I would like to thank my first teachers, my parents, who instilled in their children a love of learning and who continue to show their support and love throughout our adulthood. Without your lifelong influence, I doubt that graduate studies would have even crossed my mind. I would also like to thank Emily, who has been a supportive little sister throughout this entire period.
I would like to thank my thesis director and mentor, Murray Ducharme, for accepting to take me under his wing despite his already overflowing schedule. Your work ethic, sense of fairness and scientific integrity are exemplary and I am truly grateful to have had the opportunity to study with you. Thank you for having confidence in me, even during those times when I had trouble believing in myself. In addition, this work would not have been possible without the supervision and collaboration of my thesis co-director, Line Labbé, whom I thank for always bringing new perspectives and ideas. Your support and enthusiasm were greatly appreciated.
Thank you to all the friends who have been cheerleaders on the sideline, listening to my ranting and raving throughout the last few years, especially Brigid, Catherine and Katie. Thank you for over 20 years of loyal friendship, your support has always been invigorating. I would also like to extend special thanks to Philippe Colucci, who paved the way before me and allowed me to glimpse what lay ahead on the doctoral road. Your advice was
xix invaluable and was always appreciated, especially since you spoke from experience. Thank you for all of the brainstorming sessions, for acting as a sounding board for ideas (some better than others), and for your continual encouragement.
Finally, last but not least, I would like to thank my loving and devoted husband, Patrick, whose support was essential to the completion of this research. Thank you for allowing me to embark upon this journey, for lifting my spirits when I was in dark places and for patiently enduring all of the ups and downs of this lengthy process. Your unwavering belief in me and continual support, even in the most difficult periods, were a true token of love, for which I will be forever grateful.
1
Preface
In spite of the scientific and technical advances made by our society in the last century, drug development today remains a gruelling process. Not only is it expensive, time consuming, and a highly risky endeavour, but it is associated with a very low probability of success. This thesis will demonstrate how modeling and simulations, including the creation of innovative PK models, can help answer key questions within the drug development process (DDP), thereby improving its efficiency and decreasing some of the inherent risk.
To better illustrate the relevance and significance of the research presented in this thesis, it is necessary to first review some basic principles of drug action and describe the types of analyses typically conducted to better understand drug effects. It is also important to understand the drug development process, appreciate its strengths and more importantly underline some of its weaknesses.
After describing the context in which the research presented herein has evolved, the following articles will be presented individually:
1) Novel Population Pharmacokinetic Methods Compared to the Standard Noncompartmental Approach to Assess Bioequivalence of Iron Gluconate Formulations
2) Population pharmacokinetic and pharmacodynamic analysis of pegloticase administered by intravenous infusion in two dose regimens to subjects with chronic gout
3) Optimizing Drug Development of TP-434, a Novel Fluorocycline, with Adaptive Learn & Confirm Cycles of Modeling & Simulation Using Single Ascending Dose Data
3
Chapter 1 – Introduction
1. The Drug
The word “drug” evokes different associations in people, ranging from therapeutic aid to illicit activities. The Canadian government defines a drug as “any substance or mixture of substances manufactured, sold or represented for use in (a) the diagnosis, treatment, mitigation or prevention of a disease, disorder or abnormal physical state, or its symptoms, in human beings or animals, (b) restoring, correcting or modifying organic functions in human beings or animals, or (c) disinfection in premises in which food is manufactured, prepared or kept” (1). A similar definition is employed by the American “Food, Drug and Cosmetic Act”, which defines a drug as: “(A) articles recognized in the official United States Pharmacopoeia, official Homoeopathic Pharmacopoeia of the United States, or official National Formulary, or any supplement to any of them; (B) articles intended for use in the diagnosis, cure, mitigation, treatment, or prevention of disease in man or other animals (C) articles (other than food) intended to affect the structure or any function of the body of man or other animals (D) articles intended for use as a component of any article specified in clause (A), (B), or (C)” (2).
It is clear that drugs can be used to fulfill different therapeutic roles, ranging from the diagnosis to the treatment of disease. Although most clinicians are taught to favor non-medical treatments whenever possible (such as adopting lifestyle changes), the benefits of appropriate drug therapy are undeniable. Patients themselves recognize the importance of drug therapy. In a survey of 1000 patients in the United States, over 85% indicated that prescription medication was very or extremely valuable to their health and well-being (3). While not solely attributable to drug therapy, in the span of the last 60 years, modern medicine has contributed to increasing our lifespan from 30 years up to 78 years in developed countries, which is a remarkable feat (4, 5). In the first half of the last century, medical advances such as vaccinations and antibiotics caused a significant decline in
and medical interventions also contributed to decreasing mortality rates in the second half of the century, especially those related to cardiovascular events (5). Clearly, the use of drug therapy has revolutionized modern medicine by providing viable treatment options when they did not exist before.
The poster child for drug therapy is without a doubt penicillin, which, even in its early commercial form was able to treat infections ranging from pneumonia to syphilis, including those that proved to be resistant to sulphonamide antibiotics. Although it was not the first antibiotic used to treat bacterial infections, more than 70 years after its discovery by Fleming, penicillin remains part of our modern therapeutic arsenal (6, 7). Its use, which began in World War II, serves as a reminder that while drug therapy as we know it is relatively new, it is a cornerstone of modern medicine.
As the benefits of drug therapy throughout the years have greatly evolved, so have our methods for discovering and developing new drugs. In the early days of drug discovery, fortuitous findings related to plants and other natural products were the key to developing new medicines (8). Some classic examples include the discovery that digitalis extracted from the foxglove plant had certain cardiac properties (9) and that extracts from moldy sweet clover hay could produce dicoumarol, a powerful anticoagulant compound (10). Since then, drug discovery has come a long way. Advances in disciplines such as analytical chemistry, biochemistry, microbiology, and more recently molecular biology and genomics have helped shape the process to its current state (11). Our improved understanding of chemistry, disease and pharmacology has allowed us to move away from reliance on serendipity to a more targeted approach to drug discovery.
Despite the contributions of drug therapy to the improvement of healthcare and the progression of drug discovery, unmet needs still remain. Although our lifespan has more than tripled in comparison with that of our cave-dwelling ancestors (5), there is still much for us to learn about the human condition. Mortality caused by infection or cardiovascular events have declined in the previous century, but they still remain among the top 15 causes
5 of death in North America (12, 13) and are among the ten leading causes of death in Canada (14). Added to this list are diseases such as cancer and Alzheimer’s disease (12, 13), which were closer to the bottom of the list at the turn of the 20th century in the United States (15). Thus, with an increasingly aging population, we are faced with additional medical challenges that call for new uses for products already on the market, or for innovative new products.
It is important to remind ourselves that the ultimate goal of drug therapy will always be to improve lifespan as well as quality of life, and the aim of the drug development process is to create products that will help achieve these goals. In addition to developing products that are novel in their mechanisms of action (exemplified by pegloticase in Research Project #2), the drug development process can also produce therapies that are not necessarily different in terms of mechanism of action but that offer clinical advantages with respect to what is already on the market (such as developing anti-infective agents that are associated with less bacterial resistance, exemplified by TP-434 in Research Projects #3 and #4). Another important aspect of the drug development process is the development of generic drugs, which allow medication to be more accessible in terms of costs (as illustrated by sodium ferric gluconate complex in glucose in Research Project #1).
Before embarking upon an overview of the drug development process, the following section will describe some fundamental aspects of drug pharmacology that play a key role in the process. More details on the general pharmacology of the drugs and/or therapeutic classes of the drugs studied within this thesis can be found in Appendix 1.
2. Pharmacokinetic and Pharmacodynamic Principles
In order to better appreciate why drug products have had, and continue to have, such an important impact on health and mortality, it is necessary to have a global understanding of “what the body does to the drug”, otherwise known as pharmacokinetics (PK), and “what the drug does to the body”, defined by the term pharmacodynamics (PD) (16).
2.1 Pharmacokinetics
For all drugs, pharmacokinetics encompasses different phenomena, which will each be discussed separately. These include liberation, absorption, distribution, metabolism and excretion, and are often referred to collectively as “LADME”. Whether or not a drug’s PK includes all of these steps depends on its route of administration. Drugs that are administered by the enteral route (i.e., they enter the gastrointestinal (GI) tract after being given orally) generally involve more processes than those that are administered by parenteral routes, such as intravenously (IV) administered products. An overview of all of the processes is depicted in Figure 1 and presented in more detail hereafter, with special attention being paid to intravenous drug products.
7 Figure 1. Illustration of Typical Pharmacokinetic Processes
2.1.1 Liberation
The liberation of a drug from its pharmaceutical form is a critical first step in a drug’s disposition pathway. This process is inherently tied to drug formulation. For instance, an active ingredient that is administered as a solid form (tablet, capsule, etc.) must be dissolved into a solution before any of the other PK processes can occur (17). This also implies that the product must first disintegrate (break up into smaller particles) and disperse. Conversely, a drug that is administered as a solution (for either oral or injectable administration) does not require this dissolution step. Because the drugs studied in the context of this thesis were all administered intravenously (IV), liberation will not be described any further in this chapter.
2.1.2 Absorption
Once the drug has been solubilized, it is ready to be absorbed by the body and enter the bloodstream. Drugs administered intravenously bypass this step, since they are injected directly into the bloodstream, but most drugs that are given via other routes must necessarily undergo this process. Although the topic of drug absorption is beyond the scope of this thesis, it should be mentioned that it is a complex process that is governed in part by physicochemical drug properties (such as lipophilicity and molecule size), the presence of membrane transporters (both influx and efflux), and physiological states (such as intestinal transit time or food intake).
2.1.3 Distribution
Once the drug has entered the bloodstream (either directly or via passage through various membranes), it has the opportunity to enter different tissue or organs throughout the body. If the human body can be compared to a large city made up of dynamic components (people, animals, vehicles, etc.), and the drug is a person trying to reach a particular destination, then the bloodstream is analogous to the city streets that allow that person to
9
navigate through the city until the target building (representative of a tissue or organ) is attained. Depending on various factors (size, use of a vehicle, mobility), people are able to access multiple buildings or only certain ones, much like drugs whose distribution is controlled by different factors.
Protein binding plays a critical role in drug distribution, since generally only free (unbound) drug is able to cross membranes and reach specific tissues. In the cityscape analogy, plasma proteins are analogous to vehicles such as automobiles or buses which transport people (the drugs) to various locations. However, in order to enter buildings (reach target tissue), occupants must disembark from their vehicles. In human plasma, the most important transport proteins include albumin, 1-acid glycoprotein (AAG) and
lipoproteins (18, 19). Albumin is the most important plasma protein (accounting for roughly 60% of plasma protein (20)) and exhibits low affinity, high capacity binding. Conversely, AAG is less present in the plasma but is considered to have a high affinity, low capacity binding site (19). Most drugs that are acid or neutral bind to albumin while AAG is a major binding protein for basic drugs. Variations in albumin or AAG levels due to pathophysiological conditions can thus affect the concentrations of free (unbound) drug that are available to distribute to organs or tissue.
In order to reach target receptors in organs or tissues, drugs must cross membrane barriers. As with drug absorption, different types of transport mechanisms across membranes exist, such as paracellular transfer (passage between cells), passive diffusion (passage through cell lipid bilayers dependent upon a concentration gradient that follows Fick’s law) (21), simple diffusion (drug transfer through aqueous pores of the cell that follows the concentration gradient), facilitated transport (drug transfer along the concentration gradient using a transporter protein) and active transport (drug transfer against the concentration gradient using a transporter protein and requiring energy expenditure). Therefore, many of the factors governing the membrane permeability during drug absorption will also influence drug distribution. For example, drug distribution is influenced by the size of the compound and its lipophilicity. Larger molecules (≥ 15-30
kDa) such as biologicals tend to remain in the plasma compartment and/or extracellular space (22). More lipophilic molecules cross the membrane barrier by passive diffusion more readily than hydrophilic, charged molecules.
2.1.4 Metabolism
The human body is remarkably endowed with protective mechanisms, and the metabolic processes surrounding drugs generally aim to transform them into compounds that are more easily eliminated or excreted. Due to its size and the high content of metabolizing enzymes, one of the major organs involved in metabolism is the liver (23), which oversees two general types of chemical reactions that are known as Phase I and Phase II type reactions. Phase I reactions involve (but are not limited to) the oxydation, reduction and hydrolysis of compounds while some Phase II reactions include glucuronidation, sulfation and methylation, whereby groups (glucuronide, sulfate or methyl, for instance) are conjugated to the drug to facilitate its excretion (21, 24). Metabolites resulting from Phase I or Phase II reactions can either be active or inactive compounds. Some drugs, termed “pro-drugs”, are specially formulated as inactive compounds which must be transformed into metabolites which possess the desired pharmacological activity.
Many enzymes are responsible for Phase I and II reactions. Some examples of Phase I enzymes include (but are not limited to) catalases, peroxidases, reductases, cholinesterases, dehydrogenases, while examples of Phase II enzymes are N-acetyltransferase, glucuronosyltransferases, glutathione-S-transferase, and sulfotransferases (25). However, one type of enzyme formerly known as cytochrome P450 (now referred to as CYP) is responsible for the metabolism of approximately 90% of all drugs (26). These enzymes are divided into different families (such as CYP1, CYP2, CYP3, etc.) which have amino acid sequences that are < 36% similar to each other. Each family is further divided into sub-families (such as CYP2A, CYP2B, etc.) where each member has an amino acid sequence that exhibits greater than 68% similarity to other members. Individual enzymes
11
are identified by a number following the letter, such as CYP2C9 or CYP2C19. The families CYP1, CYP2 and CYP3 are those which are mainly involved in drug metabolism while other CYPs are associated with the biosynthesis and catabolism of endogenous substances (27). Enzymes belonging to the CYP3A sub-family, especially CYP3A4, account for approximately 30% of all hepatic cytochromes (27) while they make up the majority of all intestinal CYP (21, 28). This family of cytochromes is responsible for most of the body’s hepatic and intestinal metabolism (23), and is involved in the metabolism of approximately 50% of all drugs (26).
Although a comprehensive review of the topic is beyond the scope of this introduction, enzyme polymorphisms deserve a brief mention. Countless research has been devoted to better understand the genetic variations in metabolizing enzymes that frequently translate into starkly different drug responses between individuals. A classic example of polymorphisms that influence drug effect involves CYP2D6. Approximately 5 to 10% of Caucasians exhibit a poor metabolizer phenotype for CYP2D6, which can be attributed to a number of alleles. Compared to extensive metabolizers, these individuals have a limited capacity to inactivate drugs such as fluoxetine, and therefore have a greater risk of suffering from adverse events due to supratherapeutic levels of active drug. Conversely, drugs such as codeine, which must be metabolized into an active metabolite by CYP2D6, are mostly ineffective in such populations compared to extensive metabolizers (27).
Many drugs are subject to hepatic metabolism, but this is not true of all drugs. Compounds that are proteins undergo catabolic processes that allow the body to recycle the amino acids found in such proteins (22). In other words, proteins are degraded into their amino acid subunits through proteolytic processes, such as those in the ubiquitin-proteasome pathway (29). Polyethylene glycol (PEG)-modified recombinant mammalian urate oxidase (pegloticase) is an example of a biological product that is not metabolized (30). In addition, for many drug products, only a portion of the administered drug is metabolized while another remains unchanged.
As previously discussed, metabolism can occur in other organs, such as the intestine, where both Phase I and Phase II reactions take place (21). Other sites of drug metabolism include the kidneys, the lungs, skin and brain (27). The presence of hydrolyzing enzymes, such as cholinesterases, in the plasma compartment even allows metabolism to occur within the vascular space (31).
Metabolism of an orally administered drug can occur after systemic absorption, but it can also occur before a drug reaches systemic circulation. This pre-systemic metabolism is often called “first pass metabolism”, and includes metabolism that may occur at the intestinal and hepatic levels (21). The fraction of a drug that is metabolized during its initial transit through an organ is referred to as the extraction ratio, which is also known as “first pass” or “pre-systemic” elimination. Examples of drugs that are subject to significant first pass metabolism in the intestine include cyclosporine (32), midazolam, nifedipine, quinidine, saquinavir and terfenadine (21).
2.1.5 Excretion
Drugs and their metabolites can be excreted via different organs such as the skin or lungs, but the main eliminating organs remain the kidney and the liver. Hepatic excretion involves biliary elimination of drugs and metabolites in fecal matter. ABCB1 transporters located on the canalicular membrane of hepatocytes are often involved in expulsing drugs into the bile (23). Renal excretion of unchanged drugs and/or their metabolites can involve glomerular filtration, tubular secretion, and reabsorption (23).
A key element of renal excretion involves the filtration of unbound (free) drug through the glomerulus. Another process that contributes to renal elimination is secretion to the proximal tubule, which is an active process involving transporters such as the organic anion transporter (OATP) and organic cation transporter (OCT). ABCB1 transporters located on the luminal brush-border membrane of renal cells also play a role in drug excretion by expulsing drugs into the urine (23). Finally, tubular reabsorption is a component of renal excretion that involves the reuptake of drugs by passive diffusion,
13
sometimes with the aid of endocytosis. Thus, the extent to which a drug is eliminated by the kidney depends on the relative importance of each of the processes involved.
Exceptionally, some compounds are not eliminated at all from the human body, such as iron. This mineral plays a vital role in many bodily functions, most notably involving the heme protein and oxygen transport (33, 34). Although the average human body contains 3 to 4 g of iron, only about 1 mg is lost daily (33, 35-37), which represents negligible elimination. Similarly, biotechnology derived proteins (biologicals) often undergo catabolism which generates amino acids that are re-used by the organism (22). This is the case for the biological product pegloticase.
2.1.6 Bioavailability
Extravascular routes of drug administration, in particular the oral route, are the generally preferred route of administration (38), which explains in part why over 60% of currently marketed products are for oral administration (39, 40). Although this route of administration is favoured, absorption and metabolism can be huge impediments to its use, since both phenomena can contribute to a decreased bioavailability (F).
Bioavailability is a contraction of the terms “biological availability” (41) and it is defined as “the rate and extent to which the active drug ingredient or therapeutic moiety is absorbed from a drug product and becomes available at the site of drug action” (42). In other words, bioavailability indicates the proportion of an administered drug dose that attains the site of action, after accounting for the fraction that is not absorbed as well as the fraction that undergoes metabolism in the gut or liver (21, 43).
The European Agency for the Evaluation of Medicinal Products (EMEA), Committee for Proprietary Medicinal Products, has also defined F in a similar manner, but has nuanced its description by replacing “site of drug action” by the phrase “general circulation” (44). The latter definition reflects the difficulties faced with measuring drug levels at the site of action, which can be highly impractical and extremely invasive. Instead, it is often assumed, as in this definition, that drug concentrations in the general
circulation (for instance as characterized by venous plasma concentrations) are indicative of drug levels at the site of action.
The use of plasma (or urinary) concentrations to calculate metrics for rate and extent of drug exposure is widely accepted as a surrogate for concentrations at the site of action, for drugs that reach the systemic circulation before or at the same time as they reach their site(s) of activity. Maximal observed serum or plasma concentration (Cmax) is associated with the rate of exposure, or how quickly drug concentrations attain their peak level, while area under the plasma/serum concentration time curve (AUC) is a measure of the overall extent of drug exposure. In Phase 1 studies, both parameters are calculated using noncompartmental PK analysis (45), which, is a robust approach when many plasma samples are available. This method of analysis is described in more detail in Section 3.1.
2.2 Pharmacodynamics
The drug development process is ultimately concerned with bringing a product to the market that will exert a desired effect or elicit a particular response. Such drug responses, otherwise known as pharmacodynamics, are intrinsically linked to PK and will be briefly described in this section. For a more detailed overview of the subject, the reader is referred to a book chapter previously published by our laboratory (46). A review of PK-PD modeling in a historical context (covering the 1960’s until 2004) has also been published by Csajka and Verotta (47).
2.2.1 Classification of Effects
The pharmacological activity of a drug comprises both beneficial and harmful effects, the former generally being the reason for which the drug is administered. Although a drug may be administered with a specific purpose in mind, such as eradicating bacteria to treat an infection, other unwanted effects can occur, such as diarrhea. One of the challenges of drug therapy is finding the right balance between these pharmacodynamic effects, to help patients while avoiding undesirable effects as much as possible.
15
Pharmacological responses can be categorized broadly as quantal or continuous variables. Quantal responses are discrete categorical responses that do not belong to a continuum of responses. Such responses include dichotomous responses (awake/asleep) or polychotomous responses (grades of hematological toxicity) (48). Continuous responses can include laboratory values such as triglyceride levels or other clinical results such as heart rate.
PD responses can range from easily measured short-term responses (such as decrease in plasma glucose level or decrease in pain), to long-term outcomes (for instance increased survival or decrease of the risk of irreversible morbidity). A PD response can be considered to be a “clinical endpoint”, which is defined as a characteristic or variable that reflects how a patient feels, functions or survives (49-51). When clinical endpoints are difficult to assess, surrogate endpoints that are a substitute for clinical endpoints provide an alluring alternative especially when there are severe time constraints. For instance, the desired clinical outcome of a drug may be a decrease in mortality and it may be difficult to wait for information on patient mortality. Therefore, it would be more practical to associate drug levels with a biomarker that is easily and quickly detectable (52, 53). By definition, a biomarker is “a characteristic that is objectively measured as an indicator of normal or pathologic, biologic or pathogenic processes, or pharmacological responses to a therapeutic indication” (49, 51). Biomarkers can server diagnostic purposes (for prognostic purposes or to guide therapeutic choices), they can measure disease activity, they can assess drug effect, or they can server as markers of drug kinetics (e.g., polymorphisms transporter proteins or in metabolizing enzymes) (50, 51). Biomarkers that are intended substitutes for clinical endpoints and that are expected to “predict clinical benefit (or harm or lack of benefit or harm) based on epidemiologic, therapeutic, pathophysiologic, or other scientific evidence” are considered “surrogate endpoints” (49-51).
Cases have been reported where the use of a biomarker proved to be successful as a predictor of clinical outcome (e.g. HMG-CoA reductase inhibitors (54)) and could be used as a surrogate endpoint, while in other cases (e.g. antiarrhythmic agents (55, 56)), the
biomarker proved to be inadequate. However, caution must be employed with the use of surrogate endpoints because there is always the danger that they might fail to predict rare, negative side effects that can lead to overall negative clinical outcomes (54).
2.2.2 Types of PK-PD Relationships
A fundamental principle of clinical pharmacology is the link between the PK of the drug and its PD. Although this relationship may not be easily discernible, it is always present. This fundamental relationship is depicted in Figure 2.
Figure 2. Relationship between Drug Pharmacokinetics and Pharmacodynamics
Drugs can exert their effects in a direct or indirect manner. For instance, the drug bivalidurin (57) acts directly on thrombin to produce an anticoagulant effect, while a drug such as warfarin exerts an indirect anticoagulant effect on blood clotting by inhibiting the formation of clotting factors (58). In addition, effects can be reversible or irreversible, or in other terms, the effect will either dissipate or remain well after the drug is no longer present in the system. An example of a reversible drug effect is the bronchodilation caused by theophylline, while irreversible tumour cell death caused by an anticancer drug exemplifies irreversible effects (46).
17
Direct response models can be used to relate a drug’s PK to its PD using linear models (with a slope and intercept), Emax models or sigmoidal Emax models. The ordinary Emax model and sigmoidal Emax model are intuitively appealing because they indicate that there is no effect when drug levels are equal to zero and that, above a certain concentration threshold, increases in concentration cause no further increment in effect (59). Although the ordinary or sigmoidal Emax models are hyperbolic in nature, it must be pointed out that, within certain concentration ranges, the relationship between the concentration and response is linear. For the sigmoidal Emax model, there is a log-linear relationship between concentration and response between 20 to 80% of the maximal effect while below 20% or above 80% of the maximal response, the relationship is non-linear even on a log scale.
In many cases, there is a delay between the change in plasma drug concentrations and the associated drug response and/or the same drug concentration can be associated with different responses. To account for these time-dependent effects, many response models have been developed from the now classic effect compartment (or link) model to the more recent indirect modeling approach. The link model includes an artificial delay compartment where concentrations are in equilibrium with those in the biophase, which results from “collapsing” of the hysteresis curve. The link model attributes the delay in drug response to a process whereby the drug must attain the biophase from systemic circulation (47, 48, 60). As previously described, this process is influenced by many pharmacokinetic factors. Therefore, the observed delay between the pharmacological response and drug concentration levels are related to the time necessary for equilibration of concentrations in the plasma and the effect compartments (61). The drug concentrations in the effect compartment can then be related to the PD marker using direct models such as the Emax model or sigmoidal Emax model.
A major advance was made in our ability to relate the PK to the PD of drugs with the indirect modeling technique proposed by Jusko (60, 62). As the name suggests, indirect models relate drug concentrations to their pharmacological effect by an indirect
mechanism. In this approach, concentrations of drugs inhibit or induce the formation or the elimination of an effect. The basic indirect or turnover model includes Kin (the zero-order
constant for production of the response) and Kout (which represents the first-order rate
constant for loss of the response). An increase in response can be achieved by either stimulation of the response production (Kin) or by inhibition of the loss of response (Kout).
Conversely, a decreased response can be attributed to an inhibition of Kin or a stimulation
of Kout. These four situations, illustrated in Figure 3, correspond to the four basic indirect
models (62, 63). Of course, response can be described by a combination of these four basic models. As with the link model and indirect model, drug effect on Kin or Kout can be
described by an Emax or sigmoidal Emax function. Figure 3. Indirect PD Models
Increased Effect Decreased Effect
E ff ec t on P rod u ct io n E ff ec t on E li m in at ion
19
3. Quantification of Pharmacokinetic and Pharmacodynamic
Properties
The characterization of a drug’s pharmacokinetic and pharmacodynamic behaviour is an essential component of the drug development process. The quantification of these properties allows researchers and drug developers to make informed decisions concerning doses, dosing regimens and clinical benefits, among other things. Improved understanding of a drug’s PK and PD gained from post-marketing studies can also help clinicians use the drug in a more judicious manner.
Essentially, two approaches exist for quantifying the PK and PD of drugs: noncompartmental analysis and compartmental analysis. These analyses can be performed with data obtained from animals or humans, although only the latter will be discussed here. Both methods will be briefly outlined and contrasted in the following sections.
3.1 Noncompartmental Analysis
Noncompartmental analysis stems from statistical moment theory, where parameters describing PK or PD can be easily derived from concentration-time data (45). The rate of drug absorption or exposure is often characterized by the parameters Cmax and Tmax, which represent the maximal observed concentration (in a biological matrix such as blood, plasma or serum) over the time period studied, and time at which this concentration is observed, respectively. For PD parameters, maximal observed effect is often denoted as Emax, while TEmax corresponds to the time associated with this maximal effect.
Following the administration of a single dose of a drug, exposure can be assessed by determining the area-under-the-concentration-time curve (AUC) using linear trapezoidal, log-linear trapezoidal or a combination of both linear and log-linear trapezoidal methods. Using the linear trapezoidal method, the AUC from time zero to time “t” (AUC0-t) is
calculated using the formula in Equation 2. In both equations, a total of n concentrations are available, with the last detectable concentration (Cn) being associated with time tn (45).
Equation 1
1 1 1 1 00
.
5
n i i i i i tC
C
t
t
AUC
Equation 2Kel
C
AUC
AUC
n t
inf 0 0The second term in Equation 2 represents the extrapolated AUC from time t to infinity, and it requires the determination of Kel, or the terminal elimination rate constant. This parameter is calculated by ln-transforming the terminal portion of the concentration-time profile and estimating the slope of this transformed data using linear regression. In turn, this parameter can be used to calculate the terminal half-life (T1/2), using Equation 3.
T1/2 represents the time necessary for the amount of drug in the organism to decrease by
50%. It should be noted that for PD analyses, the term AUC is replaced by the term AUEC to denote “area-under-the-effect-curve”. Equation 3
T
Kel
)
2
ln(
2 / 1
The area-under-the-first-moment-curve (AUMC) also requires the determination of Kel. Equation 4 and Equation 5 can be used to calculate AUMC from time zero to time t (AUMC0-t) and AUMC from time zero to infinity (AUMC0-inf), respectively.
Equation 4
1 1 1 1 1 00
.
5
n i i i i i i i tt
C
t
C
t
t
AUMC
Equation 5 0 inf 0
Kel
2C
Kel
t
C
AUMC
AUMC
n n n t
21
Other pharmacokinetic parameters can be calculated using the ones described above. Following the administration of a drug by the IV route, the mean residence time (MRT) can be calculated by dividing AUMC0-inf by AUC0-inf and subtracting half of the
duration of infusion. MRT represents the average time spent by a molecule in the body, or the time necessary for 63.2% of an intravenously administered drug to be eliminated from the organism if the drug’s PK is well described by a 1-compartment model (45).
The body’s capacity to eliminate a drug is often characterized by clearance (CL). Clearance is often expressed as a volume per time unit (such as L/h), representing the volume of blood or plasma that is cleared of the drug per unit of time. For a drug administered intravenously, clearance is calculated as dose divided by AUC0-inf. For an
orally administered drug, the formula is similar except that it is an apparent clearance (CL/F) that is calculated, since the dose in the numerator is actually the bioavailable dose (dose x F), which is not necessarily the total dose. The total volume of distribution (Vss/F for a parenteral dose), which does not necessarily correspond to a true physiological volume, can also be determined by noncompartmental methods. This parameter should be viewed as a constant that relates the amount of drug in the body to the measured concentration at pseudo equilibrium, and it can be calculated as CL x MRT following single-dose intravenous administration of a drug. Should the drug be administered by an extra-vascular route, the volume of distribution can then be approximated in the terminal phase and is denoted by Varea/F or Vz/F. Generally, Vss/F is a much more meaningful parameter than Varea/F, but it should be noted that both parameters are equivalent if the PK of the drug follows a one-compartment model.
If concentration data obtained following IV and oral administration of a drug are available, it is possible to calculate the absolute bioavailability (F) of the orally administered product using noncompartmental analysis, as demonstrated by Equation 6. Similarly, the relative bioavailability (Frel) of two products can also be determined with AUCs using Equation 7.
Equation 6 IV oral oral IV AUC Dose AUC Dose F Equation 7 ref test test ref rel AUC Dose AUC Dose F
In order to perform noncompartmental analyses in a robust manner, it is necessary to include an important number of concentration values sampled at appropriate times. The trapezoidal method of calculating AUC actually provides an approximation of the true AUC (which could be determined by integrating the function describing the concentration as a function of time over the desired time interval), therefore more samples leads to a better approximation (45). In addition to requiring an important number of concentration values (biological samples), noncompartmental analyses should only be applied when certain assumptions hold true. The first assumption is that the drug in question displays linear pharmacokinetics (45, 64). In other words, exposure increases in proportion with increasing dose and PK parameters are stable through time. A second important assumption is that the drug is eliminated from the body strictly from the pool in which it is being measured, the plasma, for example (64, 65). Finally, this approach assumes that all sources of the drug are direct and unique to the measured pool (64). Examples of drugs which may not be candidates for noncompartmental analyses because they do not fulfill these criteria include iron supplements and thyroid hormones (66).
3.2 Compartmental Analysis
The essence of compartmental analysis is to create a model defined by integrated, matrix, or partial differential equations (equations that have derivatives with respect to more than one variable) that describe the PK or PD behaviour of a drug. Although this approach may not explain the true mechanisms underlying PK or PD behaviour, important correlations between covariates and parameters may point the way to further studies or provide deeper mechanistic understanding (67). Among other advantages of this method are its use in special populations (such as pediatric or hepatic impairment patients) and its
23
potential partitioning of variability into inter-individual, intra-individual, inter-occasion and residual sources (68).
Various types of compartmental analyses exist, ranging from individual analysis to population PK modeling including the naïve pooled data approach, the standard two stage approach, and non-linear mixed effect modeling that includes among others the iterative two stage, the First Order Conditional Estimation (FOCE) and the MLEM (Maximum likelihood Expectation Maximization) approaches (67, 69, 70). In these last approaches, all data is modeled simultaneously while retaining individual information, in order to obtain estimates of population mean and variance as well as quantify sources of variability (68, 71).
At the core of compartmental analyses is non-linear regression. In contrast with linear regression, where data is being fitted with a straight line defined by a slope and intercept, non-linear regression depends on equations whose partial derivatives (with respect to each of the parameters) involve other model parameters (72). Another important difference between the two types of regressions is that linear regressions have analytical solutions, such that the functions can be manipulated to obtain a specific equation for the solution, while only numerical solutions exist for non-linear regressions. For non-linear equations, approximate solutions to the equations can only be obtained through iterative processes that are described in further detail below. Since most biological processes are described by non-linear equations, linear regressions will not be examined any further. 3.2.1 Individual Analysis
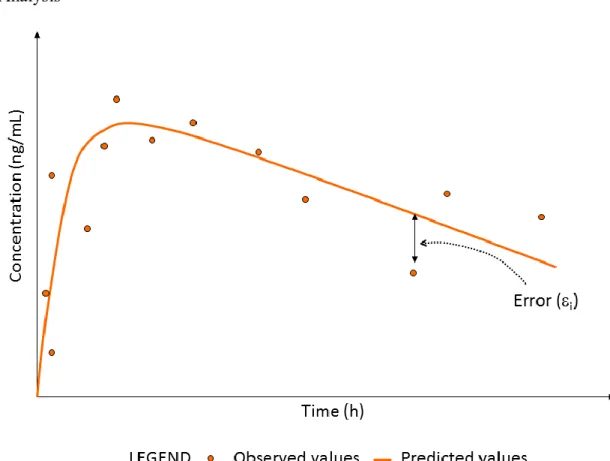
As its name implies, individual analysis involves the development of a model using data from one source (such as one human or one animal). Because of the error that is always inherent in data, whether it be related to the collection procedures themselves or to analytical assays, a model can never perfectly predict the observed data. The relationship between observed and predicted concentration values must therefore account for this error, as defined in Equation 8. In this equation, Xi represents a vector of known values (such as
dose and sampling times), Ci represents the vector of observed concentrations, i represents
the measurement errors, j represents the vector of model parameters (in other words the
pharmacokinetic parameters) and ƒi is the function that relates Ci to j and Xi. The
subscript i represents the total number of observations or values. Equation 8 Ci fi
j,Xi
iThe successful creation of a model might give rise to a semi-log concentration-time profile similar to the one in Figure 4.
Figure 4. Example of a Concentration Time Profile from Individual Compartmental Analysis
25
3.2.1.1 Numerical Approaches for Individual Analyses
The aim of PK compartmental analysis is to develop a model that is associated with predicted concentration values (or whatever observation is being studied) that are as close as possible to the observed values. In other words, the goal is to minimize the difference between the predicted and observed values (represented by i in Equation 8), and generally
the least-squares and maximum likelihood approaches are used to quantify these differences (73).
Various least-squares metrics (often termed “residual sum of squares”) can be used to quantify these differences, and they are outlined in Table 1 below (72, 73).
Table 1. Comparison of Least-Squares Methods
Method Objective Function Formula Characteristics
Ordinary least squares (OLS)
n 1 i 2 i i OLS (C Cˆ ) O No weighting Weighted least squares (WLS)
n 1 i 2 i i i WLS W(C Cˆ )O Model and parameters
must be defined and stated empirically Extended least squares (ELS) or Maximum Likelihood (ML)
n 1 i i 2 i i i ELS W(C Cˆ ) ln(var(Cˆ ))O Models can be defined, but
parameters of the models are fitted within the
procedure, e.g., ) Cˆ var( 1 Wi i
Ĉi = predicted ith concentration value, Ci = observed ith concentration value, Wi = weighting factor, n = number of observations, var = variance
Although it is a simple formula, OOLS is inherently biased because it tends to favour
ones. The WLS and ML/ELS approaches are an improvement over the OLS method since they account for the magnitude of observations (and their relative variability) by incorporating a weighting factor into their formulas. The ML/ELS approaches differ from the least-squares approach, because they deal with the probability of observing the actual data given the model and its parameter estimates. In these methods, the function that is being minimized is the log-likelihood (LL), or the probability of observing the actual concentration values given a set of model parameter estimates. The function for LL is presented in Equation 9. It should be noted that the only difference between ELS and ML is in the assumptions about the distribution of the variance parameters. In the ML approach, the distribution is assumed to be normal, while the ELS approach makes no such assumption (74). Equation 9
2
2 2 2 2 n n C C Ln n Ln n C LL i i
Because it is easier to minimize a positive number rather than a negative one, the LL is often multiplied by -2 to obtain a positive number called the “-2LogLikelihood” (-2LL).
3.2.1.2 Algorithms for Numerical Problem Solving
Since many combinations of parameter estimates must be evaluated in order to find the parameters that minimize one of the objective functions described previously, many algorithms have been developed to systematically do so. Some algorithms apply linearization techniques to approximate the model using linear equations. Cauchy’s method employs a first-order Taylor series expansion, Newton or Newton-Raphson based methods utilize a second-order Taylor series expansion while the Gauss-Newton method iteratively uses multiple linear regressions via first-order Taylor series expansion. The Levenberg-Marquardt method is another algorithm which includes a modification of the