Pépite | Gestion et durabilité des réseaux d’assainissement dans le cadre des villes intelligentes
204
0
0
Texte intégral
(2) Thèse de Yves Abou Rjeily, Lille 1, 2016. © 2016 Tous droits réservés.. lilliad.univ-lille.fr.
(3) Thèse de Yves Abou Rjeily, Lille 1, 2016. Management and Sustainability of Urban Drainage Systems within Smart Cities. Abstract This work presents the Real Time Control (RTC) of Urban Drainage Systems (UDS) within smart cities. RTC requires to understand the system operation and to perform simulations on measured, forecasted, and synthetic events. Therefore, a Real Time Monitoring system (RTM) was implemented on the experimental site, and combined to a simulation model. A model autocalibration process and hydraulic boundary conditions forecast system were developed in order to simulate the hydrologic-hydraulic response. Aiming to protect the citizens and mitigate flooding consequences, the RTC was composed of a flooding forecast system followed by a dynamic management strategy. The proposed concept and methodologies were applied and evaluated on the Lille 1 University Campus, within the SunRise project. It was concluded through the applications, that visualizing the structural observations found during inspections, which are temporally and geographically localized within a GIS database, is an efficient technique in detecting structural critical zones. In parallel, RTM was found very helpful in understanding the system operation and calibrating the simulation model. Genetic Algorithm followed by Pattern Search formed an effective auto-calibration procedure for the simulation model. NARX Neural Network was developed and validated for forecasting the hydraulic boundary conditions required for conducting simulations on un-measured events. Once understanding the UDS operations, the RTC was developed. NARX Neural Network was found capable to forecast flooding events in critical areas, where flooding may appear, based on a weather forecast system. A dynamic management for increasing a tank retention capacity was studied based on calculating a Valve State Schedule, and results were satisfying by using Genetic Algorithm and a modified form of Artificial Bee Colony, as optimization methods. A qualitative management was also proposed and tested for verifying its potential in reducing flooding volumes, and good results were obtained.. Keywords Smart Cities, Urban Drainage Systems, Real Time Monitoring, Auto-Calibration, Optimization Algorithms, Flooding Forecast, NARX Neural Networks, Dynamic Management. III © 2016 Tous droits réservés.. lilliad.univ-lille.fr.
(4) Thèse de Yves Abou Rjeily, Lille 1, 2016. © 2016 Tous droits réservés.. lilliad.univ-lille.fr.
(5) Thèse de Yves Abou Rjeily, Lille 1, 2016. Gestion et Durabilité des Réseaux d’Assainissement dans le Cadre des Villes Intelligentes. Résumé Ce travail présente le Contrôle en Temps Réel (CTR) des Réseaux d’Assainissement (RA) dans le cadre des villes intelligentes. Le CTR nécessite de comprendre le fonctionnement du système et d'effectuer des simulations sur des évènements mesurés, prévus et synthétiques. Par conséquent, un système de Surveillance en Temps Réel (STR) a été mis en œuvre sur le site expérimental, et combinée à un modèle de simulation. Une méthode d'auto-calage des modèles hydrauliques et un système de prévision des conditions aux limites, ont été développés, afin de simuler la réponse hydrologique-hydraulique des RA. Visant à protéger les citoyens et d'atténuer les conséquences des inondations, le CTR est composé d'un système de prévision des inondations suivi d'une stratégie de gestion dynamique. Le concept et les méthodes proposées ont été appliqués et évalués sur le campus de l'Université de Lille 1, au sein du projet SunRise. Il a été conclu à travers les résultats, que la visualisation des observations constatées lors des inspections, qui ont été temporellement et géographiquement localisés au sein d'une base de données SIG, est une technique efficace pour la détection des zones structurellement critiques. En parallèle, STR a été trouvé très utile pour comprendre le fonctionnement du système et le calage du modèle de simulation. L'Algorithme Génétique suivi par Pattern Search a formé une procédure d'auto-calage efficace pour le modèle de simulation. NARX Neural Network a été développé et validé pour la prévision des conditions aux limites hydrauliques, nécessaires pour effectuer des simulations sur des événements non-mesurée. Une fois l’opération du RA est analysée, un CTR a été développé. NARX Neural Network est trouvé capable de prévoir les inondations dans les zones critiques, où elles tendent à apparaître, sur la base d'un système de prévision météorologique. Une gestion dynamique pour augmenter la capacité de rétention du réservoir, a été étudiée sur la base du calcul de la variation temporaire optimale de l’ouverture d’une vanne, et les résultats ont été satisfaisants en utilisant l'Algorithme Génétique et l’Algorithme des Abeilles, comme méthodes d'optimisation. Une gestion qualitative a également été examinée et testée pour vérifier son potentiel dans la réduction des volumes d'inondation, et des bons résultats ont été obtenus.. Mots Clés Ville Intelligentes, Réseau d’Assainissement, Surveillance en Temps Réel, Auto-Calage, Algorithmes d’Optimisation, Prévision des Inondations, Réseau de Neurones NARX, Gestion Dynamique.. V © 2016 Tous droits réservés.. lilliad.univ-lille.fr.
(6) Thèse de Yves Abou Rjeily, Lille 1, 2016. © 2016 Tous droits réservés.. lilliad.univ-lille.fr.
(7) Thèse de Yves Abou Rjeily, Lille 1, 2016. Acknowledgment The greatest challenge to any thinker is stating the problem in a way that will allow a solution. Bertrand Russell. Undertaking this PhD has been a truly challenge and experience for me and it would not have been possible without the support and guidance that I received from my surroundings. First, I want to thank my supervisors, Dr. Marwan SADEK "HDR at Lille 1 University", Dr. Fadi EL HAGE CHEHADE "Professor at Lebanese University" and Dr. Elias EL HACHEM "Professor at Lebanese University", who gave me the opportunity and the orientation to do this wonderful project on the topic of Management and Sustainability of Urban Drainage Systems within Smart Cities. I would like also to express my special appreciations and thanks to all my committee members, Dr. Fadi COMAIR "Professor at Notre Dame University and General Director of the Ministry of Energy and Water - Lebanon", Dr. Aziz SOULHI "Professor at Ecole Nationale Supérieure des Mines - Rabat", Dr. Mathieu ZUG "Scientific and Innovation Director at Ijinus", Dr. Isam SHAHROUR "Professor at Lille 1 University" and Dr. Fawaz EL OMAR "Professor at Lebanese University", for accepting to evaluate my thesis work. I would like also to acknowledge them for their brilliant questions, comments and suggestions made during my defense. I am especially grateful to all my labmates and friends who helped me a lot in finalizing this project within the last three years. Foremost, I begin by thanking my special colleague Oras ABBAS for all her help, support and encouragement, which were very helpful in completing this work. I thank also Mahdi KHADRA for his support and advices. A special thank for my best friends Samer SEMAAN, Marc YOUNES, Georges ISHAK and Nicole KHOUEIRY for being by my side all this time. My special thank also goes out to my lady Desirée KHOUEIRY for understanding, supporting, encouraging and helping me with all the difficulties I encountered during these years. Finally, I would like to acknowledge my family. Words cannot express how grateful I am to my father Elie, mother Violette, sister Elvy and brother Michel, for all of the sacrifices that they have made on my behalf. You were really amazing and helpful to me. We should be taught not to wait for inspiration to start a thing. Action always generates inspiration. Inspiration seldom generates action. Frank Tibolt. VII © 2016 Tous droits réservés.. lilliad.univ-lille.fr.
(8) Thèse de Yves Abou Rjeily, Lille 1, 2016. © 2016 Tous droits réservés.. lilliad.univ-lille.fr.
(9) Thèse de Yves Abou Rjeily, Lille 1, 2016. Table of Contents Table of Contents ........................................................................................................................9 List of Figures ........................................................................................................................... 12 List of Tables ............................................................................................................................ 17 List of Abbreviations................................................................................................................. 18 General Introduction ............................................................................................................. 19 Chapter 1: Urban Drainage Systems within Smart Cities: State of the Art & Emerging Challenges ............................................................................................................................ 23 1.1 Introduction ..................................................................................................................... 24 1.2 Failures and Pollution sources ......................................................................................... 26 1.2.1 Wastewater Sources and Pollution ............................................................................ 27 1.2.2 Pollution Types and Characteristics .......................................................................... 28 1.3 Alternative Structure ....................................................................................................... 30 1.3.1 Principles of Alternative Techniques ......................................................................... 31 1.3.2 Types of Alternative Techniques ............................................................................... 31 1.3.3 Pretreatment for Alternative Structures ..................................................................... 35 1.3.4 Example of Implemented Alternative Structures ....................................................... 36 1.4 Real Time Monitoring Data ............................................................................................. 36 1.4.1 Controlling UDS ....................................................................................................... 37 1.4.2 Real Time Measurement Uncertainties ...................................................................... 38 1.4.3 Monitoring System Architecture ............................................................................... 39 1.4.4 Parameters Measurement Types ................................................................................ 40 1.4.5 Vision Capabilities.................................................................................................... 41 1.4.6 Measurement System Implementation ....................................................................... 41 1.4.7 Transmitting and Filtering Data ................................................................................ 44 1.4.8 Real Time Measured Data Verification ..................................................................... 45 1.4.9 Management Strategy Programming Rules ............................................................... 46 1.5 UDS within Smart Cities ................................................................................................. 46 1.5.1 Smart City Concept................................................................................................... 46 1.5.2 Applications ............................................................................................................. 47 1.5.3 Smart UDS Concept ................................................................................................. 48 1.5.4 Prioritization and Smart Rehabilitation of UDS ......................................................... 49 1.5.5 Smart Information Log within a Geographical Layer ................................................ 50 1.5.6 Monitored UDS within Smart Cities ......................................................................... 52 1.6 Management Practices ..................................................................................................... 53 1.6.1 Infiltration Process .................................................................................................... 54 1.6.2 Smart Treatment Process .......................................................................................... 54 1.6.3 Management Strategies ............................................................................................. 55 1.6.4 Real Time Monitoring Contribution in Researches and System Design ..................... 58 IX © 2016 Tous droits réservés.. lilliad.univ-lille.fr.
(10) Thèse de Yves Abou Rjeily, Lille 1, 2016. 1.6.5 Implementation and Verification of a Management Study ......................................... 59 1.7 Conclusion ...................................................................................................................... 60 1.8 References ....................................................................................................................... 63 Chapter 2: Site Description and Real Time Monitoring System Implementation .................... 77 2.1 Introduction ..................................................................................................................... 78 2.2 Geographic Information System ...................................................................................... 78 2.3 Lille 1 University Campus ............................................................................................... 79 2.3.1 Urban Drainage System at Lille 1 University Campus............................................... 81 2.4 GIS Layers for Interventions and Actions ........................................................................ 84 2.5 UDS Hydraulic Operation ............................................................................................... 88 2.6 Monitored and Studied Sector of Lille 1 University Campus ............................................ 90 2.7 Types and Characteristics of Implemented Sensors .......................................................... 93 2.7.1 Weather Station ........................................................................................................ 93 2.7.2 Water Depth Meter ................................................................................................... 94 2.7.3 Flowmeter ................................................................................................................ 96 2.7.4 Turbidity Meter ........................................................................................................ 98 2.7.5 Transmission .......................................................................................................... 100 2.7.6 Data management ................................................................................................... 100 2.8 Infiltration Potential....................................................................................................... 101 2.9 Conclusion .................................................................................................................... 102 Chapter 3: Auto-Calibration and Boundary Conditions Forecast of Urban Drainage Systems Models ................................................................................................................................ 105 3.1 Introduction ................................................................................................................... 106 3.2 Modelling ...................................................................................................................... 107 3.3 Auto-Calibration Method............................................................................................... 107 3.3.1 Genetic Algorithm .................................................................................................. 108 3.3.2 Pattern Search ......................................................................................................... 110 3.4 Calibration Process ........................................................................................................ 111 3.4.1 Objective Function.................................................................................................. 113 3.4.2 Efficiency Criteria .................................................................................................. 114 3.4.3 Rainfall Events Selection ........................................................................................ 115 3.5 Real Time Monitoring Data ........................................................................................... 116 3.6 Calibration Results and Discussions .............................................................................. 117 3.7 Forecasting Downstream Boundary Conditions ............................................................. 123 3.7.1 Nonlinear Autoregressive Network with Exogenous Inputs ..................................... 124 3.7.2 Artificial Neural Network to Resolve NARX Model ............................................... 125 X © 2016 Tous droits réservés.. lilliad.univ-lille.fr.
(11) Thèse de Yves Abou Rjeily, Lille 1, 2016. 3.7.3 Forecasting Application .......................................................................................... 126 3.8 Verification ................................................................................................................... 130 3.9 Conclusion .................................................................................................................... 132 3.10 References ................................................................................................................... 134 Chapter 4: Flooding Forecast System and Dynamic Management Strategy ......................... 141 4.1 Introduction ................................................................................................................... 142 4.2 Real Time Control ......................................................................................................... 143 4.3 Analysis of the Actual Urban Drainage System Operation ............................................. 145 4.3.1 Modelling Results on Storm Event of 31 August 2015 ............................................ 146 4.3.2 UDS Operation Subjected to Synthetic Storm Events .............................................. 148 4.4 Localization of the Critical Zones .................................................................................. 154 4.5 Flooding Forecast System .............................................................................................. 156 4.5.1 NARX Neural Network for Flooding Forecast System ............................................ 157 4.5.2 Verification of the NARX Neural Network as Flooding Forecast System ................ 158 4.6 Dynamic Management Strategy ..................................................................................... 163 4.6.1 Optimization Algorithms ........................................................................................ 165 4.6.2 Results and Observations of the Dynamic Management .......................................... 171 4.7 Qualitative Dynamic Management Proposition .............................................................. 183 4.7.1 Turbidity and Flow Measurements .......................................................................... 184 4.7.2 Qualitative Management Strategy ........................................................................... 187 4.7.3 Results and Discussions of the Qualitative Management ......................................... 189 4.8 Conclusion .................................................................................................................... 190 4.9 References ..................................................................................................................... 193 General Conclusion .............................................................................................................. 199. XI © 2016 Tous droits réservés.. lilliad.univ-lille.fr.
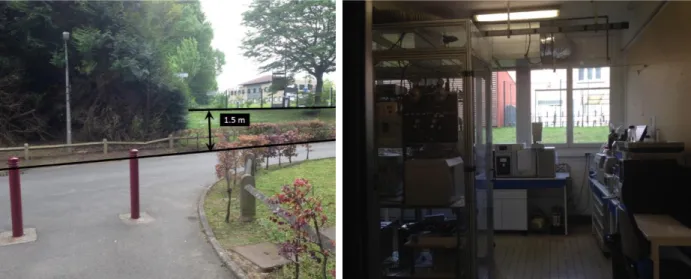
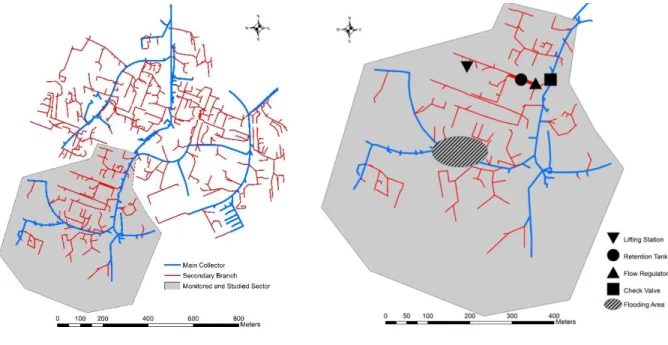
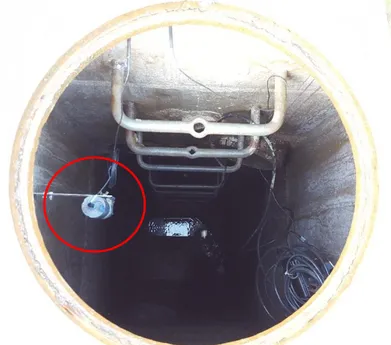
(12) Thèse de Yves Abou Rjeily, Lille 1, 2016. List of Figures Figure 1-1: Inundation at Dubrovnik, (Croatia) - 03 September 2014 ........................................ 26 Figure 1-2: Inundation at Boulogne-sur-Mer, (France) - 26 August 2015................................... 26 Figure 1-3: Different layers of solid deposits in networks .......................................................... 30 Figure 1-4: Storage roof ............................................................................................................ 32 Figure 1-5: Vegetated roof ........................................................................................................ 32 Figure 1-6: Drainage Trench ..................................................................................................... 32 Figure 1-7: Porous pavement ..................................................................................................... 33 Figure 1-8: Retention or detention pond .................................................................................... 33 Figure 1-9: Infiltration basin...................................................................................................... 33 Figure 1-10: Vegetated swale .................................................................................................... 34 Figure 1-11: Ditch ..................................................................................................................... 34 Figure 1-12: Infiltration well ..................................................................................................... 34 Figure 1-13: Drainage system using perforated pipes to increase soil infiltration ....................... 35 Figure 1-14: Oil and sediment separator .................................................................................... 35 Figure 1-15: Neutralization tank ................................................................................................ 35 Figure 1-16: Inline Flowmeter Installation................................................................................. 43 Figure 1-17: Inline Turbidity Meter Installation......................................................................... 43 Figure 1-18: Illustration of Parallel Real Time Measurement By-Pass Chamber ........................ 44 Figure 1-19: Urban Drainage Systems within Smart Cities Concept .......................................... 52 Figure 2-1: Google Earth Photo taken for Lille 1 University Campus ........................................ 80 Figure 2-2: Year of Construction of Lille 1 University Buildings .............................................. 81 Figure 2-3: Stormwater System of Lille 1 University Campus ................................................... 82 Figure 2-4: The Two Separated Watersheds on Lille 1 University Campus ................................ 83 Figure 2-5: Diameter of Stormwater network pipes digitized within the GIS Layers .................. 83 Figure 2-6: Existing Equipment on the UDS of Lille 1 University Campus ............................... 84 Figure 2-7: Inspection Layer within the GIS Database, with an Example of Observations ......... 86 Figure 2-8: Distribution of Total Gravity Factor for Inspected Elements .................................... 87 Figure 2-9: Structural Critical Areas within the UDS of the Campus ......................................... 88 Figure 2-10: Flooding Areas on Lille 1 University Campus ....................................................... 89 Figure 2-11: Topographical Level Difference between the Main Street and the Flooding Area .. 90 Figure 2-12: Underground Laboratories at Lille Engineering Central School ............................. 90 Figure 2-13: Monitored and Studied Sector of the UDS of Lille 1 University Campus ............... 91 Figure 2-14: Existing Equipment on the Studied Sector of the Campus ..................................... 91 Figure 2-15: Monitoring System Installed on the Studied Sector of Lille 1 University Campus . 92 Figure 2-16: Rainfall Intensity and Flow Measurements in 22 November 2015 Storm Event ..... 93 Figure 2-17: Oregon Scientific VMR300 Weather Station ......................................................... 94 Figure 2-18: Display/Receiver Console ..................................................................................... 94 Figure 2-19: Water Depth Meter with a measuring range 0.2 to 3 m .......................................... 95 Figure 2-20: Water Depth Meter installed in the Retention Basin of the Studied Sector ............. 95 XII © 2016 Tous droits réservés.. lilliad.univ-lille.fr.
(13) Thèse de Yves Abou Rjeily, Lille 1, 2016. Figure 2-21: Water Depth Meter with a measuring range 0.3 to 6 m .......................................... 95 Figure 2-22: Water Depth Meter installed in the last manhole of the Studied Sector .................. 95 Figure 2-23: Different Parts of the Flowmeter Installed at the Outfall of the Sector ................... 96 Figure 2-24: Flowmeter with Lithium Battery Pack, Installed at the Outfall .............................. 96 Figure 2-25: Installation of the Battery Pack of Flowmeter at the Outfall................................... 97 Figure 2-26: Installation of the Flowmeter Probe at the Pipe Existing the Outfall ...................... 97 Figure 2-27: Flowmeter Installed Downstream the Retention Tank (Battery & Logger, Probe) .. 97 Figure 2-28: Flowmeter with Rechargeable Battery Pack .......................................................... 97 Figure 2-29: Installation of the Battery Pack of Flowmeter Downstream the Retention Tank ..... 98 Figure 2-30: Installation of the Flowmeter Probe at the Main Collector Pipe ............................. 98 Figure 2-31:Data Logger and Probe of the Turbidity Meter ....................................................... 99 Figure 2-32: Installation of the Turbidity Meter (1) ................................................................... 99 Figure 2-33: Installation of the Turbidity Meter (2) ................................................................... 99 Figure 2-34: Installation of the Data Logger of the Turbidity Meter .......................................... 99 Figure 2-35: Data Logger and Transmitter ............................................................................... 100 Figure 2-36: Installation of the Data Logger and Transmitter................................................... 100 Figure 2-37: Connection Kit .................................................................................................... 101 Figure 2-38: Example of Data Retrieved from Ijitrack Website ............................................... 101 Figure 2-39: Infiltration Potential Based on Soil Type and Thickness of Unsaturated Layer .... 102 Figure 2-40: Regulatory Constraints Limiting the Infiltration Applicability ............................. 102 Figure 3-1: Auto-Calibration Process based on Genetic Algorithm and Pattern Search ............ 108 Figure 3-2: Urban Drainage System within the Studied Sector ................................................ 117 Figure 3-3: Measured and Modelled Flow Comparison for Rainfall Event 14/05/2015 ............ 120 Figure 3-4: Measured and Modelled Flow Comparison for Rainfall Event 25/07/2015 ............ 120 Figure 3-5: Measured and Modelled Flow Comparison for Rainfall Event 30/07/2015 ............ 120 Figure 3-6: Measured and Modelled Flow Comparison for Rainfall Event 04/08/2015 ............ 120 Figure 3-7: Measured and Modelled Flow Comparison for Rainfall Event 24/08/2015 ............ 120 Figure 3-8: Measured and Modelled Flow Comparison for Rainfall Event 26/08/2015 ............ 120 Figure 3-9: Measured and Modelled Flow Comparison for Rainfall Event 13/09/2015 ............ 121 Figure 3-10: Measured and Modelled Flow Comparison for Rainfall Event 05/10/2015 .......... 121 Figure 3-11: Measured and Modelled Flow Comparison for Rainfall Event 28/10/2015 .......... 121 Figure 3-12: Measured and Modelled Flow Comparison for Rainfall Event 07/11/2015 .......... 121 Figure 3-13: Measured and Modelled Flow Comparison for Rainfall Event 27/08/2015 .......... 121 Figure 3-14: Measured and Modelled Flow Comparison for Rainfall Event 31/08/2015 .......... 121 Figure 3-15: Measured and Modelled Flow Comparison for Rainfall Event 19/11/2015 .......... 122 Figure 3-16: Measured and Modelled Flow Comparison for Rainfall Event 21/11/2015 .......... 122 Figure 3-17: Measured and Modelled Flow Comparison for Rainfall Event 26/11/2015 .......... 122 Figure 3-18: Measured and Modelled Flow Comparison for Rainfall Event 11/12/2015 .......... 122 Figure 3-19: Measured and Modelled Flow Comparison for Rainfall Event 30/01/2016 .......... 122 Figure 3-20: Measured and Modelled Flow Comparison for Rainfall Event 08/02/2016 .......... 122 Figure 3-21: Measured and Modelled Flow Comparison for Rainfall Event 09/02/2016 .......... 123 XIII © 2016 Tous droits réservés.. lilliad.univ-lille.fr.
(14) Thèse de Yves Abou Rjeily, Lille 1, 2016. Figure 3-22: Measured and Modelled Flow Comparison for Rainfall Event 04/03/2016 .......... 123 Figure 3-23: NARX Neural Network for Forecasting Downstream Boundary Conditions ........ 128 Figure 3-24: Performance Evaluation through the Training Process Epochs ............................ 129 Figure 3-25: Regression Results of the Trained NARX Network ............................................. 129 Figure 3-26: Comparison of Measured and Forecasted Outfall Water Depth ............................ 131 Figure 3-27: Measured and Modelled Flow Comparison (Rainfall Events 25-30/03/2016) ...... 132 Figure 3-28: Measured and Modelled Flow Comparison for Rainfall Event 27/03/2016 .......... 132 Figure 3-29: Measured and Modelled Flow Comparison for Rainfall Event 28/03/2016 .......... 132 Figure 3-30: Measured and Modelled Flow Comparison for Rainfall Event 29/03/2016 .......... 132 Figure 4-1: Model Results for the Storm Event of 31 August 2015 - 14:09 .............................. 146 Figure 4-2: Flooding near Lille Engineering Central School .................................................... 147 Figure 4-3: Model Results for the Storm Event of 31 August 2015 - 15:11 .............................. 148 Figure 4-4: Synthetic Strom Event of 1 Year Return Period..................................................... 150 Figure 4-5: Synthetic Strom Event of 2 Year Return Period..................................................... 150 Figure 4-6: Synthetic Strom Event of 5 Year Return Period..................................................... 150 Figure 4-7: Outfall Water Depth for the Event of 5 Year Return Period ................................... 151 Figure 4-8: Outfall Water Depth for the Event of 1 Year Return Period ................................... 151 Figure 4-9: Outfall Water Depth for the Event of 2 Year Return Period ................................... 151 Figure 4-10: Model Results for the 5 Year Return Period Synthetic Storm Event – 1:03.......... 153 Figure 4-11: Model Results for the 5 Year Return Period Synthetic Storm Event – 3:03.......... 154 Figure 4-12: Locations of the Critical Manholes ...................................................................... 155 Figure 4-13: NARX Neural Network for Forecasting Flooding Events .................................... 157 Figure 4-14: Performance Evaluation through the Training Process Epochs ............................ 158 Figure 4-15: Regression Results of the Trained NARX Neural Network.................................. 158 Figure 4-16: Modelled and Forecasted Water Depth at Critical Manhole 1 – 1 YRP Event ...... 160 Figure 4-17: Modelled and Forecasted Water Depth at Critical Manhole 1 – 2 YRP Event ...... 160 Figure 4-18: Modelled and Forecasted Water Depth at Critical Manhole 1 – 5 YRP Event ...... 160 Figure 4-19: Modelled and Forecasted Water Depth at Critical Manhole 2 – 1 YRP Event ...... 160 Figure 4-20: Modelled and Forecasted Water Depth at Critical Manhole 2 – 2 YRP Event ...... 160 Figure 4-21: Modelled and Forecasted Water Depth at Critical Manhole 2 – 5 YRP Event ...... 160 Figure 4-22: Modelled and Forecasted Water Depth at Critical Manhole 3 – 1 YRP Event ...... 161 Figure 4-23: Modelled and Forecasted Water Depth at Critical Manhole 3 – 2 YRP Event ...... 161 Figure 4-24: Modelled and Forecasted Water Depth at Critical Manhole 3 – 5 YRP Event ...... 161 Figure 4-25: Modelled and Forecasted Water Depth at Critical Manhole 4 – 1 YRP Event ...... 161 Figure 4-26: Modelled and Forecasted Water Depth at Critical Manhole 4 – 2 YRP Event ...... 161 Figure 4-27: Modelled and Forecasted Water Depth at Critical Manhole 4 – 5 YRP Event ...... 161 Figure 4-28: Modelled and Forecasted Water Depth at Critical Manhole 5 – 1 YRP Event ...... 162 Figure 4-29: Modelled and Forecasted Water Depth at Critical Manhole 5 – 2 YRP Event ...... 162 Figure 4-30: Modelled and Forecasted Water Depth at Critical Manhole 5 – 5 YRP Event ...... 162 Figure 4-31: Valve State Schedule Optimization Process......................................................... 163 Figure 4-32: Calculation Steps of the Modified Artificial Bee Colony ..................................... 170 XIV © 2016 Tous droits réservés.. lilliad.univ-lille.fr.
(15) Thèse de Yves Abou Rjeily, Lille 1, 2016. Figure 4-33: VSS Calculated for 10 Trials on 5 YRP Event by GA (Population=30) ............... 173 Figure 4-34: Performance of GA in Reducing Flooding Volume (Population=30 - 5 YRP) ..... 173 Figure 4-35: VSS Calculated for 10 Trials on 5 YRP Event by GA (Population=60) ............... 173 Figure 4-36: Performance of GA in Reducing Flooding Volume (Population=60 - 5 YRP) ..... 173 Figure 4-37: VSS Calculated for 10 Trials on 5 YRP Event by GA (Population=90) ............... 173 Figure 4-38: Performance of GA in Reducing Flooding Volume (Population=90 - 5 YRP) ..... 173 Figure 4-39: VSS Calculated for 10 Trials on 5 YRP Event by GA (Population=120) ............. 174 Figure 4-40: Performance of GA in Reducing Flooding Volume (Population=120 - 5 YRP).... 174 Figure 4-41: VSS Calculated for 10 Trials on 5 YRP Event by GA (Population=150) ............. 174 Figure 4-42: Performance of GA in Reducing Flooding Volume (Population=150 - 5 YRP).... 174 Figure 4-43: VSS Calculated for 10 Trials on 5 YRP Event by ABC (Population=30) ............. 175 Figure 4-44: Performance of ABC in Reducing Flooding Volume (Population=30 - 5 YRP) ... 175 Figure 4-45: VSS Calculated for 10 Trials on 5 YRP Event by ABC (Population=60) ............. 175 Figure 4-46: Performance of ABC in Reducing Flooding Volume (Population=60 - 5 YRP) ... 175 Figure 4-47: VSS Calculated for 10 Trials on 5 YRP Event by ABC (Population=90) ............. 176 Figure 4-48: Performance of ABC in Reducing Flooding Volume (Population=90 - 5 YRP) ... 176 Figure 4-49: VSS Calculated for 10 Trials on 5 YRP Event by ABC (Population=120) ........... 176 Figure 4-50: Performance of ABC in Reducing Flooding Volume (Population=120 - 5 YRP) . 176 Figure 4-51: VSS Calculated for 10 Trials on 5 YRP Event by ABC (Population=150) ........... 176 Figure 4-52: Performance of ABC in Reducing Flooding Volume (Population=150 - 5 YRP) . 176 Figure 4-53: Comparaison of GA and ABC Performaces (Population=30 – 5 YRP) ................ 177 Figure 4-54: Comparaison of GA and ABC Performaces (Population=60 – 5 YRP) ................ 177 Figure 4-55: Comparaison of GA and ABC Performaces (Population=90 – 5 YRP) ................ 177 Figure 4-56: Comparaison of GA and ABC Performaces (Population=120 – 5 YRP) .............. 177 Figure 4-57: Comparaison of GA and ABC Performaces (Population=150 – 5 YRP) .............. 178 Figure 4-58: Average Performances for the 5 Population Sizes by GA (5YRP) ....................... 179 Figure 4-59: Average Performances for the 5 Population Sizes by ABC (5YRP) ..................... 179 Figure 4-60: Average Performances for the 5 Population Sizes by GA (31 August 2015) ........ 180 Figure 4-61: Average Performances for the 5 Population Sizes by ABC (31 August 2015) ...... 180 Figure 4-62: Rainfall Intensity During the Storm Event of 31 August 2015 ............................. 181 Figure 4-63: Flow in the Main Collector and Optimal VSS for the Event of 31 August 2015 ... 181 Figure 4-64: Rainfall Intensity During the Synthetic Storm Event of 5 YRP ............................ 182 Figure 4-65: Flow in the Main Collector and Optimal VSS for the Synthetic Event of 5 YRP . 182 Figure 4-66: Flowmeter and Turbidity Meter Implemented on the Lille 1 University Campus . 184 Figure 4-67: Measured Flow and Turbidity during the Rainfall Event of 25 September 2015 .. 185 Figure 4-68: Measured Flow and Turbidity during the Rainfall Event of 30 September 2015 .. 185 Figure 4-69: Measured Flow and Turbidity during the Rainfall Event of 4 August 2015.......... 185 Figure 4-70: Measured Flow and Turbidity during the Rainfall Event of 26 August 2015 ........ 185 Figure 4-71: Measured Flow and Turbidity during the Rainfall Event of 31 August 2015 ........ 186 Figure 4-72: Measured Flow and Turbidity during the Rainfall Event of 19 November 2015 ... 186 Figure 4-73: Measured Flow and Turbidity during the Rainfall Event of 11 December 2015 ... 186 XV © 2016 Tous droits réservés.. lilliad.univ-lille.fr.
(16) Thèse de Yves Abou Rjeily, Lille 1, 2016. Figure 4-74: Measured Flow and Turbidity during the Rainfall Event of 30 January 2016 ....... 186 Figure 4-75: Locations of Manholes for Qualitative Management Application ........................ 188. XVI © 2016 Tous droits réservés.. lilliad.univ-lille.fr.
(17) Thèse de Yves Abou Rjeily, Lille 1, 2016. List of Tables Table 1-1: Proportion of Particulate Pollution Over Total Pollution ........................................... 29 Table 2-1: Grid for Gravity Evaluations of Observations ........................................................... 87 Table 2-2: Characteristics of Pipes within Critical Areas ........................................................... 88 Table 3-1: Calibrated Parameters of SWMM Model ................................................................ 118 Table 3-2: Rainfall Events for Calibration and Verification Purposes ...................................... 119 Table 4-1: Montana Coefficient for Region 1 in France ........................................................... 149 Table 4-2: Synthetic Storm Event Carachteristics .................................................................... 150 Table 4-3: Synthetic Storm Event Carachteristics .................................................................... 150 Table 4-4: Synthetic Storm Event Carachteristics .................................................................... 150 Table 4-5: Nash Sutcliffe Efficiency for the 5 Critical Manholes ............................................. 159 Table 4-6: Modelled over Forecasted Peaks for the 5 Critical Manholes .................................. 159 Table 4-7: Characteristics of Rainfall Events ........................................................................... 184. XVII © 2016 Tous droits réservés.. lilliad.univ-lille.fr.
(18) Thèse de Yves Abou Rjeily, Lille 1, 2016. List of Abbreviations . 1-D SVE: One-Dimensional Saint-Venant Equation ANN: Artificial Neural Network CIL: Consecutive Iterations Limit before abandoning the unimproved solution COD: Chemical Oxygen Demand CRI: Computer Resource Centre of Lille1 University EA: Evolutionary Algorithms FFS: Flooding Forecast System FNU: Formazin Nephelometric Unit GA: Genetic Algorithm GIS: Geographical Information System GPS: Global Positioning System IETD: Inter-Event Time Definition MEL: Métropole Européenne de Lille MLP: Multi-Layer Preceptor MNI: Maximum Number of Iterations MSE: Mean Squared Errors NARX: Nonlinear Autoregressive Network with Exogenous Inputs NI: Number of Individuals NS: Number of Solutions NSE: Nash–Sutcliffe Efficiency ORP: Oxidation-Reduction Potential PS: Pattern Search PSB: Parameters Space Boundaries RNN: Recurrent Neural Network RTC: Real Time Control RTM: Real Time Monitoring SunRise: Smart Urban Networks for Resilient Infrastructures and Sustainable Ecosystems SWMM: EPA’s Stormwater Management Model TSS: Total Suspended Solids UDS: Urban Drainage Systems VSS: Valve State Schedule YRP: Year Return Period. XVIII © 2016 Tous droits réservés.. lilliad.univ-lille.fr.
(19) Thèse de Yves Abou Rjeily, Lille 1, 2016. General Introduction. © 2016 Tous droits réservés.. lilliad.univ-lille.fr.
(20) General Introduction. Thèse de Yves Abou Rjeily, Lille 1, 2016. The urban population was increasing continuously until reaching presently 50% of the world population. It is expected that this percentage will rise to 70% in 2050. The demographic boom over stresses the infrastructures of the cities. As a result, the utilities of urbanized cities are undergoing different types of failures during operations. In addition, cities are facing many other problems as water resources shortages and massive energy consumptions. Therefore, a new technological concept, based on real time monitoring and controlling the system operations, is recently appearing. This concept, called smart cities, is not limited to optimally operate the city components, but to integrate multi-objectives elements into an overall intelligent system. The present work concerns the Urban Drainage Systems (UDS). Urbanization led to increase impermeable surfaces, and thus induces higher runoff volumes and velocities. Age of these infrastructures is also a concern, since it limits their capacities and induces operation problems. In addition, climate changes, characterized by long dry periods followed by highly intense storms, is a major contributor to UDS malfunctions. Consequently, researches were conducted in order to improve the UDS operations and efficiency. Since replacing and enlarging the existing drainage systems is not feasible in most cases due to its high relative cost and required time, applications were more focusing on alternative techniques and Real Time Control (RTC) implementations. The integration of the UDS into the smart city concept is proposed in this thesis. A structural assessment of the different branches of the system, followed by conditions priority ranking and critical area’s localization, is the first step in this integration. Besides improving the system actual state, the construction of an updated log within a Geographical Information System (GIS), was proposed. Such GIS database assists managers in evaluating the structural state’s evolution of the system. These evaluations improve the long term proactivity of the maintenance and rehabilitation actions. In parallel with the structural improvements, this work tends to present applications for strengthening UDS hydraulic operations. UDS Hydraulic response is monitored through Real Time Monitoring system (RTM). These systems consist of quantitative and qualitative sensors, implemented inline the network, and able to measure parameters during the events. A calibrated hydrologic-hydraulic model extends the monitoring zones to cover the operations of the entire system elements. Due to UDS complexity and stochastic dynamic nature of their loadings, an effective evaluation of the system hydraulic operation, requires analysing the system response on multiple and different 20 © 2016 Tous droits réservés.. lilliad.univ-lille.fr.
(21) General Introduction. Thèse de Yves Abou Rjeily, Lille 1, 2016. events. Conducting multiple scenarios simulations is an efficient technique for deeply analysing the UDS hydraulic operation. Moreover, simulating extreme weather scenarios helps in evaluating and applying RTC, which is manipulating online the system elements in the most proper way aiming some objectives. In this study, the objectives of a smart city were defined as protecting the citizens and the environment, recharging water resources, offering esthetical places for the citizens and respecting economical aspect. This thesis includes 4 chapters. The first chapter is a literature review of the UDS and Smart City Concept. After defining the UDS shortages, alternative techniques applications, RTM characteristics and smart city principal, this chapter tends to represent the proposed concept for integrating UDS within the smart cities. The second chapter of this thesis aims to present the experimental site, the structural assessment methodology and the real time monitoring system implementation. This work is part of the SunRise project, which consists of implementing a large-scale demonstrator of smart and sustainable city on the Lille 1 University Campus. Within this project, the stormwater system architecture, equipment and inspection data were collected, verified and digitized into a GIS database. The GIS analysis and visualization potential in assessing and predicting the structural state evolution of UDS are presented in this chapter. In addition, aiming to analyse the system’s hydraulic response, the studied site was equipped by multiple quantitative and qualitative sensors. Characteristics, usefulness and installation procedures of the implemented sensors are also discussed in this chapter. UDS simulation model is an essential element in analysing the real system’s hydraulic response. Simulating an UDS operation requires a lot of parameters, which are highly interconnected and generally un-measured. A calibration process is necessary to identify these parameters, but it is a hard task to accomplish. Therefore, the third chapter is dedicated to develop an effective method for auto-calibrating a hydrologic-hydraulic model. Auto-calibration process was based on interacting EPA-SWMM with Matlab for applying Genetic Algorithm and Pattern Search optimization techniques. Once a calibrated model was constructed and verified on multiple storm events and through multi-point measurements, the objective was to enable simulations on synthetic and unmeasured storm events. Hydraulic boundary conditions are necessary in order to conduct. 21 © 2016 Tous droits réservés.. lilliad.univ-lille.fr.
(22) General Introduction. Thèse de Yves Abou Rjeily, Lille 1, 2016. such simulations. Consequently, a NARX neural network is presented and verified in this chapter, charged for forecasting the outfall water depth variation for the synthetic storm events. Final chapter is the core element of this research, where a RTC is presented. Aiming the objectives of a smart city, the constructed RTC is composed of a flooding forecast system and a dynamic management strategy. The flooding forecast system is based on a NARX neural network for predicting water depth variations in different critical areas of the system. Combined to a weather forecast, this system is able to proactively alert the managers for possible inundations. The dynamic management strategy focuses on optimally benefiting the system and the tank retention capacities, by dynamically manipulating the tank-connecting valve. The objective of this management was to reduce the total flooding volume and duration. Genetic Algorithm and modified form of the Artificial Bee Colony optimization techniques were both tested and evaluated in calculating the Valve State Schedule. Evaluation of optimization techniques was based on final results and required calculation time. Finally a qualitative dynamic management was introduced at the end of this chapter, aiming to support the dynamic management in strengthening the system operation. This work opened a lot of perspectives in this research field, which are presented at the end of the thesis.. 22 © 2016 Tous droits réservés.. lilliad.univ-lille.fr.
(23) Thèse de Yves Abou Rjeily, Lille 1, 2016. Chapter 1 Urban Drainage Systems within Smart Cities: State of the Art & Emerging Challenges. © 2016 Tous droits réservés.. lilliad.univ-lille.fr.
(24) Thèse de Yves Abou Rjeily, Lille 1, 2016 Chapter 1: Urban Drainage Systems within Smart Cities: State of the Art & Emerging Challenges. 1.1 Introduction Several studies show that by the year 2050, the world's cities will host more than 70% of the world population, while they cover only 2% of the earth surface. To deal with this problem, caused by globalization and integration process, cities are facing the difficulty of combining efficiency and sustainability in its urban development. In addition, due to increasing urbanization, cities are already facing many problems of resources shortages and massive energy consumption (space, mobility, power, water etc.) (Bello 2014). Consequently, a new concept was developed, called 'smart cities', represented by modern cities able to implement interconnected and sustainable infrastructures (water, electricity, gas, transportation, emergency services, public services, building, etc.) (Mattoni et al. 2015; Rathore et al. 2016). This concept has been developed to improve the comfort of the citizens and to be more effective in respecting the environment (Bello 2014). The present work concerns the Urban Drainage Systems (UDS) within smart cities. Urbanization has led to increase surface impermeability and therefore, increase runoff volumes, velocities and flow rates, generating pollution spills into the environment and flooding at the lowest areas (Yazdanfar & Sharma 2015; Zhou et al. 2016). In addition, climate change, characterized by long dry periods followed by severe storm events, is also a major contributor in aggravating UDS operations, resulting in floods and environmental pollutions (Jung et al. 2015; van der Pol et al. 2015). Consequently, in the last decades, researchers were focusing on how to optimize the existing capabilities of UDS, based on Real Time Control (RTC) systems taking into account inter- and intra- variability of volume and quality of runoff in a storm event (García et al. 2015; Yazdanfar & Sharma 2015). It has been noticed that a good management of a monitored UDS can ensure the operation continuity of the system and all its related structures, protect the environment, use energy efficiently, detect parasite flows, check and prioritize all problems and assure a better maintenance management (Veolia-eau 2013). As well, other studies show that Real Time Monitoring (RTM) data can be a useful tool to provide information that make the operators able to detect problems and pollution events that in conventional systems would go unnoticed (Pouet et al. 2006). Thus the efficiency and time response in taking actions, in order to protect the city considered at risk, will be improved. Moreover, received data, using these techniques, allow the implementation of pollution load reduction policies (Fleishmann 2007), and consequently decrease pollution spills, protect. 24 © 2016 Tous droits réservés.. lilliad.univ-lille.fr.
(25) Thèse de Yves Abou Rjeily, Lille 1, 2016 Chapter 1: Urban Drainage Systems within Smart Cities: State of the Art & Emerging Challenges. wastewater treatment plant and network facilities, and support a city to be smarter on all its objectives and potentials. This work proposes a step-by-step methodology to reinforce an UDS to become more intelligent and suitable for a smart city concept. Firstly, a general presentation of weaknesses and pollution sources, within these utilities, is presented in order to define the undesirable incidents and determine the ultimate goals to achieve a successful transformation to a smart UDS. Moreover, smart city does not work on improving each utility to its optimum within its limited responsibilities. Therefore, the third section is a presentation of different techniques and structures used for strengthening UDS as well as reinforcing a smart city multi-objective behaviour. Since real time data offer a great potential for a city to be smarter, it is obvious that monitoring sensors will be the key elements in developing the UDS concept within smart cities project. Consequently, a detailed review on RTM systems is presented in section 4 of this chapter, showing the benefits of these systems as well as listing their different forms and characteristics. After a general review on UDS, alternative structures and monitoring systems, section 5 introduces the smart city concept. At first, smart city concept with all its multi objectives were defined and combined to actual UDS conditions, to finally establish headlines for the construction of these utilities in the smart city structure. A prioritization and smart rehabilitation plan of UDS is firstly proposed. Secondly, a smart historical and updated information log with its usefulness study, which contributes to a long-term strategy and system future condition assessment, is defined. Finally a smart UDS, which participates in the enlargement of the city intelligence, is proposed as a combination between green city concept and smart monitoring system, based on sensors deployment, citizens’ interaction, and effective central control station. The last section presents the different types and benefits of a management strategy. This section shows that an optimal strategy could help the city on a multi-level, as for example the economic benefits, time saving, environmental protection, recharging resources, system sustainability, design and research fields, as well as progress in multiple other fields and domains.. 25 © 2016 Tous droits réservés.. lilliad.univ-lille.fr.
(26) Thèse de Yves Abou Rjeily, Lille 1, 2016 Chapter 1: Urban Drainage Systems within Smart Cities: State of the Art & Emerging Challenges. 1.2 Failures and Pollution sources One of the degradation causes of the natural environment is UDS discharges during wet weather. Since 1970s, numerous studies have shown the importance of the pollution they cause and their harmful impact on aquatic environments (Saget et al. 1995; Gromaire et al. 2001; Brombach 2002; Diaz-Fierros T et al. 2002; Even et al. 2004). Since then, combined systems had been given more attention, and more studies focused on how managing overflows. On the other hand, some studies led to consider that separated stormwater runoff also generates significant pollution, higher than the daily flow discharged by treatment plants for many pollutants parameters, due to leaching urban surfaces (Gromaire-Mertz et al. 1998; Diaz-Fierros T et al. 2002; Kinoshita et al. 2002; Weyrauch et al. 2010). Therefore, the fact that only separating sewage from stormwater systems cannot solve the problem, and developing an ultimate strategy in order to optimally operate and manage the infrastructure networks is a must. Problems within UDS are not limited to pollution spills. Due to the urbanization process and climate change, floods are frequently appearing, generating serious economic consequences and casualties, and become one of the major challenges for cities’ managers. Examples of flooding events are presented in the literature. Due to several consecutive storm events, the city of Dubrovnik in Croatia was inundated on 3 September 2014, and thus cars and trams movements were blocked for several hours (Figure 1-1). Boulogne-SurMer in North of France in 26 August 2015, presented another example of flood occurrences due to severe storm events (Figure 1-2). Multiple other factors also led existing UDS to undergo structural failures combined to hydraulic insufficiencies. These multiple factors, had been developed in several studies, and defined as aging of the system, soil conditions surrounding the pipe, design defects, root intrusion and tectonic and seismic movements (ASCE 1994).. Figure 1-1: Inundation at Dubrovnik, (Croatia) - 03 September 2014 (Nature Alerte 2014). Figure 1-2: Inundation at Boulogne-Sur-Mer, (France) - 26 August 2015 (La Voix du Nord 2015). 26 © 2016 Tous droits réservés.. lilliad.univ-lille.fr.
(27) Thèse de Yves Abou Rjeily, Lille 1, 2016 Chapter 1: Urban Drainage Systems within Smart Cities: State of the Art & Emerging Challenges. 1.2.1 Wastewater Sources and Pollution 1.2.1.1 Surface Runoff Water entering the UDS is derived from multiple sources studied and discussed in the literature. First, the surface runoff is collected by the UDS from urban areas. From rainfall to runoff, this water will be polluted through different steps. Before reaching the ground, the first stage of pollution is by leaching the atmosphere. Water represents at this stage, a low concentration of pollutants (Grange & Deutsch 1986; Becouze-Lareure 2010). Furthermore runoff pollution comes from leaching impervious surfaces, contaminated by air pollution deposit during dry weather and pollution associated with human activities (industry, traffic...). The characteristics of runoff from different urban areas have already been the subject of several studies (Gromaire-Mertz et al. 1999; Gnecco et al. 2005; Han et al. 2006; Lamprea 2009). Types of pollution associated with human activities are classified into four categories (Gaber 1995). Firstly, there is the chronic pollution related to the condition of use of impervious surfaces (Movement of vehicles, corrosion of roof elements, pavement wear, etc.). The nature of the pollutants in this type is highly variable, and heavy metals and hydrocarbon oils can mainly pollute runoff. Secondly, the seasonal pollution, caused in principle by the maintenance of roads and infrastructures during winter, exists. The salt used for snow removal belongs to seasonal pollution type, which beyond a certain dose is toxic to aquatic organisms and plants. Thirdly, there is accidental pollution. An example of this type is discharges resulted from an accident while transporting hazardous materials, which could cause very serious consequences. The nature of this pollution is very diverse but the hydrocarbons are frequently involved (Griffond 1993). Lastly, temporary pollution related to the construction of roads, buildings and infrastructures (dust, vehicle discharges, etc.), occurs. Runoff from these platforms are primarily loaded with suspended material of mineral origin (Gaber 1993).. 1.2.1.2 Dry Weather Flow In combined UDS, water flow during dry weather is called sewage. In general, this water comes from human use and is divided in domestic and professional activities. Studies have been developed concerning the amount, temporal distribution and characteristics of domestic water (Verbanck 1990; Butler et al. 1995; Coghlan 1995; Piatyszek et al. 2002). Other studies were conducted to determine the pollutant flows of the domestic wastewater discharges (Rambaud et al. 27 © 2016 Tous droits réservés.. lilliad.univ-lille.fr.
(28) Thèse de Yves Abou Rjeily, Lille 1, 2016 Chapter 1: Urban Drainage Systems within Smart Cities: State of the Art & Emerging Challenges. 1977; Besse et al. 1989; Pujol & Lienard 1990; Butler et al. 1995; Bécares et al. 2009), and found that fecal matter is the primary source of the presented suspended solids in this type of water (Vinnerås et al. 2003). On the other hand, for industrial and commercial water, a huge variety in the volume and nature of discharges exists, according to the type of occupation (Sörme & Lagerkvist 2002). Studies on the pollution generated by this water is also presented in the literature (Gromaire-Mertz 1998).. 1.2.1.3 Road Washing There are different wash methods that use chemical products, like manual sweeping, washing with pressure spraying and mechanical aspiration. Experiments were conducted on the watershed of Marais to evaluate the characteristics of the water induced by this application (Gromaire-Mertz et al. 1999). Comparing the concentration of suspended solids generated by this water and that brought by runoff, during rainfall, shows that median masses and median concentrations are generally comparable.. 1.2.1.4 Infiltration In addition, there is water infiltration that may increase the flow through the pipes. This water generally unpolluted, exist in the system due to defects in design, construction or operation of the networks (Davies et al. 2001). Infiltration influence is not negligible and may cause significant increases in water volumes (Bareš et al. 2012), and can also change the quality of effluent and causes a decrease in the effectiveness of treatment works (Wei et al. 2002). Infiltrated water into the network, and even water that reappear on the surface through springs and water sources that flows to enter the UDS, can be rich in nutrient elements as azote, especially for networks placed near agricultural areas, and can cause eutrophication phenomenon in the environment where overflows are discharged (Bobbink et al. 1992).. 1.2.2 Pollution Types and Characteristics 1.2.2.1 Different Pollutants in UDS No matter what the urbanization and the UDS types are, various studies show that most of the pollution of urban wet weather discharges is fixed to suspended solids materiel (Chebbo et al. 1995; Ashley et al. 2005; Zgheib et al. 2011) as shown in Table 1-1, taken from the technical guide 28 © 2016 Tous droits réservés.. lilliad.univ-lille.fr.
(29) Thèse de Yves Abou Rjeily, Lille 1, 2016 Chapter 1: Urban Drainage Systems within Smart Cities: State of the Art & Emerging Challenges. of stormwater retention basins (STU 1994). In some cases, runoff overflows into the natural environment without any treatment. Pollutants in particulate form can then settle and participate in the degradation of sediment quality (Seidl et al. 1998; Servais et al. 1999). Table 1-1: Proportion of Particulate Pollution Over Total Pollution Pollutants. COD. Hydrocarbons. BOD5. Metals. (%). 83-95. 82-99. 83-92. 79-99. In UDS, the main pollutants of runoff water are: . Nutrients as phosphor and azote, which cause eutrophication and alter the whole environmental system balance Sediments or suspended matter that once deposited can have harmful effects on aquatic life in rivers, streams and lakes. Organic materials, which can cause a lack of oxygen during their decomposition. Pathogens measured in terms of fecal coliform concentration, sometimes exceed public health standards. Hydrocarbons resulted from vehicle operation. They are toxic even at low concentration to aquatic organisms. Metals generally found in runoff, which can be toxic even at low concentrations. Pesticides may be detected at concentrations that exceed the toxicity threshold to aquatic organisms. Chlorides involved in acid rain or salts used for snow removal applications. Trash and debris trained by sanitation flow.. 1.2.2.2 Dry Time Deposit and Re-suspension Researches on the Parisian sewer system have led to consider the three following components of solid deposits in pipe systems (Ahyerre 1999; Oms 2003): . . The coarse deposit with highly mineral nature. The organic layer easily mobilized and located at the surface of mineral coarse deposits. This layer is identified as the main source of pollutants in rainfall event and appears in areas where the slope of pipes is shallow (j <0.05) and the flow velocity is low (U <0.1 m/s). During dry weather, this layer tends to a stable height and fills the hollow of coarse deposit. The biofilms are consisted of micro-organisms, extracellular polymers and organic and inorganic substances. Polymers represent 90% of the organic content of this layer (Ahyerre 1999; Houhou 2009). 29. © 2016 Tous droits réservés.. lilliad.univ-lille.fr.
(30) Thèse de Yves Abou Rjeily, Lille 1, 2016 Chapter 1: Urban Drainage Systems within Smart Cities: State of the Art & Emerging Challenges. Figure 1-3: Different layers of solid deposits in networks. In the sedimentary layer, thick sludge accumulated in the bottom of pipes, as presented in Figure 1-3, results in an oxygen deprived areas allowing anaerobic sulphate-reducing bacteria to grow (US EPA 1974) excreting hydrogen sulphide H2S (US EPA 1985) which is gasified later in the network. This gas considered as deadly gas may impact the pipe structure by reacting directly with the materials or by being transformed into sulphuric acid, which cause dissolution of the materials, and generates a toxic runoff.. 1.3 Alternative Structure Since the mid-1980s, municipal authorities and government policy makers have had a real awareness on sustainable management of rainwater in the natural environment. Thus, many cities in the world have worked to develop new practices for integrating stormwater management into urban planning and future development of their territories: Minneapolis (MSM 2006); Vancouver (Ngan 2005); Toronto (MOE 2003); Calgary (Jaska 2000); Paris (Certu 2003); London (Bettess 1996).. 30 © 2016 Tous droits réservés.. lilliad.univ-lille.fr.
(31) Thèse de Yves Abou Rjeily, Lille 1, 2016 Chapter 1: Urban Drainage Systems within Smart Cities: State of the Art & Emerging Challenges. 1.3.1 Principles of Alternative Techniques Alternative techniques present an effective solution for stormwater management in urban areas (Liao et al. 2013). They are based on two principles: Temporary storage of water, which is used to regulate the flow in the downstream network, and the Infiltration of water, which reduces or eliminates the volumes flowing downstream in the network. Studies have shown that these techniques could also be good for water treatment objectives (Jia et al. 2014; Baek et al. 2015). Indeed, their use allows some degree of governing stormwater quality by treating runoff, either by decantation or filtration processes. In addition, adding to storage structures certain means of treatment or implementing some plants to enhance area landscaping, could have a great decontaminating capacity. In the literature, lots of discussions on optimal alternative practices and the criteria to be considered in choosing the specific type had been established (De Paola et al. 2015; Liu et al. 2016; Monteiro et al. 2016). In the following paragraphs, a brief description for most of these structures’ types will be presented.. 1.3.2 Types of Alternative Techniques In the following paragraphs, a general review of the literature on optimal alternative practices has been established, and the criteria to be considered in choosing an alternative structure to a particular site practices have been discussed. Storage or vegetated roofs, shown in Figure 1-4, are used to slow runoff and reduce the effect of ground waterproofing. The stored water is either directly used in residential applications, through storage barrels (Infraguide 2005), or directed in a regulated flow to the network. In case of a vegetated roof represented in Figure 1-5, in addition to the retention benefit, buildings thermal insulation, evapotranspiration for the runoff and water purification exist. Application of these alternatives requires a well-designed roof taking into account the load of these materials. Maintenance of these structures is difficult and it requires at least two visits per year.. 31 © 2016 Tous droits réservés.. lilliad.univ-lille.fr.
(32) Thèse de Yves Abou Rjeily, Lille 1, 2016 Chapter 1: Urban Drainage Systems within Smart Cities: State of the Art & Emerging Challenges. Figure 1-4: Storage roof (Ward 2014). Figure 1-5: Vegetated roof (Fuamba et al. 2010). Drainage trenches are linear surface structures, located downstream of the impervious area, collects runoff perpendicular to their length through a gully system or by infiltration using a draining surface layer, as shown in Figure 1-6 (Certu 2008). Water evacuation will be either through infiltration or returned as a regulated flow into a stream or a network.. Figure 1-6: Drainage Trench (RiverSides ; Sustainable Stormwater Management 2007). Porous pavements, where concrete layer and asphalt mixture are porous, are shown in Figure 1-7. In these techniques the stored water is evacuated either by infiltration if the ground permeability allows and accidental pollution is not possible, and hence the runoff volume will be reduced, or routed to an UDS and therefore peak flow will be dispersed (Azzout et al. 1994). This kind of alternative technique is sensitive to freezing and thawing phenomenon, and requires regular maintenance, by simple aspiration, in order to minimize clogging problems.. 32 © 2016 Tous droits réservés.. lilliad.univ-lille.fr.
(33) Thèse de Yves Abou Rjeily, Lille 1, 2016 Chapter 1: Urban Drainage Systems within Smart Cities: State of the Art & Emerging Challenges. Figure 1-7: Porous pavement (Jen McDonnell 2014) & (Kris 2008). Retention ponds and infiltration basins, shown in Figure 1-8 and Figure 1-9, are storage or infiltration structures, which essentially control the quantitative aspects of stormwater, and sometimes can provide sedimentation whether a water pollution control is required. For this type of structures, the concrete underground tanks and the excavated outside open basin, where evaporation process exist, are distinguished. Studies have examined the effectiveness of these basins by purifying the water using decantation phenomenon (Thirionet & Grégeois 2000).. Figure 1-8: Retention or detention pond (Strand Associates 2011). Figure 1-9: Infiltration basin (Vermont). Swales and ditches shown in Figure 1-10 and Figure 1-11, are structures designed to collect water by pipes or runoff from adjacent surfaces, and evacuate it by outfall structure or by infiltration. In case of a steep longitudinal slope, dams can be implemented to increase the storage volume, reduce runoff speed, increase infiltration and activate the settling phenomenon. These structures require regular preventive maintenance and may not be applicable in areas with sensitive soils to erosion.. 33 © 2016 Tous droits réservés.. lilliad.univ-lille.fr.
(34) Thèse de Yves Abou Rjeily, Lille 1, 2016 Chapter 1: Urban Drainage Systems within Smart Cities: State of the Art & Emerging Challenges. Designing these structures by dividing their total length allows managing incidents of accidental pollution by isolating the polluted section and pumping the stored water.. Figure 1-10: Vegetated swale (Copeland et al. 2012). Figure 1-11: Ditch (The Carrs Wetland Project). Infiltration wells, shown in Figure 1-12, are point structures with varying depths depending on inflow and geology of the site. This system has the advantage of being used in existing constructed areas where space is limited. This technique may be associated with a pumping system for removing water in case of damage or detection of polluted water. Maintenance is required at least twice a year.. Figure 1-12: Infiltration well (US EPA 2013) & (GUIDEnR HQE). Perforated pipes, shown in Figure 1-13, may be considered when soils have sufficient permeability and groundwater table level and rock are at a depth greater than 1 meter at any point in the system (WSDE 2005). This method is not suitable for industrial or commercial sites where the release of significant amounts of pollutants is possible.. 34 © 2016 Tous droits réservés.. lilliad.univ-lille.fr.
(35) Thèse de Yves Abou Rjeily, Lille 1, 2016 Chapter 1: Urban Drainage Systems within Smart Cities: State of the Art & Emerging Challenges. Figure 1-13: Drainage system using perforated pipes to increase soil infiltration (Jun 2010). 1.3.3 Pre-treatment for Alternative Structures The design of alternative structures must absolutely support maintenance activities to ensure their best performance. The quality of water directed to these structures should be verified, before any contact with the environment, either by infiltration or spillage. For this purpose, sometimes, when water is directed to the alternative structure through a network, a pre-treatment is suggested to ensure the lifespan of these structures, their storage capabilities, their treatment potentials and the protection of the environment. Several types of pre-treatment are possible: vegetated filter strip, sediment trap, vortex separator, commercial filtration systems, oil and sediment separator, neutralization tank etc. (Bettess 1996). Two of these types are presented in Figure 1-14 and Figure 1-15.. Figure 1-14: Oil and sediment separator (Schueler 1987). Figure 1-15: Neutralization tank (Michael Frankel 2012). 35 © 2016 Tous droits réservés.. lilliad.univ-lille.fr.
Figure


+7


Documents relatifs
An Artificial Neural Network (ANN) simulation model is used to study the effect of operational condition on the efficiency of a solvent extraction process.. The
Beaucoup de jeunes professionnels de santé sont séduits par ces méthodes, qui de plus diluent les responsabilités quand elles ne sont pas sources de profits indécents » (2, p. Mais
L’archive ouverte pluridisciplinaire HAL, est destinée au dépôt et à la diffusion de documents scientifiques de niveau recherche, publiés ou non, émanant des
Figure 5.10 – Taille moyenne de la table de routage (pour HGA) ou de voisinage (pour greedy et Vcap) pour les différents algorithmes de routage avec 1% des nœuds ayant leur
Altogether, our study indicates that AEPA has antihypertensive properties, and prevents endothelial dysfunction and cardiac hypertrophy in DOCA-salt hypertensive rats, in part,
A step further, under a spiked covariance model (see Section 4.1), (Ma et al., 2013) proposed a very efficient iterative thresholding approach for estimating principal subspaces in
This method aimed to: (1) foresee the degradation rates of components when taking into account their in-service use; (2) improve their maintenance, and; (3) optimise their global
In particular, we define and completely solve a convexified version of this problem, underline a generic non existence result with respect to the values of the measure constraint L,
