ScienceDirect
Available online at www.sciencedirect.com
Procedia Computer Science 176 (2020) 2404–2413
1877-0509 © 2020 The Authors. Published by Elsevier B.V.
This is an open access article under the CC BY-NC-ND license (https://creativecommons.org/licenses/by-nc-nd/4.0) Peer-review under responsibility of the scientific committee of the KES International.
10.1016/j.procs.2020.09.311
10.1016/j.procs.2020.09.311 1877-0509
© 2020 The Authors. Published by Elsevier B.V.
This is an open access article under the CC BY-NC-ND license (https://creativecommons.org/licenses/by-nc-nd/4.0) Peer-review under responsibility of the scientific committee of the KES International.
Available online at www.sciencedirect.com
Procedia Computer Science 00 (2020) 000–000
www.elsevier.com/locate/procedia
24th International Conference on Knowledge-Based and Intelligent Information &
Engineering Systems
Spectrum Sensing for Smart Embedded Devices in
Cognitive Networks using Machine Learning Algorithms
M. Saber
a, A. El Rharras
a, R. Saadane
a,∗, A. Chehri
b, N. Hakem
c, H. A.
Kharraz
daSIRC/LAGeS-EHTP, Hassania School of Public Works, Morocco bUniversity of Quebec in Chicoutimi, Qu´ebec, G7H 2B, Canada. cUniversit´e du Qu´ebec en Abitibi-T´emiscamingue, Val d’Or, QC, J9P 1Y3, Canada.
dLaboratory Information Modeling and Communication Systems Ibn Toufail University Kenitra, Morocco.
Abstract
Spectrum sensing is an essential step in cognitive radio-based dynamic spectrum management. Spectrum sens-ing to detect the presence of the licensed signals in a particular frequency band is one of the most important research topics in cognitive radio. To identify primary user (PU) presence, we propose a low cost and low power consumption implementation of spectrum sensing operation based on real signals. These signals are generated by smart embedded devices at 433 MHz wireless transmitter using ASK (Amplitude-Shift Keying) and FSK (Frequency-Shift Keying) modulation type. The reception interface is constructed using an RTL-SDR dongle connected to MATLAB software. The signal detection is done by using four techniques: the artificial neural network (ANN), support vector machine (SVM), Decision Trees (TREE), and k−nearest neighbors (KNN). This article comparatively analyzed the performance of the classifiers to identify the best method for spectrum sensing between the three techniques. The performance evaluation of our proposed model is the probability of detection (Pd) and the false alarm probability (Pf a). Results show also that the sensing is susceptible to signal to noise ratio
value. This comparative study has been demonstrated that the spectrum sensing operation by ANN and SVM can be more accurate than KNN, TREE, and some other classical detectors.
© 2020 The Author(s). Published by Elsevier B.V.
This is an open access article under the CC BY-NC-ND license ( https://creativecommons.org/licenses/by-nc-nd/4.0/)
Peer-review under responsibility of KES International.
Keywords: Cognitive Radio; Spectrum Sensing; Artificial Neural Network; Support Vector Machine; Decision Trees, k−Nearest Neighbors; RTL-SDR; ASK; FSK
∗ SIRC/LAGeS-EHTP, Hassania School of Public Works, Morocco, email: [email protected]. E-mail address: [email protected]
1877-0509 © 2020 The Author(s). Published by Elsevier B.V.
This is an open access article under the CC BY-NC-ND license (https://creativecommons.org/licenses/by-nc-nd/4.0/) Peer-review under responsibility of KES International.
Available online at www.sciencedirect.com
Procedia Computer Science 00 (2020) 000–000
www.elsevier.com/locate/procedia
24th International Conference on Knowledge-Based and Intelligent Information &
Engineering Systems
Spectrum Sensing for Smart Embedded Devices in
Cognitive Networks using Machine Learning Algorithms
M. Saber
a, A. El Rharras
a, R. Saadane
a,∗, A. Chehri
b, N. Hakem
c, H. A.
Kharraz
daSIRC/LAGeS-EHTP, Hassania School of Public Works, Morocco bUniversity of Quebec in Chicoutimi, Qu´ebec, G7H 2B, Canada. cUniversit´e du Qu´ebec en Abitibi-T´emiscamingue, Val d’Or, QC, J9P 1Y3, Canada.
dLaboratory Information Modeling and Communication Systems Ibn Toufail University Kenitra, Morocco.
Abstract
Spectrum sensing is an essential step in cognitive radio-based dynamic spectrum management. Spectrum sens-ing to detect the presence of the licensed signals in a particular frequency band is one of the most important research topics in cognitive radio. To identify primary user (PU) presence, we propose a low cost and low power consumption implementation of spectrum sensing operation based on real signals. These signals are generated by smart embedded devices at 433 MHz wireless transmitter using ASK (Amplitude-Shift Keying) and FSK (Frequency-Shift Keying) modulation type. The reception interface is constructed using an RTL-SDR dongle connected to MATLAB software. The signal detection is done by using four techniques: the artificial neural network (ANN), support vector machine (SVM), Decision Trees (TREE), and k−nearest neighbors (KNN). This article comparatively analyzed the performance of the classifiers to identify the best method for spectrum sensing between the three techniques. The performance evaluation of our proposed model is the probability of detection (Pd) and the false alarm probability (Pf a). Results show also that the sensing is susceptible to signal to noise ratio
value. This comparative study has been demonstrated that the spectrum sensing operation by ANN and SVM can be more accurate than KNN, TREE, and some other classical detectors.
© 2020 The Author(s). Published by Elsevier B.V.
This is an open access article under the CC BY-NC-ND license ( https://creativecommons.org/licenses/by-nc-nd/4.0/)
Peer-review under responsibility of KES International.
Keywords: Cognitive Radio; Spectrum Sensing; Artificial Neural Network; Support Vector Machine; Decision Trees, k−Nearest Neighbors; RTL-SDR; ASK; FSK
∗ SIRC/LAGeS-EHTP, Hassania School of Public Works, Morocco, email: [email protected]. E-mail address: [email protected]
1877-0509 © 2020 The Author(s). Published by Elsevier B.V.
This is an open access article under the CC BY-NC-ND license (https://creativecommons.org/licenses/by-nc-nd/4.0/) Peer-review under responsibility of KES International.
1. Introduction
With the rapid development of wireless communication and mobile devices, heterogeneous net-works have emerged as a promising paradigm to enable users’ data services. However due to the limited resource of the natural radio spectrum that enables wireless communications, it is imperative to have smarter approaches to using the radio spectrum. The statistics of spectrum allocation around the world show that the radio spectrum has been almost fully allocated, and compared to the demands of high data-rate devices, it is evident that the currently available static frequency allocation is not enough. Studies [1], [2] have shown that the utilization of the frequency spectrum is not uniform, due to the different times and geographical position. Furthermore, the allocated spectrum bands are not used all the time by their owners, some frequencies bands are not occupied or partially occupied, and others are highly demanded. The unused frequencies are referred as white spaces or spectrum holes. A spectrum hole is a region of spatio-temporal frequencies assigned to a licensed user, also known as primary user (PU). Still, it is not being used at a particular time and in a specific location. Therefore, the radio spectrum is inefficiently exploited while a secondary utilization is possible. In this context, dynamic spectrum management has been proposed as a practical approach to overcome spectrum access and scarcity challenges.
According to the way of the possible coexistence between PUs and SUs, there are two basic DSA models: The opportunistic spectrum access (OSA) model and the concurrent spectrum access (CSA) model. And, there are three main enabling techniques for dynamic spectrum management, including the cognitive radio (CR), the blockchain and the artificial intelligence (AI) [3], [4]. In this work, we are interested in the opportunistic spectrum access model by using cognitive radio techniques. Joseph Mitola introduced the concept of CR in 1999 [5], [6]. Where it is defined as an intelligent radio frequency (transmitter/receiver) that can detect the spectrum holes and make it usable by SUs [7]. With CR, a SU can concurrently or opportunistically use the spectrum bands that are allocated/licensed to the PUs, with the condition of not causing any harmful interference to the PU communications. For more information about the Basic cognitive cycle the readers are invited to consulte the reference in [8]. Its objective is to sense the spectrum holes to obtain the band state (free/occupied), and based on this result, data transmission is adapted to optimize the performance by maximizing the throughput and minimizing the interference. Several spectrum sensing methods are discussed in literature [9] - [18].
In the last decade, classification algorithms, such as an artificial neural network (ANN), k−nearest neighbors (KNN), and support vector machine (SVM), have become hugely successful. These al-gorithms were used as discriminative approaches to PU detection due to their pattern recognition capabilities and the significant performance that can achieve [19], [22], [23]. In our context, we propose a parallel and comparative performance implementation of SVM, KNN, ANN, and decision TREE algorithm (TREE) for SS operation to detect the PU signal presence. To do so, we will use the obtained results in our previous work [24]. We will focus on different KNN and TREE training algo-rithms and SVM kernel functions that can be applied to the set of input data patterns. All these used supervised machine learning are trained and tested by the same data sets (real ASK/FSK signals).
The remainder of this paper is organized as follows. In section2, we describe the proposed system model for spectrum sensing, and we present the generation and acquisition of the used database. Section3gives a more detailed description of the utilization of some machine learning techniques for signals classification. The system model implementation, the obtained results, and discussions are provided in section4, and section5concludes the paper.
2406 M. Saber et al. / Procedia Computer Science 176 (2020) 2404–2413 2. The proposed system model
Spectrum sensing is one of the most important processes performed by CR systems. In our work, we consider an SU spectrum sensor with 1 antenna (represented by the RTL-SDR in Figure ??). There are two hypotheses: H0(the PU is inactive) and H1(the PU is active). The received signal at
the antenna is given by [25] , [26],
y(k) =
n(k) : H0
s(k) + n(k) : H1 (1)
where y(k) is the sample (the detected signal in the PU channel) to need to be measured at each instant k, n(k) is the received noise plus possible interference of variance σ2.
We consider a spectrum sensing system that operates in a dynamic spectrum access (DSA) envi-ronment and receives the signal through a single antenna (RTL-SDR dongle). The main objective of our proposed platform, as described in Figure 2 in [24], is to identify the spectrum holes to attain higher spectrum utilization.
2.1. Experimental Setup and Database Generation
With the aiming to make our work more dependable, we will generate our database using an Arduino Uno card and a 433 MHz wireless transmitter (ASK/FSK). Arduino Uno is a microcontroller board based on the ”ATmega328P”. It has 14 digital input/output pins, of which six can be used as PWM outputs, six analog inputs, a 16 MHz quartz crystal, a USB connection, a power jack, an ICSP header, and a reset button. It contains everything needed to support the microcontroller; connect it to a computer with a USB cable. ”Uno” meant ”one” in Italian and was chosen to mark the release of Arduino Software (IDE) 1.0. The Uno board and version 1.0 of Arduino Software (IDE) were the reference versions of Arduino, now evolved to newer releases. The Uno board is the first in a series of USB Arduino boards and the reference model for the Arduino platform; for an extensive list of current, past, or outdated boards, see the Arduino index of boards. Figure 6 in [24] shows the block diagram of the different processing stages of an RTL-SDR dongle.
3. Machine Learning for Spectrum Sensing
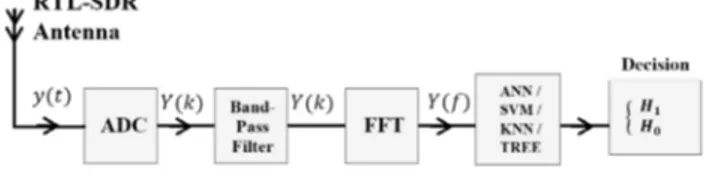
Several machine learning approaches for spectrum sensing operation exist in literature. However, only a few comparisons of different machine learning have been done for the same data sets. To classify the received signals PU or noise, we compare the performance of three classifiers: Decision Trees, k−nearest neighbors, and Support vector machine with a different kernel. The implementation steps of our proposed spectrum sensing operation are presented in Figure1. First, the received signal
y(t), by RTL SDR dongle, is digitized by an analog to digital converter (ADC) then passes through a
band-pass filter (BPF), with a center frequency f0 and bandwidth W, using the transfer function (2) to select the desired band.
H(f) = 2
√N
0 : | f − f0| ≤ W
2. The proposed system model
Spectrum sensing is one of the most important processes performed by CR systems. In our work, we consider an SU spectrum sensor with 1 antenna (represented by the RTL-SDR in Figure??). There are two hypotheses: H0 (the PU is inactive) and H1(the PU is active). The received signal at
the antenna is given by [25] , [26],
y(k) =
n(k) : H0
s(k) + n(k) : H1 (1)
where y(k) is the sample (the detected signal in the PU channel) to need to be measured at each instant k, n(k) is the received noise plus possible interference of variance σ2.
We consider a spectrum sensing system that operates in a dynamic spectrum access (DSA) envi-ronment and receives the signal through a single antenna (RTL-SDR dongle). The main objective of our proposed platform, as described in Figure 2 in [24], is to identify the spectrum holes to attain higher spectrum utilization.
2.1. Experimental Setup and Database Generation
With the aiming to make our work more dependable, we will generate our database using an Arduino Uno card and a 433 MHz wireless transmitter (ASK/FSK). Arduino Uno is a microcontroller board based on the ”ATmega328P”. It has 14 digital input/output pins, of which six can be used as PWM outputs, six analog inputs, a 16 MHz quartz crystal, a USB connection, a power jack, an ICSP header, and a reset button. It contains everything needed to support the microcontroller; connect it to a computer with a USB cable. ”Uno” meant ”one” in Italian and was chosen to mark the release of Arduino Software (IDE) 1.0. The Uno board and version 1.0 of Arduino Software (IDE) were the reference versions of Arduino, now evolved to newer releases. The Uno board is the first in a series of USB Arduino boards and the reference model for the Arduino platform; for an extensive list of current, past, or outdated boards, see the Arduino index of boards. Figure 6 in [24] shows the block diagram of the different processing stages of an RTL-SDR dongle.
3. Machine Learning for Spectrum Sensing
Several machine learning approaches for spectrum sensing operation exist in literature. However, only a few comparisons of different machine learning have been done for the same data sets. To classify the received signals PU or noise, we compare the performance of three classifiers: Decision Trees, k−nearest neighbors, and Support vector machine with a different kernel. The implementation steps of our proposed spectrum sensing operation are presented in Figure1. First, the received signal
y(t), by RTL SDR dongle, is digitized by an analog to digital converter (ADC) then passes through a
band-pass filter (BPF), with a center frequency f0 and bandwidth W, using the transfer function (2) to select the desired band.
H(f) = 2
√N
0 : | f − f0| ≤ W
0 : | f − f0| ≥ W (2)
Then the filtered signal is transformed into the frequency domain through the fast Fourier trans-form (FFT) block. Finally, we use the proposed classifiers (SVM, KNN, or TREE) to decide if a signal is present (H1) or not (H0).
Fig. 1. Block diagram of a frequency domain energy detector.
3.1. Decision Trees
The decision tree model (TREE) constructs classifiers by dividing the data set into uniform and smaller groups, based on measuring the entropy. It can be dividing the data into two groups by identi-fying a threshold and a variable in the domain, which minimizes the disparity in the resulting groups. Decision trees are widely used in medical applications. The advantage of this algorithm comparing to other algorithms is that humans can interpret decision trees as decision rules. In this study, we compare the performance of various classification trees using classification learner applications [28].
3.2. k−nearest neighbors
Machine learning is a subset of artificial intelligence that includes statistical algorithms with the ability to learn without being explicitly programmed. The k−Nearest Neighbors (KNN) is a super-vised machine learning algorithm that can be used to solve both classification and regression prob-lems.
In KNN, the training examples are used to form K neighborhood classes. A plurality vote of its neighbors classifies an object. The objective being assigned to the class most common among its k nearest neighbors. k represents the neighbor’s number of the object. The choice of the parameter k is very crucial in this algorithm; the best selection of k depends upon the data. Generally, larger values of k reduce the effect of the noise on the classification [29] but make boundaries between classes less distinct. Various heuristic techniques can select a good value of k. KNN is the simplest of machine learning algorithms, suitable for the low-complexity requirements of CR users. KNN is also the most stable machine learning algorithm [30].
3.3. Support Vector Machines
Support vector machines (SVMs) are machine learning methods, introduced in 1995s by V. Vapnik in his book ”The Nature of Statistical Learning Theory ” [31]. The SVM algorithms attempt to find a linearly separable hyperplane (an optimal hyperplane H0). The separation between the two classes is
done by maximizing the margin of the classifier, which represents the distance between two classes while minimizing the sum of errors. The aims are to separate the two classes in some representational space. The paper in [24] gives more detail about SVM. Indeed, the objective of SVM classification is to predict the value of yifor a new data point xi. There are two types in SVM classification: ”linearly”
2408 M. Saber et al. / Procedia Computer Science 176 (2020) 2404–2413
3.4. Linearly Separable Classification
In this section, we present the general method of constructing the optimal hyperplane (OH), which separates data belonging to two different linearly separable classes.
H = ω.x + b ≤ 1 i f yi=1
H = ω.x + b ≥ 1 i f yi=−1 (3)
That is equivalent to the next representation:
yi(ω.xi+b) ≥ 1 , i = 1, ..., m (4)
The optimal hyperplane (H0) is a hyperplane that maximizes the margin M, which represents the
smallest distance between the different data of the two classes and (H0). Maximizing the margin M
is equal to maximizing the sum of the distances between the two classes relative to (H0). The margin
M has the following mathematical expression: That is equivalent to the next representation:
M = min xi|yi=1 ω.x + b ||ω|| − maxxi|yi=−1 ω.x + b ||ω|| = 1 ||ω||− −1 ||ω|| (5) M = 2 ||ω|| (6)
The optimal hyper plane can be obtained by maximizing the equation (6). Which is equivalent to minimizing (7).
min
ω
||ω||
2 (7)
3.5. Non-Linearly Separable Classification
The training signals vectors may not be linearly separable. Therefore, SVM tries to map the train-ing frequency vectors into a higher dimensional feature space by a non-linear mapptrain-ing function to make the training samples linearly separable [19], [20], [21]. Hence, the slack variable ξiis
intro-duced to solve this non-linearly separable problem. This slack variable causes a little change around training data, it is lies in 0 ≤ ξ ≤ 1, wheras ξ ≥ 1 for misclassification. Then the training vectors must satisfy:
3.4. Linearly Separable Classification
In this section, we present the general method of constructing the optimal hyperplane (OH), which separates data belonging to two different linearly separable classes.
H = ω.x + b ≤ 1 i f yi=1
H = ω.x + b ≥ 1 i f yi=−1 (3)
That is equivalent to the next representation:
yi(ω.xi+b) ≥ 1 , i = 1, ..., m (4)
The optimal hyperplane (H0) is a hyperplane that maximizes the margin M, which represents the
smallest distance between the different data of the two classes and (H0). Maximizing the margin M
is equal to maximizing the sum of the distances between the two classes relative to (H0). The margin
M has the following mathematical expression: That is equivalent to the next representation:
M = min xi|yi=1 ω.x + b ||ω|| − maxxi|yi=−1 ω.x + b ||ω|| = 1 ||ω|| − −1 ||ω|| (5) M = 2 ||ω|| (6)
The optimal hyper plane can be obtained by maximizing the equation (6). Which is equivalent to minimizing (7).
min
ω
||ω||
2 (7)
3.5. Non-Linearly Separable Classification
The training signals vectors may not be linearly separable. Therefore, SVM tries to map the train-ing frequency vectors into a higher dimensional feature space by a non-linear mapptrain-ing function to make the training samples linearly separable [19], [20], [21]. Hence, the slack variable ξi is
intro-duced to solve this non-linearly separable problem. This slack variable causes a little change around training data, it is lies in 0 ≤ ξ ≤ 1, wheras ξ ≥ 1 for misclassification. Then the training vectors must satisfy: yi(ω.xi+b) ≥ 1 − ξi , i = 1, ..., m (8) D ={(ψ(x i), yi) ∈ Rn× {−1, 1} , i = 1, ..., m|p ≥ n} (9) min 12||ω||2+C n i=1 ξi (10)
In this work, the used training samples are not linearly separable. Therefore, we try to map the training set into a higher dimensional feature space by using a non-linear mapping function, called the kernel, to make the training samples linearly separable [33]. The SVM kernel choice is critical to define flexibility and classification power. Some of the commonly used kernel functions are linear, polynomial, and Gaussian radial basis function [34].
4. Implementation and Results
4.1. Description of the used Database
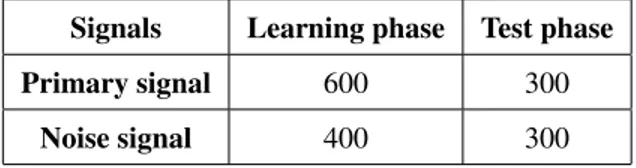
Supervised learning methods are normally composed of two main phases: training/learning, and classification. The database used in our spectrum sensing implementation was generated by the Ar-duino Uno card and the 433 MHz Wireless transmitter.
Table 1shows how we have used our database in the learning phase and test phase. Table 1. Data-Base Used In Learning And Testing Phases
Signals Learning phase Test phase
Primary signal 600 300
Noise signal 400 300
The data is generated for several distances between the sender and the receiver. Since the SUs are close to the PU (e.g., SU1 and SU2), they are probably able to detect the presence of the PU more reliably than SUs, which are located far away from the PU (e.g., SU3 in the Figure??). Moreover, SUs which are close to each other (SU1 and SU2) are likely to report the same sensing results.
4.2. Performance evaluation
As previously mentioned, H0 and H1 are the sensed states for absence and presence of signal,
respectively. Then, as presented in Figure2, we can define four possible cases for the detected signal: 1. Declaring H0 when H0 is true (H0/H0)
2. Declaring H1 when H1 is true (H1/H1)
3. Declaring H0 when H1 is true (H0/H1)
4. Declaring H1 when H0 is true (H1/H0).
Cases 1 and 2 are known as a correct detection of a PU signal and a spectrum hole, respectively. While the missed detection and the false alarm are described by the the cases 3 and case 4,
respec-2410 M. Saber et al. / Procedia Computer Science 176 (2020) 2404–2413
Fig. 2. Hypothesis test and possible outcomes with their corresponding probabilities.
tively. The performances of our proposed spectrum sensing model are characterized by the probability of detection Pdand the false alarm probability Pf a.
Pd: The probability of detecting the PU as being present when the PU is truly present (the band is
occupied H1). It is desirable to keep the detection rate as high as possible for spectrum sensing, since
low Pdvalue (Failed detection) causes interference with the PU. We calculated Pdby (13):
Pd =P(decitionH1/H1) = NN ×c 100 (11)
Pf a: the probability of detecting the PU as being present (the band is occupied H1) when the PU
is actually absent (the band is not occupied H0). It is desirable to keep the false alarm rate as low
as possible for spectrum sensing, since high Pf a value (Failed detection) reduces the efficiency of
spectrum use. We calculated Pf aby Pf a =P(decitionH1/H0) = NeN × 100 where: Ncis the number
of times in which the signal is detected, while hypothesis H1, Neis the number of times in which the
signal is detected, while hypothesis H0and N is the number of the captured signals. In this work, the
PU signal detection is performed at the SU detector, using one of the spectrum sensing techniques (ANN, SVM, KNN, or Tree) to decide between the two hypotheses H0and H1based on the received
signal samples. A SU could access the available spectrum when the PU is not present (hypothesis
H0), and no false alarm is generated by spectrum sensing.
4.3. Results
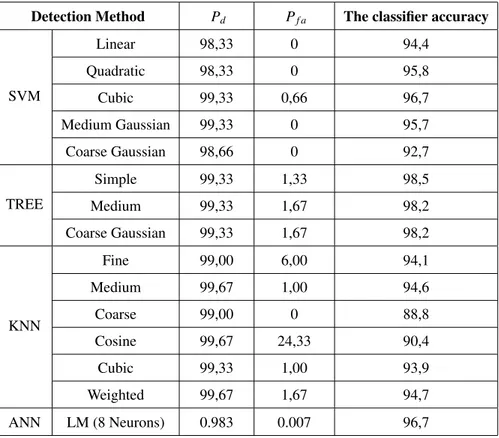
The classification is performed considering five SVM classifiers, six KNN classifiers, and three TREE classifiers from the MATLAB Statistics and Machine Learning Toolbox. We have as inputs the frequency feature vectors that contain N signals data, which is generated by the Arduino via ASK/FSK transmitters and captured by the RTL-SDR.
For a radio channel, the vector of the frequency estimated at CR devices is treated as a feature vector and fed into a classifier to decide whether the channel is available or not. The classifier cate-gorizes each feature vector into either one of the two classes, namely, the “channel available class” and the “channel unavailable class.” The obtained values of Pdand Pf aare shown in table 2.
Knowing that the sensing results do not only depend on the distance SU-PU but also the value of the signal to noise ratio (SNR). SNR is a significant parameter in communication systems, which characterizes channel quality. Spectrum sensing aim is to reach correct detection all of the time and in all geographical locations, but this can never be perfectly achieved in practice due to the noise uncertainty and the effects of multipath fading and shadowing related to the used channel [35] , [36].
Fig. 2. Hypothesis test and possible outcomes with their corresponding probabilities.
tively. The performances of our proposed spectrum sensing model are characterized by the probability of detection Pdand the false alarm probability Pf a.
Pd: The probability of detecting the PU as being present when the PU is truly present (the band is
occupied H1). It is desirable to keep the detection rate as high as possible for spectrum sensing, since
low Pdvalue (Failed detection) causes interference with the PU. We calculated Pdby (13):
Pd =P(decitionH1/H1) = NN ×c 100 (11)
Pf a: the probability of detecting the PU as being present (the band is occupied H1) when the PU
is actually absent (the band is not occupied H0). It is desirable to keep the false alarm rate as low
as possible for spectrum sensing, since high Pf avalue (Failed detection) reduces the efficiency of
spectrum use. We calculated Pf aby Pf a = P(decitionH1/H0) = NeN × 100 where: Ncis the number
of times in which the signal is detected, while hypothesis H1, Neis the number of times in which the
signal is detected, while hypothesis H0and N is the number of the captured signals. In this work, the
PU signal detection is performed at the SU detector, using one of the spectrum sensing techniques (ANN, SVM, KNN, or Tree) to decide between the two hypotheses H0and H1based on the received
signal samples. A SU could access the available spectrum when the PU is not present (hypothesis
H0), and no false alarm is generated by spectrum sensing.
4.3. Results
The classification is performed considering five SVM classifiers, six KNN classifiers, and three TREE classifiers from the MATLAB Statistics and Machine Learning Toolbox. We have as inputs the frequency feature vectors that containN signals data, which is generated by the Arduino via ASK/FSK transmitters and captured by the RTL-SDR.
For a radio channel, the vector of the frequency estimated at CR devices is treated as a feature vector and fed into a classifier to decide whether the channel is available or not. The classifier cate-gorizes each feature vector into either one of the two classes, namely, the “channel available class” and the “channel unavailable class.” The obtained values of Pdand Pf aare shown in table 2.
Knowing that the sensing results do not only depend on the distance SU-PU but also the value of the signal to noise ratio (SNR). SNR is a significant parameter in communication systems, which characterizes channel quality. Spectrum sensing aim is to reach correct detection all of the time and in all geographical locations, but this can never be perfectly achieved in practice due to the noise uncertainty and the effects of multipath fading and shadowing related to the used channel [35] , [36].
Table 2. The obtained values of Pdand Pf a
Detection Method Pd Pf a The classifier accuracy
SVM Linear 98,33 0 94,4 Quadratic 98,33 0 95,8 Cubic 99,33 0,66 96,7 Medium Gaussian 99,33 0 95,7 Coarse Gaussian 98,66 0 92,7 TREE Simple 99,33 1,33 98,5 Medium 99,33 1,67 98,2 Coarse Gaussian 99,33 1,67 98,2 KNN Fine 99,00 6,00 94,1 Medium 99,67 1,00 94,6 Coarse 99,00 0 88,8 Cosine 99,67 24,33 90,4 Cubic 99,33 1,00 93,9 Weighted 99,67 1,67 94,7 ANN LM (8 Neurons) 0.983 0.007 96,7
Missed detections, which is the case 3: P(H0/H1), are the biggest challenge for spectrum sensing,
as it means that the SU can interfere with the primary signal. In this work, we consider noise as Additive White Gaussian Noise (AWGN), since the implementation is done in our laboratory and many independent noise sources are added.
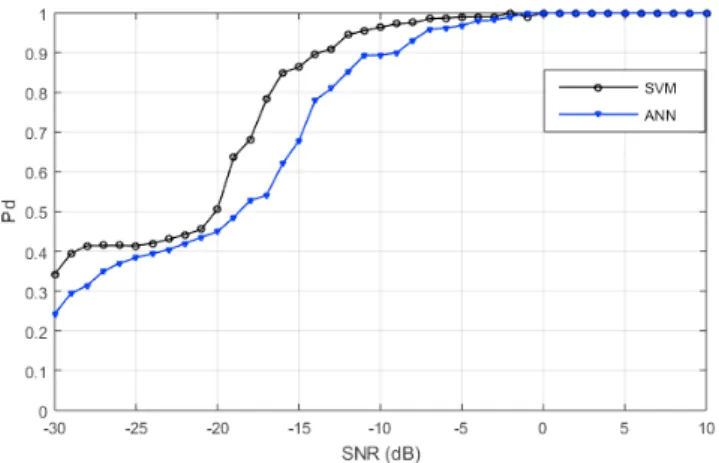
Poor detection performance in a low SNR regime means that all of the used techniques are nega-tively affected by poor channels and that the SUs cannot exploit all possible transmission opportuni-ties. In the case of variable channel gains, Eq. 1 is rewritten as:
y(k) =
w(k)h(k)s(k) + w(k) : H: H10
(12)
Where h(k) is the propagation channel coefficient at each instant k, w(k) is the additive white Gaussian noise (AWGN) with zero mean and variance σ2
w. In order to better compare the performance
of the proposed detectors, which previously gave the best results (ANN and SVM), we have evaluated the probability of detection and the probability of false alarm as a function of SNR. For this purpose, we add to the user data (Table 1) different values of SNR, then we estimate the SNR of the received signal. The SNR estimation of the received signals is determined using a modified periodogram of
2412 M. Saber et al. / Procedia Computer Science 176 (2020) 2404–2413
the same length as the input. Figure 3 illustrate the Pd changes according to the variation of the
estimated SNR, when we use ANN and SVM detectors.
Fig. 3. Performance comparaison of ANN and SVM detectors.
5. Conclusion
In summary, it is believed that an efficient spectrum utilization can be achieved by applying arti-ficial intelligence and machine learning techniques. This paper proposed a simplified spectrum sens-ing implementation based on real signals generated by an Arduino Uno card and 433 MHz Wire-less transmitter. The transmitted signal is detected in MATLAB software by RTL-SDR dongle using Four techniques: artificial neural networks (ANN), support vector machine (SVM), Decision Trees (TREE), and k−nearest neighbors (KNN). The SVM algorithm was implemented using five SVM ker-nel functions: Linear, quadratic, Cubic, Medium Gaussian, and Coarse Gaussian. The TREE classifier is implemented using three algorithms (Simple, Medium, and Complex). The obtained results show that the spectrum sensing operation will be excellent with the use of machine learning, especially, SVM and ANN algorithms.
References
[1] P. Kolodzy, I. Avoidance, ”Spectrum policy task force”, Federal Commun. Comm., Washington, DC, Rep. ET Docket 2002; 40(4): 147–158.
[2] P. Kolodzy, et al., “Next Generation Communications: Kickoff Meeting,” Proceedings of Defense Advanced Research Projects Agency, Arlington, 17 October 2001.
[3] Y. Liang Y. C. Dynamic Spectrum Management. Springer . 2020.
[4] H. Lazrag, A. Chehri, R. Saadane and M. D. Rahmani, ”A Blockchain-Based Approach for Optimal and Secure Routing in Wireless Sensor Networks and IoT,” 2019 15th International Conference on Signal-Image Technology & Internet-Based Systems (SITIS), Sorrento, Italy, 2019, pp. 411-415.
[5] Mitola. J, Maguire. G. Q. ”Cognitive radio: making software radios more personal”, IEEE personal communica-tions,1999;6(4): 13–18.
[6] J. Mitola, ”Cognitive radio for flexible mobile multimedia communications,” 1999 IEEE International Workshop on Mo-bile Multimedia Communications (MoMuC’99) (Cat. No.99EX384), San Diego, CA, USA, 1999, pp. 3-10.
[7] M. Saber, A. El Rharras, R. Saadane, A. H. Kharraz and A. Chehri, ”An Optimized Spectrum Sensing Implementa-tion Based on SVM, KNN and TREE Algorithms,” 2019 15th InternaImplementa-tional Conference on Signal-Image Technology & Internet-Based Systems (SITIS), Sorrento, Italy, 2019, pp. 383-389.
[8] Haykin. S. ”Cognitive radio: brain-empowered wireless communication”, IEEE journal on selected areas in communica-tions 2005; 23(2): 201–220.
[9] Yucek. T, Arslan. H. ”A survey of spectrum sensing algorithms for cognitive radio applications”, IEEE communications surveys and tutorials, 2009; 11(1): 116–130.
[10] D. Cabric, S. M. Mishra and R. W. Brodersen, ”Implementation issues in spectrum sensing for cognitive radios,” Confer-ence Record of the Thirty-Eighth Asilomar ConferConfer-ence on Signals, Systems and Computers, 2004., Pacific Grove, CA, USA, 2004, pp. 772-776 Vol.1.
[11] Ejaz W, Hasan N, Lee S, Kim HS. ”I3S: Intelligent spectrum sensing scheme for cognitive radio networks” EURASIP Journal on Wireless Communications and Networking 2013; 2013(1): 26.
[12] F. Digham, M. Alouini and M. K. Simon, ”On the Energy Detection of Unknown Signals Over Fading Channels,” in IEEE Transactions on Communications, vol. 55, no. 1, pp. 21-24, Jan. 2007.
[13] V. I. Kostylev, ”Energy detection of a signal with random amplitude,” 2002 IEEE International Conference on Communi-cations. Conference Proceedings. ICC 2002 (Cat. No.02CH37333), New York, NY, USA, 2002, pp. 1606-1610 vol.3. [14] Chehri, A., Fortier, P. & Tardif, P. Time delay estimation for UWB non coherent receiver in indoor environment, from
theory to practice. J Wireless Com Network 2018, 284 (2018). https://doi.org/10.1186/s13638-018-1306-z
[15] K. Kim, I. A. Akbar, K. K. Bae, J. Um, C. M. Spooner and J. H. Reed, ”Cyclostationary Approaches to Signal Detection and Classification in Cognitive Radio,” 2007 2nd IEEE International Symposium on New Frontiers in Dynamic Spectrum Access Networks, Dublin, 2007, pp. 212-215.
[16] S. Shankar N., C. Cordeiro and K. Challapali, ”Spectrum agile radios: utilization and sensing architectures,” First IEEE International Symposium on New Frontiers in Dynamic Spectrum Access Networks, 2005. DySPAN 2005., Baltimore, MD, USA, 2005, pp. 160-169.
[17] S. Atapattu, C. Tellambura and H. Jiang, ”Energy Detection Based Cooperative Spectrum Sensing in Cognitive Radio Networks,” in IEEE Transactions on Wireless Communications, vol. 10, no. 4, pp. 1232-1241, April 2011.
[18] A. Elrharras, R. Saadane, M. Wahbi and A. Hamdoun, ”Hybrid architecture for spectrum sensing algorithm based on en-ergy detection technique and artificial neural networks,” 2014 5th Workshop on Codes, Cryptography and Communication Systems (WCCCS), El Jadida, 2014, pp. 40-44.
[19] C. Cortes, V. Vapnik ”Support-vector networks. Machine learning”, 1995; 20(3): 273–297.
[20] W. Farjow, A. Chehri, M. Hussein and X. Fernando, ”Support Vector Machines for indoor sensor localization,” 2011 IEEE Wireless Communications and Networking Conference, Cancun, Quintana Roo, 2011, pp. 779-783.
[21] Chehri A., Mouftah H., Farjow W. (2012) Indoor Cooperative Positioning Based on Fingerprinting and Support Vector Ma-chines. In: S´enac P., Ott M., Seneviratne A. (eds) Mobile and Ubiquitous Systems: Computing, Networking, and Services. MobiQuitous 2010. Lecture Notes of the Institute for Computer Sciences, Social Informatics and Telecommunications Engineering, vol 73. Springer, Berlin, Heidelberg
[22] K. M. Thilina, K. W. Choi, N. Saquib and E. Hossain, ”Machine Learning Techniques for Cooperative Spectrum Sensing in Cognitive Radio Networks,” in IEEE Journal on Selected Areas in Communications, vol. 31, no. 11, pp. 2209-2221, November 2013.
[23] Duda R. O, Hart P. E, Stork D. G. ”Pattern classification”, John Wiley and Sons . 2012.
[24] M. Saber,A. ElRharras, R. Saadane, H. K. Aroussi, M. Wahbi, ”Artificial Neural Networks, Support Vector Machine and Energy Detection for Spectrum Sensing based on Real Signals”, International Journal of Communication Networks and Information Security 2019; 11(1): 52–60.
[25] H. L. Van Trees, K. L. Bell, ”Detection estimation and modulation theory”. Wiley . 2013.
[26] Poor H. V. ” An introduction to signal detection and estimation”. Springer Science and Business Media . 2013.
[27] M. Dillinger, K. Madani, N. Alonistioti, ”Software defined radio: Architectures, systems and functions”, John Wiley and Sons . 2005.
[28] S. R Safavian, D. Landgrebe D, ”A survey of decision tree classifier methodology”. IEEE transactions on systems, man, and cybernetics 1991; 21(3): 660–674.
[29] B. S. Everitt, S. Landau, M, Leese, D. Stahl, ”Miscellaneous clustering methods”, Cluster Analysis 2011: 215–255. [30] M. Y. Kiang, ”A comparative assessment of classification methods”, Decision support systems 2003; 35(4): 441–454. [31] V. Vapnik, ”The nature of statistical learning theory”, Springer science and business media, 2013.
[32] J. Shawe-Taylor, N. Cristianini, ”Kernel methods for pattern analysis”, cambridge univ. Cambridge, UK 2004. [33] D. J. Thomson, ”Spectrum estimation and harmonic analysis”, Proceedings of the IEEE 1982; 70(9): 1055–1096. [34] F. J. Harris, ”On the use of windows for harmonic analysis with the discrete Fourier transform”, Proceedings of the
IEEE1978; 66(1): 51–83.
[35] M. M. Rathore, H. Son, A. Ahmad, A. Paul, G. Jeon, ”Real-time big data stream processing using GPU with spark over hadoop ecosystem”, International Journal of Parallel Programming 46 (3), 630-646, 2018.
[36] Chehri, A, Jeon, G. ”Real-time multiuser scheduling based on end-user requirement using big data analytics”. Concurrency Computat Pract Exper. 2018;e5021. https://doi.org/10.1002/cpe.5021
the same length as the input. Figure 3illustrate the Pd changes according to the variation of the
estimated SNR, when we use ANN and SVM detectors.
Fig. 3. Performance comparaison of ANN and SVM detectors.
5. Conclusion
In summary, it is believed that an efficient spectrum utilization can be achieved by applying arti-ficial intelligence and machine learning techniques. This paper proposed a simplified spectrum sens-ing implementation based on real signals generated by an Arduino Uno card and 433 MHz Wire-less transmitter. The transmitted signal is detected in MATLAB software by RTL-SDR dongle using Four techniques: artificial neural networks (ANN), support vector machine (SVM), Decision Trees (TREE), and k−nearest neighbors (KNN). The SVM algorithm was implemented using five SVM ker-nel functions: Linear, quadratic, Cubic, Medium Gaussian, and Coarse Gaussian. The TREE classifier is implemented using three algorithms (Simple, Medium, and Complex). The obtained results show that the spectrum sensing operation will be excellent with the use of machine learning, especially, SVM and ANN algorithms.
References
[1] P. Kolodzy, I. Avoidance, ”Spectrum policy task force”, Federal Commun. Comm., Washington, DC, Rep. ET Docket 2002; 40(4): 147–158.
[2] P. Kolodzy, et al., “Next Generation Communications: Kickoff Meeting,” Proceedings of Defense Advanced Research Projects Agency, Arlington, 17 October 2001.
[3] Y. Liang Y. C. Dynamic Spectrum Management. Springer . 2020.
[4] H. Lazrag, A. Chehri, R. Saadane and M. D. Rahmani, ”A Blockchain-Based Approach for Optimal and Secure Routing in Wireless Sensor Networks and IoT,” 2019 15th International Conference on Signal-Image Technology & Internet-Based Systems (SITIS), Sorrento, Italy, 2019, pp. 411-415.
[5] Mitola. J, Maguire. G. Q. ”Cognitive radio: making software radios more personal”, IEEE personal communica-tions,1999;6(4): 13–18.
[6] J. Mitola, ”Cognitive radio for flexible mobile multimedia communications,” 1999 IEEE International Workshop on Mo-bile Multimedia Communications (MoMuC’99) (Cat. No.99EX384), San Diego, CA, USA, 1999, pp. 3-10.
[7] M. Saber, A. El Rharras, R. Saadane, A. H. Kharraz and A. Chehri, ”An Optimized Spectrum Sensing Implementa-tion Based on SVM, KNN and TREE Algorithms,” 2019 15th InternaImplementa-tional Conference on Signal-Image Technology & Internet-Based Systems (SITIS), Sorrento, Italy, 2019, pp. 383-389.
[8] Haykin. S. ”Cognitive radio: brain-empowered wireless communication”, IEEE journal on selected areas in communica-tions 2005; 23(2): 201–220.
[9] Yucek. T, Arslan. H. ”A survey of spectrum sensing algorithms for cognitive radio applications”, IEEE communications surveys and tutorials, 2009; 11(1): 116–130.
[10] D. Cabric, S. M. Mishra and R. W. Brodersen, ”Implementation issues in spectrum sensing for cognitive radios,” Confer-ence Record of the Thirty-Eighth Asilomar ConferConfer-ence on Signals, Systems and Computers, 2004., Pacific Grove, CA, USA, 2004, pp. 772-776 Vol.1.
[11] Ejaz W, Hasan N, Lee S, Kim HS. ”I3S: Intelligent spectrum sensing scheme for cognitive radio networks” EURASIP Journal on Wireless Communications and Networking 2013; 2013(1): 26.
[12] F. Digham, M. Alouini and M. K. Simon, ”On the Energy Detection of Unknown Signals Over Fading Channels,” in IEEE Transactions on Communications, vol. 55, no. 1, pp. 21-24, Jan. 2007.
[13] V. I. Kostylev, ”Energy detection of a signal with random amplitude,” 2002 IEEE International Conference on Communi-cations. Conference Proceedings. ICC 2002 (Cat. No.02CH37333), New York, NY, USA, 2002, pp. 1606-1610 vol.3. [14] Chehri, A., Fortier, P. & Tardif, P. Time delay estimation for UWB non coherent receiver in indoor environment, from
theory to practice. J Wireless Com Network 2018, 284 (2018). https://doi.org/10.1186/s13638-018-1306-z
[15] K. Kim, I. A. Akbar, K. K. Bae, J. Um, C. M. Spooner and J. H. Reed, ”Cyclostationary Approaches to Signal Detection and Classification in Cognitive Radio,” 2007 2nd IEEE International Symposium on New Frontiers in Dynamic Spectrum Access Networks, Dublin, 2007, pp. 212-215.
[16] S. Shankar N., C. Cordeiro and K. Challapali, ”Spectrum agile radios: utilization and sensing architectures,” First IEEE International Symposium on New Frontiers in Dynamic Spectrum Access Networks, 2005. DySPAN 2005., Baltimore, MD, USA, 2005, pp. 160-169.
[17] S. Atapattu, C. Tellambura and H. Jiang, ”Energy Detection Based Cooperative Spectrum Sensing in Cognitive Radio Networks,” in IEEE Transactions on Wireless Communications, vol. 10, no. 4, pp. 1232-1241, April 2011.
[18] A. Elrharras, R. Saadane, M. Wahbi and A. Hamdoun, ”Hybrid architecture for spectrum sensing algorithm based on en-ergy detection technique and artificial neural networks,” 2014 5th Workshop on Codes, Cryptography and Communication Systems (WCCCS), El Jadida, 2014, pp. 40-44.
[19] C. Cortes, V. Vapnik ”Support-vector networks. Machine learning”, 1995; 20(3): 273–297.
[20] W. Farjow, A. Chehri, M. Hussein and X. Fernando, ”Support Vector Machines for indoor sensor localization,” 2011 IEEE Wireless Communications and Networking Conference, Cancun, Quintana Roo, 2011, pp. 779-783.
[21] Chehri A., Mouftah H., Farjow W. (2012) Indoor Cooperative Positioning Based on Fingerprinting and Support Vector Ma-chines. In: S´enac P., Ott M., Seneviratne A. (eds) Mobile and Ubiquitous Systems: Computing, Networking, and Services. MobiQuitous 2010. Lecture Notes of the Institute for Computer Sciences, Social Informatics and Telecommunications Engineering, vol 73. Springer, Berlin, Heidelberg
[22] K. M. Thilina, K. W. Choi, N. Saquib and E. Hossain, ”Machine Learning Techniques for Cooperative Spectrum Sensing in Cognitive Radio Networks,” in IEEE Journal on Selected Areas in Communications, vol. 31, no. 11, pp. 2209-2221, November 2013.
[23] Duda R. O, Hart P. E, Stork D. G. ”Pattern classification”, John Wiley and Sons . 2012.
[24] M. Saber,A. ElRharras, R. Saadane, H. K. Aroussi, M. Wahbi, ”Artificial Neural Networks, Support Vector Machine and Energy Detection for Spectrum Sensing based on Real Signals”, International Journal of Communication Networks and Information Security 2019; 11(1): 52–60.
[25] H. L. Van Trees, K. L. Bell, ”Detection estimation and modulation theory”. Wiley . 2013.
[26] Poor H. V. ” An introduction to signal detection and estimation”. Springer Science and Business Media . 2013.
[27] M. Dillinger, K. Madani, N. Alonistioti, ”Software defined radio: Architectures, systems and functions”, John Wiley and Sons . 2005.
[28] S. R Safavian, D. Landgrebe D, ”A survey of decision tree classifier methodology”. IEEE transactions on systems, man, and cybernetics 1991; 21(3): 660–674.
[29] B. S. Everitt, S. Landau, M, Leese, D. Stahl, ”Miscellaneous clustering methods”, Cluster Analysis 2011: 215–255. [30] M. Y. Kiang, ”A comparative assessment of classification methods”, Decision support systems 2003; 35(4): 441–454. [31] V. Vapnik, ”The nature of statistical learning theory”, Springer science and business media, 2013.
[32] J. Shawe-Taylor, N. Cristianini, ”Kernel methods for pattern analysis”, cambridge univ. Cambridge, UK 2004. [33] D. J. Thomson, ”Spectrum estimation and harmonic analysis”, Proceedings of the IEEE 1982; 70(9): 1055–1096. [34] F. J. Harris, ”On the use of windows for harmonic analysis with the discrete Fourier transform”, Proceedings of the
IEEE1978; 66(1): 51–83.
[35] M. M. Rathore, H. Son, A. Ahmad, A. Paul, G. Jeon, ”Real-time big data stream processing using GPU with spark over hadoop ecosystem”, International Journal of Parallel Programming 46 (3), 630-646, 2018.
[36] Chehri, A, Jeon, G. ”Real-time multiuser scheduling based on end-user requirement using big data analytics”. Concurrency Computat Pract Exper. 2018;e5021. https://doi.org/10.1002/cpe.5021