Any correspondence concerning this service should be sent to the repository administrator:
To link to this article: DOI:10.17221/8847-CJASURL: https://doi.org/10.17221/8847-CJAS
This is an author-deposited version published in: http://oatao.univ-toulouse.fr/
Eprints ID: 23486
O
pen
A
rchive
T
oulouse
A
rchive
O
uverte (
OATAO
)
OATAO is an open access repository that collects the work of Toulouse
researchers and makes it freely available over the web where possible.
To cite this version: Louati, Manuel and Kohlmann, Klaus and Ben
Hassine, Oum Kalthoum and Kersten, Petra and Poulet, Nicolas
and
Bahri-Sfar, Lilia Genetic characterization of introduced Tunisian and
French populations of pike-perch (Sander lucioperca) by species-specific
microsatellites and mitochondrial haplotypes. (2016) Czech Journal of
Supported by a research scholarship provided to Manel Louati from the Tunis El Manar University.
Genetic characterization of introduced Tunisian and
French populations of pike-perch (Sander lucioperca)
by species-specific microsatellites and mitochondrial
haplotypes
M. Louati
1, K. Kohlmann
2, O.K. Ben Hassine
1, P. Kersten
2, N. Poulet
3,
L. Bahri-Sfar
11
Research Unit of Integrative Biology and Evolutionary and Functional Ecology of Aquatic
Environments, Department of Biology, Faculty of Science of Tunis, Tunis El Manar
University, El Manar, Tunisia
2
Department of Ecophysiology and Aquaculture, Leibniz-Institute of Freshwater Ecology
and Inland Fisheries, Berlin, Germany
3
French National Agency for Water and Aquatic Environment (Onema), Vincennes, France
ABSTRACT: The pike-perch is among the economically most valuable fish species for both commercial and rec-reational fishermen. This could be seen as the main reason for its introductions into Western Europe (including France) and Tunisia. Knowledge of the genetic structure of the introduced populations is a prerequisite for their successful long-term management. The present study focuses on the genetic characterization of introduced Tuni-sian and French pike-perch populations using species-specific microsatellite loci and mitochondrial cytochrome b haplotypes in order to better understand their genetic relationships and to try to trace the origin of the Tunisian populations. Lowered levels of genetic diversity have been observed in the two introduced Tunisian populations and a farmed Czech strain compared to a native wild German population. The reduction of microsatellite genetic variability of these three populations was supported by a genetic bottleneck signature. In contrast, the French populations showed high genetic diversity, probably due to multiple introductions and admixture of genetically differing sources. A high genetic differentiation level (significant FST values) between most pike-perch popula-tions and a high average accuracy of self-assignments of individuals to populapopula-tions of their origin were observed, probably resulting from genetic drift. The average pairwise relatedness values and results of the structure analysis highlighted a closer relationship between Tunisian and French populations than between Tunisian and German ones. Indeed, the two Tunisian populations clustered together with the French populations on a Neighbour-Join-ing tree based on DA genetic distances. This was also sustained by the distribution of cytochrome b haplotypes A and B in the studied populations. The present results demonstrate that, despite the genetic differences, the studied populations cluster according to their phylogeographic origin. The Tunisian populations seem to be introduced from a French hatchery where the brood stock had the haplotype B of the mitochondrial cytochrome b gene. Keywords: zander; nuclear markers; cytochrome b; stocking; North Africa; EuropeINTRODUCTION
The pike-perch (Sander lucioperca) is an Eura-sian percid fish species that is widely distributed
in watercourses. The limits of its native range extend from the Elbe River to Lake Onega in the north and from the Maritsa River to the Aral Sea in the south (Khurshut and Kohlmann 2009; Saisa
et al. 2010). Lappalainen et al. (2003) reviewed the current knowledge on the reproduction biology of pike-perch which also might influence the genetic structure of wild populations. Mature pike-perch conduct short spawning migrations (usually less than 35 km) both in fresh and brackish waters. A homing behaviour is well developed based on tagging experiments. Thus, even geographically close populations may be relatively isolated and may display significant genetic differentiation. Pike-perch are spawning in pairs and thus can be considered a monogamous species. Males are guarding and taking care of eggs what prevents them from fertilizing eggs of other females. There-fore, the effective population size and the resulting genetic variability within populations might be lower in comparison to mass-spawning fish spe-cies. Bjorklund et al. (2007) estimated an effective population size of only ca. 100 pike-perch indi-viduals in two Fennoscandian regions (North and South). Moreover, allelic richness and the degree of differentiation based on microsatellite loci was significantly higher in the North (eight popula-tions) than in the South (ten populapopula-tions) suggest-ing that there has been more gene flow between pike-perch populations in southern areas than in northern areas, where the importance of genetic drift has been greater. Similarly, Saisa et al. (2010) found marked genetic differentiation between three coastal (=indigenous) and five lake (=intro-duced or mixed) populations of pike-perch from Finland. In general, the lake populations showed a higher genetic diversity than the coastal ones. Most recently, Eschbach et al. (2014) identified three genetic lineages of pike-perch in Germany corresponding to the river basins of the Danube, Oder, and Elbe. They also observed an increased genetic diversity and admixture in invaded regions (either due to stocking or migration through ar-tificial canals) highlighting an asymmetric gene flow towards these areas. Thus, genetic drift and gene flow seem to be the most important factors determining the genetic variability and structure of wild pike-perch populations (either native or introduced).
The pike-perch is one of the main commercial species in countries where it is naturally occurring. In order to increase catches and establish new fishable populations, numerous introductions of pike-perch took place in many countries thereby expanding its geographical range. For example, it
has been introduced in Western Europe into France, Belgium, the Netherlands and Great Britain, but also into Turkey, Morocco, and into some dams in the Maghreb countries and in the Azores islands (source: www.fishbase.org).
Despite of possible economic benefits for fisher-ies, the introduction of non-native species also has many disadvantages. Such human activities can damage the native biodiversity by the pressure exerted from the introduced species. Genetically, the stocking programs were generally based on a low number of pike-perch founder individuals, involved a population bottleneck, and resulted in a large-scale loss of the original genetic diversity within the species. As a result, the newly established populations are expected to display a low level of genetic diversity and a high risk of extinction (Allendorf and Lundquist 2003).
In Tunisia, the introduction of pike-perch began on the Nebhana dam in 1968 by the Office National des Pêches (ONP; National Fishery Office) when 30 000 eggs in incubating vats were imported. Then, in 1990, 24 breeders sampled from the Nebhana dam were stocked into the Sidi Salem dam reser-voir. Since its introduction into the reservoir of Sidi Salem, pike-perch experienced a remarkable development. It represents, with 35% of the cap-tured biomass, the most appreciated freshwater fish after mullets Mugil cephalus and Liza ramada. In France, the pike-perch started invading at the end of the 19th century (Poulet et al. 2009). Since
the middle of the 20th century, pike-perch
popu-lations increased all over the country including the strongly anthropic environments. Now pike-perch represents an important fisheries resource (Poulet et al. 2009).
In most stocking programs, no information is available for characterization of the batch that was initially introduced. However, detailed knowl-edge of the genetic diversity of the exploited fish populations is a prerequisite for their successful long-term management. Thus, the present study was aimed to characterize the genetic diversity of introduced pike-perch populations from Tuni-sia and France using microsatellite loci in order to better understand and estimate their genetic relationships, to trace the origin of the Tunisian populations, and to discuss the results in the light of the level of genetic diversity observed in native populations and published data available for pike-perch. For comparative reasons, populations from
some other European countries as well as published information on the distribution of mitochondrial cytochrome b haplotypes were also included.
MATERIAL AND METHODS
Sampling. Pike-perch fin clips were collected from 17 populations (2 introduced Tunisian populations, 12 introduced French populations, 1 German native wild population, and 2 farmed populations from the Netherlands and the Czech Republic) (Table 1). Genomic DNA was isolated from the fin clips us-ing the peqGOLD Tissue DNA Mini Kit (Peqlab Biotechnologie GmbH, Erlangen, Germany).
Microsatellite genotyping. The nine pike-perch specific microsatellite loci MSL-1 to MSL-9 described by Kohlmann and Kersten (2008) were PCR-ampli-fied on a Mastercycler gradient apparatus (Eppen-dorf AG, Hamburg, Germany). Primer sequences taken from the original publication can be found under GenBank accession numbers EF694018– EF694026. Each reaction mix was composed of 1.5 μl of 10× PCR buffer with (NH4)2SO4 (MBI-Fermentas, Amherst, USA), 1.2 μl of 25mM MgCl2, 1.2 μl of 1.25mM dNTPs, 0.3 μl of each primer (10 pmol/μl),
50–100 ng genomic DNA, 0.1 μl of Taq DNA-poly- merase (5 units/μl; MBI-Fermentas), and sterile water up to a final volume of 15.0 μl. For cycling, a “touch down” thermal profile was used: initial denaturation at 94°C for 3 min, 10 cycles of 40 s at 94°C, 40 s at 60–50°C (1°C decrease per cycle), 1 min at 72°C, and 25 cycles of 40 s at 94°C, 40 s at 50°C, 1 min at 72°C, and a final extension for 10 min at 72°C. All nine loci were amplified separately, but to allow multiplex fragment analyses on a CEQ 8000 Genetic Analysis System (Beckman Coulter Inc., Fullerton, USA), the forward primer of each pair was labelled with one of three WellRed fluorescence dyes (Proligo®; Sigma-Aldrich, St. Louis, USA).
Microsatellite genotypes were recorded using the CEQ 8000 Genetic Analysis System, Fragment Analy-sis module (Beckman Coulter Inc.), and examined with MICRO-CHECKER v.2.2.3 (Van Oosterhout et al. 2004) for possible genotyping errors due to non-amplified alleles (null alleles), short allele dominance (large allele dropout), and the scoring of stutter peaks. This software estimates the frequency of null alleles and, importantly, can adjust the allele and genotype frequencies of the amplified alleles, permitting their use in further population genetic analysis.
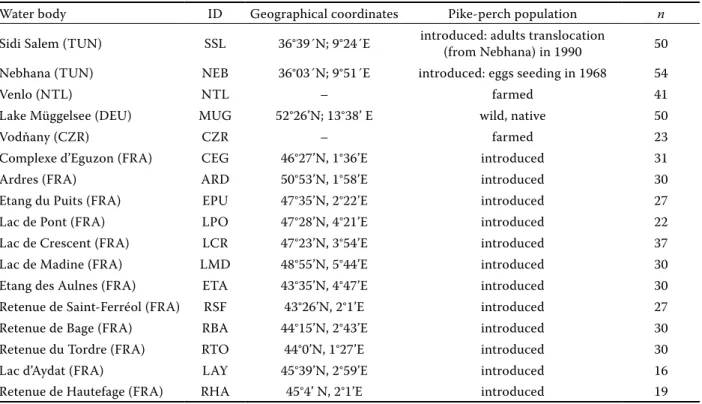
Table 1. Sampled water bodies, their geographical coordinates, and sample sizes (n) of pike-perch
Water body ID Geographical coordinates Pike-perch population n
Sidi Salem (TUN) SSL 36°39´N; 9°24´E introduced: adults translocation (from Nebhana) in 1990 50 Nebhana (TUN) NEB 36°03´N; 9°51´E introduced: eggs seeding in 1968 54
Venlo (NTL) NTL – farmed 41
Lake Müggelsee (DEU) MUG 52°26’N; 13°38’ E wild, native 50
Vodňany (CZR) CZR – farmed 23
Complexe d’Eguzon (FRA) CEG 46°27’N, 1°36’E introduced 31
Ardres (FRA) ARD 50°53’N, 1°58’E introduced 30
Etang du Puits (FRA) EPU 47°35’N, 2°22’E introduced 27
Lac de Pont (FRA) LPO 47°28’N, 4°21’E introduced 22
Lac de Crescent (FRA) LCR 47°23’N, 3°54’E introduced 37 Lac de Madine (FRA) LMD 48°55’N, 5°44’E introduced 30 Etang des Aulnes (FRA) ETA 43°35’N, 4°47’E introduced 30 Retenue de Saint-Ferréol (FRA) RSF 43°26’N, 2°1’E introduced 27 Retenue de Bage (FRA) RBA 44°15’N, 2°43’E introduced 30 Retenue du Tordre (FRA) RTO 44°0’N, 1°27’E introduced 30
Lac d’Aydat (FRA) LAY 45°39’N, 2°59’E introduced 16
Retenue de Hautefage (FRA) RHA 45°4’ N, 2°1’E introduced 19 TUN = Tunisia, NTL = the Netherlands, DEU = Germany, CZR = Czech Republic, FRA = France
Genetic data analysis
Variability of pike-perch microsatellite loci and populations. The GENETIX 4.05 software (Belkhir
et al. 1996) was used to calculate mean number of alleles per locus for each and all populations (Am), observed (Ho) and unbiased expected (He) heterozygosity for each locus and mean heterozy-gosity. Allelic richness (Ar) and richness in private alleles (Ap) following a rarefaction method were calculated for each population using two programs: ADZE (Szpiech et al. 2008) and HP-Rare (Kalinowski 2005). Statistical analyses (one-way ANOVA) using the SPSS program (Version 10, 2001) were performed to test the differences between populations in mean values of Ar and Ap, with P values < 0.05 taken as indicating statistical significance.
Recent effective population size reductions (genetic bottlenecks) were studied using allele frequency data and BOTTLENECK software (Version 1.2.02) (Cornuet and Luikart 1996). To determine whether a population exhibits a signifi-cant number of loci with heterozygosity excess, BOTTLENECK proposes three tests: Sign test, Standardized differences test (minimum 20 loci), and Wilcoxon sign-rank test. Finally, the allele frequency distribution was established in order to see whether it is approximately L-shaped (as expected under mutation-drift equilibrium) or not (recent bottlenecks provoke a mode shift). As recommended by Piry et al. (1999), the Two Phase Mutation Model (TPM) with 95% proportion of the Stepwise Mutation Model (SMM) and 5% of the Multistep mutations was used.
Wright’s inbreeding coefficient FIS was computed for each population and for each locus, provid-ing information on departure from the Hardy-Weinberg (HW) equilibrium.
Differentiation between pike-perch populations.
To measure the degree of genetic differentiation among the different populations, Wright’s FST (θ) was estimated. The F-statistics (FIS and FST) cal-culated according to Weir and Cockerham (1984) and their statistical significance of departure from zero were assessed by GENETIX 4.05 software (Belkhir et al. 1996) using 1000 permutations. All significance values resulting from multiple comparisons were corrected for type I errors by the Bonferroni correction method using an initial significance level of 0.05. Assignment analysis was performed using the GeneClass 1.0.02.
self-assignment test (Cornuet et al. 1999), with the leave-one-out procedure and Bayesian option.
The ML-Relate software (Kalinowski et al. 2006) calculates maximum likelihood estimates of re-latedness (r) and relationship. The ML estimate of r, as described by Wagner et al. (2006), may be interpreted as the proportion of genes “identical by descent” (IBD) between two individuals or groups of individuals. As for the ML relationship between a pair of individuals, it was calculated by inserting the probability that a specific genea-logical relationship shares 0, 1, or 2 alleles into the likelihood equation and determines which relationship yields the highest likelihood. Average pairwise relatedness (rxy) and relationship of all individuals to each other from samples (Nebhana – all other populations) was calculated at the nine microsatellite loci.
The Bayesian methodology of STRUCTURE (Ver-sion 2.0) (Pritchard et al. 2000) was implemented to determine the level of genetic substructure in the data set independently of sampling areas. To estimate the number of subpopulations (K), ten independent runs of K = 1–20 were carried out at 100 000 Markov chain Monte Carlo (MCMC) repetitions and performed with a burn-in period of 100 000 using no prior information and assuming admixture and independ-ent allele frequencies. The most probable number of populations was taken using the log-likelihood of K. Individuals had then been assigned to each subpopulation based on allele frequency patterns. Each pre-defined population was accepted to belong to a certain cluster if the membership probability was higher than 50%. Otherwise, that population was assigned as not belonging to any group.
The net nucleotide distance was calculated between all pairs of clusters by STRUCTURE. A phylogenetic tree based on this distance was constructed using the Neighbour-Joining (NJ) algorithm with MEGA software (Version 5.10) (Tamura et al. 2011). Bootstrapping with 100 repli-cates of estimated allele frequencies in each cluster and the construction of a consensus tree based on Reynolds distance (Reynolds et al. 1983) were carried out using the SEQBOOT and CONSENSE modules of the PHYLIP software package (Felsen-stein 1993). This consensus tree has the same to-pology as the NJ tree based on the net nucleotide distance. STRUCTURE outputs for each K were compiled with the software CLUMPP (Jakobsson and Rosenberg 2007) using the Greedy K
algo-rithm. CLUMPP aligns multiple replicate analyses of the same data set and creates an infile for the software DISTRUCT (Rosenberg 2004), which creates a graphical representation of the mean STRUCTURE outputs for a chosen K.
Genetic distances between populations were cal-culated using NEI’s DA distance (Nei et al. 1983) by GENETIX 4.05 software (Belkhir et al. 1996). A phylogenetic tree was constructed using the NJ algorithm with the NEIGHBOR and TREEVIEW modules of the PHYLIP software package (Felsen-stein 1993). The NJ tree was drawn with TreeView (Version 1.6.6) (Page 2001). Bootstrapping with 100 replicates was used to test the statistical strength of the branches and the construction of a consensus tree was carried out using the CONSENSE module of the PHYLIP software package (Felsenstein 1993). For comparative reasons already published data on one year-class (2007) of wild pike-perch from Ly-chensee, Germany (LY7) and two Uzbek pike-perch populations (Amu-Darya River delta (AMU) and Syr-Darya River (SYR); Khurshut and Kohlmann 2009) were included in the NJ tree construction.
A study of Kohlmann et al. (2013) detected two major haplotypic lineages A and B of pike-perch based on restriction enzyme analysis of the mi-tochondrial cytochrome b gene. Haplotypes A appeared to be dominant in North-East Europe while the lineage consisting of haplotypes B might be restricted to South-East Europe. The relative proportions of these haplotypes A and B were calculated for each population based on data from Kohlmann et al. (2013) and added to the NJ tree.
RESULTS
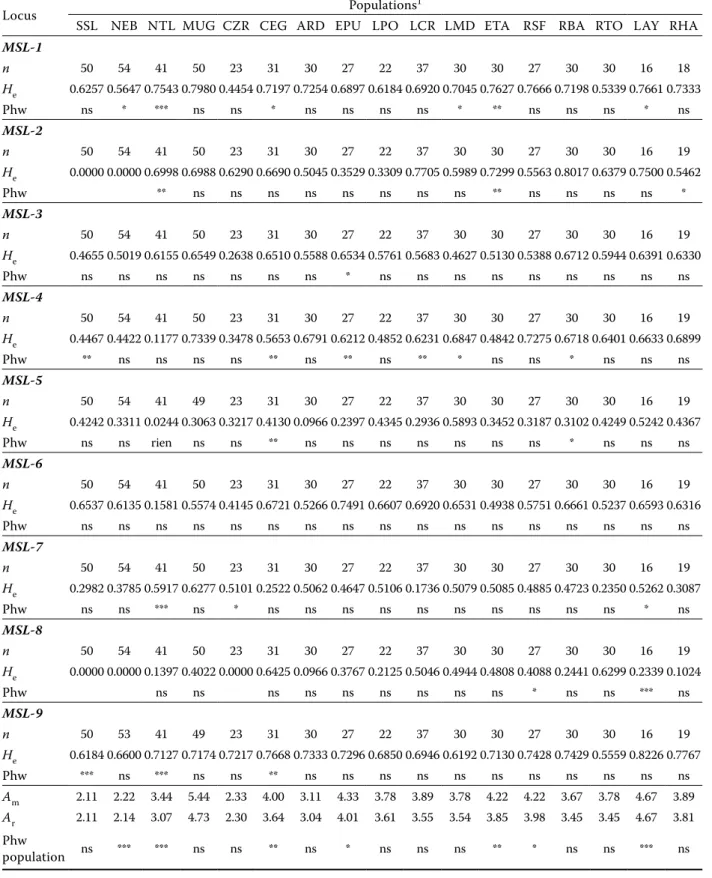
Genetic diversity of pike-perch microsatellites and populations. The nine microsatellite loci genotyped were found to be polymorphic in all populations except loci MSL-2 and MSL-8 which were monomorphic in some populations (Table 2). The total number of alleles recorded over all loci was 69. The number of alleles at single loci var-ied from 4 (locus MSL-7 and MSL-8) to 13 (locus
MSL-1), with an average of 7.66 alleles per locus.
The allelic richness (Ar) per locus, estimated after rarefaction method, ranged from 2.11 in Sidi Salem to 4.73 in the Lake Müggelsee and seems to have the same range as Am values (Table 2). The unbiased expected heterozygosity (He) varied be-tween 0.388 ± 0.244 in the Nebhana reservoir and
0.620 ± 0.177 in the Lac d’Aydat (Table 2). Statisti-cally significant differences between populations were observed in Ar and Ap values (ANOVA test,
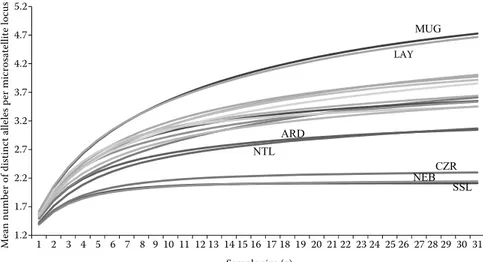
P < 0.001 for Ar and for Ap between populations), but the differences between mean He values were not significant (Kruskal-Wallis test, P > 0.05). Nevertheless, both genetic diversity estimators (Ar and He) showed higher values in the native, wild population. In fact, the most variable population was the German wild Lake Müggelsee population and the least variable were the two introduced Tunisian and the farmed Czech populations (Fig-ure 1). The reduction of genetic variability of these populations is supported by a genetic bottleneck signature detected by the Wilcoxon signed rank test (Table 3). Secondly, the farmed Netherlands population also showed a weak genetic variability compared to the other European ones.
Statistically significant deviations from Hardy-Weinberg equilibrium occurred in three populations (Nebhana, the Netherlands, and Lac d’Aydat) after Bonferroni corrections. Within these populations, only the French Lac d’Aydat population showed evidence of a heterozygote deficit at loci MSL-3 and
MSL-8 possibly due to the presence of null alleles
as indicated by the MICROCHECKER software. However, after elimination of both loci FIS remained significant, indicating a probable Wahlund effect.
Genetic differentiation between pike-perch populations. The evaluation of genetic differentia-tion between populadifferentia-tions by FST values revealed significant differences between most pairs of popu-lations even after Bonferroni corrections (Table 4).
FST values between the two Tunisian populations were low, as could be expected, because the Sidi Salem population originated from the Nebhana population, but highly significant (P < 0.001). The highest levels of differentiation were observed in comparisons with the Czech farmed population, which seemed to be genetically different from the rest of populations. Moreover, the high average accuracy of the self-assignment tests (83.55% of individuals were correctly classified according to the population of their origin) reflected a high level of genetic differentiation among populations (Table 5). Remarkable misclassifications were only observed among the two introduced Tunisian and some of the French pike-perch populations.
Average pairwise relatedness values varied from 0.0035 (over Nebhana individuals – the individu-als farmed in the Czech Republic) to 0.1570 (over
Table 2. Genetic variability of pike-perch at nine microsatellite loci
Locus Populations1
SSL NEB NTL MUG CZR CEG ARD EPU LPO LCR LMD ETA RSF RBA RTO LAY RHA
MSL-1 n 50 54 41 50 23 31 30 27 22 37 30 30 27 30 30 16 18 He 0.6257 0.5647 0.7543 0.7980 0.4454 0.7197 0.7254 0.6897 0.6184 0.6920 0.7045 0.7627 0.7666 0.7198 0.5339 0.7661 0.7333 Phw ns * *** ns ns * ns ns ns ns * ** ns ns ns * ns MSL-2 n 50 54 41 50 23 31 30 27 22 37 30 30 27 30 30 16 19 He 0.0000 0.0000 0.6998 0.6988 0.6290 0.6690 0.5045 0.3529 0.3309 0.7705 0.5989 0.7299 0.5563 0.8017 0.6379 0.7500 0.5462 Phw ** ns ns ns ns ns ns ns ns ** ns ns ns ns * MSL-3 n 50 54 41 50 23 31 30 27 22 37 30 30 27 30 30 16 19 He 0.4655 0.5019 0.6155 0.6549 0.2638 0.6510 0.5588 0.6534 0.5761 0.5683 0.4627 0.5130 0.5388 0.6712 0.5944 0.6391 0.6330 Phw ns ns ns ns ns ns ns * ns ns ns ns ns ns ns ns ns MSL-4 n 50 54 41 50 23 31 30 27 22 37 30 30 27 30 30 16 19 He 0.4467 0.4422 0.1177 0.7339 0.3478 0.5653 0.6791 0.6212 0.4852 0.6231 0.6847 0.4842 0.7275 0.6718 0.6401 0.6633 0.6899 Phw ** ns ns ns ns ** ns ** ns ** * ns ns * ns ns ns MSL-5 n 50 54 41 49 23 31 30 27 22 37 30 30 27 30 30 16 19 He 0.4242 0.3311 0.0244 0.3063 0.3217 0.4130 0.0966 0.2397 0.4345 0.2936 0.5893 0.3452 0.3187 0.3102 0.4249 0.5242 0.4367 Phw ns ns rien ns ns ** ns ns ns ns ns ns ns * ns ns ns MSL-6 n 50 54 41 50 23 31 30 27 22 37 30 30 27 30 30 16 19 He 0.6537 0.6135 0.1581 0.5574 0.4145 0.6721 0.5266 0.7491 0.6607 0.6920 0.6531 0.4938 0.5751 0.6661 0.5237 0.6593 0.6316 Phw ns ns ns ns ns ns ns ns ns ns ns ns ns ns ns ns ns MSL-7 n 50 54 41 50 23 31 30 27 22 37 30 30 27 30 30 16 19 He 0.2982 0.3785 0.5917 0.6277 0.5101 0.2522 0.5062 0.4647 0.5106 0.1736 0.5079 0.5085 0.4885 0.4723 0.2350 0.5262 0.3087 Phw ns ns *** ns * ns ns ns ns ns ns ns ns ns ns * ns MSL-8 n 50 54 41 50 23 31 30 27 22 37 30 30 27 30 30 16 19 He 0.0000 0.0000 0.1397 0.4022 0.0000 0.6425 0.0966 0.3767 0.2125 0.5046 0.4944 0.4808 0.4088 0.2441 0.6299 0.2339 0.1024 Phw ns ns ns ns ns ns ns ns ns * ns ns *** ns MSL-9 n 50 53 41 49 23 31 30 27 22 37 30 30 27 30 30 16 19 He 0.6184 0.6600 0.7127 0.7174 0.7217 0.7668 0.7333 0.7296 0.6850 0.6946 0.6192 0.7130 0.7428 0.7429 0.5559 0.8226 0.7767 Phw *** ns *** ns ns ** ns ns ns ns ns ns ns ns ns ns ns Am 2.11 2.22 3.44 5.44 2.33 4.00 3.11 4.33 3.78 3.89 3.78 4.22 4.22 3.67 3.78 4.67 3.89 Ar 2.11 2.14 3.07 4.73 2.30 3.64 3.04 4.01 3.61 3.55 3.54 3.85 3.98 3.45 3.45 4.67 3.81 Phw population ns *** *** ns ns ** ns * ns ns ns ** * ns ns *** ns
n = sample size, Am = mean number of alleles per locus, Ar = allelic richness, He = expected heterozygosity, Phw = signifi-cance level of Hardy-Weinberg probability test, ns = not significant
1three-letter codes specify the populations location – see Table 1 *P < 0.05, **P < 0.01, ***P < 0.001
Nebhana individuals – Sidi Salem individuals). The maximum percentage of relationship was observed between the two Tunisian populations, followed by pairwise Tunisian-French populations and then Tunisian-German populations (Table 6).
The admixture analysis with STRUCTURE indi-cated that a K-value of 8 clusters provided the best fit because of its consistent Ln Prob value and the small-est standard deviation (–10218.2). The STRUCTURE analysis with optimal K = 8 (Figure 2A) revealed five relatively “pure” clusters (as characterized by a single or only few colours): the two Tunisian populations together in one cluster, the Czech and French Lac de Madine together in a second cluster, and the Netherlands, German Lake Müggelsee, and French Ardres each in a distinct cluster. The remaining clusters more or less “admixed” were characterized by the presence of more colours. The NJ tree (Fig-ure 2B), based on the net nucleotide distances and drawn to better visualize the levels of differences between the STRUCTURE clusters, showed that the Tunisian cluster is closer related to the French
Ardres cluster forming with it a group supported by a medium-sized bootstrap value of 55%.
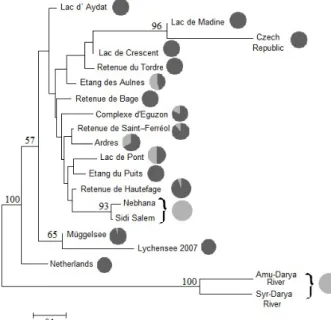
The DA genetic distances displayed a large varia-tion among pairs of populavaria-tions ranging from 0.031 (between the two Tunisian populations) to 0.884 (between Nebhana and the population farmed in the Czech Republic) (Table 4). The NJ tree based on DA genetic distances (Figure 3) supported the cluster-ing of Tunisian populations (93% bootstrap value) within the cluster of French populations including the distinct Czech Republic farmed population. The two German wild populations (Lakes Müggelsee and Lychensee from year-class 2007) formed a sister group to the French-Tunisian-Czech group supported by a bootstrap value of 65%. The Uzbek wild popula-tions were separated from all other populapopula-tions and appeared as an outgroup with a bootstrap value of 100%. This result is in agreement with the groupings inferred from the NJ tree based on the net nucleotide distances and the evident distinction of the cluster formed by the French Lac de Madine and the Czech populations (Figure 3).
Table 3. Wilcoxon test for heterozygosity excess under TPM and SMM mutation models
Populations TPM SMM
He/Hd P He/Hd P
Nebhana (TUN) 6/1 0.01563 6/1 0.03906
Sidi Salem (TUN) 7/0 0.00781 7/0 0.00781
Vodňany (CZR) 8/0 0.00391 6/2 0.03724
TPM = two-phase model of mutation, SMM = stepwise mutation model, He = number of loci showing heterozygosity excess, Hd = number of loci showing heterozygosity deficiency, P = statistical probability under the Wilcoxon test that the population exhibits overall heterozygosity excess over all loci given in the model
SSL NEB NTL MUG CZR ARD LAY 1.2 1.7 2.2 2.7 3.2 3.7 4.2 4.7 5.2 1 2 3 4 5 6 7 8 9 10 11 12 13 14 15 16 17 18 19 20 21 22 23 24 25 26 27 28 29 30 31
Mean number of distinct alleles per microsatellite locus
Sample size (g)
Figure 1. Mean number of distinct alleles per microsatellite locus as a function of standardized sample size obtained by ADZE program (Szpiech at al. 2008)
Additionally, the microsatellite based NJ tree showed only a weak association between population clusters according to these nuclear DNA mark-ers and the distribution of the two cytochrome b lineages A and B as a single mitochondrial DNA marker. In particular, the introduced French popu-lations forming a single cluster based on micro-satellites displayed variable proportions of both cytochrome b lineages: haplotype A was fixed or dominating in most populations while haplotype B was less frequent with larger proportions only in the populations from Etang des Aulnes, Ardres, and Lac de Pont (Figure 3). Interestingly, the two Tunisian populations fixed for haplotype B were closest related to the French Retenue de Hautef-age population in which haplotype A dominated.
DISCUSSION
Genetic diversity of pike-perch populations. The numerous introductions of pike-perch expand-ed its geographical range. Such transplantations
can affect the native wild populations which can be mixed or introgressed with the introduced ones. The level of genetic variability of German pike-perch as found in the wild Lake Müggelsee popula-tion is comparable to that observed by Khurshut and Kohlmann (2009) (Am = 3.11–3.78 alleles per
locusand He = 0.471) and Eschbach et al. (2014) (Am = 5.7 and He =0.62) in wild populations from Uzbekistan and Germany, respectively, using the same microsatellite loci. Based on microsatellite loci isolated from related species, other studies have examined the genetic variability and structure of wild and introduced pike-perch populations. Indeed, the comparison with native populations (three coastal and five freshwater) from Finland (Saisa et al. 2010) showed that allelic richness and
He were similar to the Lake Müggelsee popula-tion (Ar = 3.3–5.5 and He = 0.3–0.46). Likewise, Bjorklund et al. (2007) genotyped 18 pike-perch populations spread over Fennoscandia and found comparable genetic variability levels (mean Ar =
4.62 ± 0.83 in northern samples and 3.38 ± 0.62 in
Table 4. Matrix of FST values (above diagonal) and NEI’s DA distance (below diagonal) between pairs of populations1 based on a data set of microsatellite loci
SSL NEB NTL MUG CZR CEG ARD EPU LPO LCR LMD ETA RSF RBA RTO LAY RHA LY7 AMU SYR SSL 0.038 0.350 0.213 0.460 0.207 0.167 0.160 0.202 0.184 0.274 0.201 0.130 0.187 0.193 0.163 0.137 0.324 0.339 0.325 NEB 0.031 0.378 0.233 0.473 0.228 0.208 0.162 0.209 0.206 0.287 0.233 0.157 0.206 0.248 0.186 0.15 0.314 0.339 0.331 NTL 0.469 0.534 0.134 0.435 0.192 0.199 0.203 0.225 0.188 0.302 0.127 0.147 0.148 0.208 0.155 0.200 0.357 0.306 0.264 MUG 0.305 0.341 0.178 0.323 0.122 0.111 0.099 0.133 0.096 0.171 0.074 0.068 0.083 0.130 0.052 0.077 0.140 0.210 0.181 CZR 0.840 0.884 0.803 0.751 0.318 0.411 0.334 0.341 0.246 0.156 0.261 0.314 0.312 0.271 0.294 0.387 0.515 0.349 0.296 CEG 0.272 0.304 0.274 0.258 0.662 0.124 0.083 0.104 0.096 0.186 0.104 0.072 0.070 0.099 0.075 0.065 0.287 0.235 0.204 ARD 0.175 0.227 0.240 0.179 0.872 0.199 0.105 0.159 0.153 0.249 0.12 0.043 0.096 0.163 0.086 0.089 0.277 0.279 0.246 EPU 0.175 0.173 0.269 0.180 0.619 0.150 0.150 0.071 0.098 0.184 0.115 0.046 0.096 0.109 0.081 0.063 0.228 0.250 0.221 LPO 0.253 0.228 0.288 0.235 0.573 0.173 0.224 0.108 0.146 0.217 0.100 0.105 0.112 0.173 0.084 0.075 0.284 0.266 0.229 LCR 0.220 0.251 0.253 0.177 0.383 0.176 0.238 0.160 0.235 0.116 0.074 0.066 0.075 0.038 0.039 0.091 0.277 0.239 0.218 LMD 0.418 0.441 0.564 0.391 0.212 0.428 0.511 0.370 0.431 0.212 0.129 0.156 0.136 0.148 0.139 0.202 0.309 0.261 0.214 ETA 0.245 0.295 0.151 0.136 0.416 0.194 0.178 0.191 0.153 0.124 0.243 0.065 0.066 0.093 0.056 0.102 0.265 0.242 0.205 RSF 0.140 0.171 0.183 0.132 0.593 0.141 0.070 0.085 0.167 0.116 0.320 0.116 0.059 0.088 0.032 0.042 0.251 0.225 0.202 RBA 0.231 0.257 0.191 0.165 0.620 0.141 0.147 0.170 0.185 0.134 0.280 0.122 0.115 0.104 0.028 0.057 0.246 0.235 0.194 RTO 0.222 0.311 0.274 0.238 0.416 0.171 0.244 0.172 0.273 0.065 0.269 0.149 0.147 0.179 0.086 0.128 0.324 0.264 0.234 LAY 0.191 0.220 0.206 0.125 0.564 0.177 0.144 0.160 0.153 0.091 0.322 0.120 0.091 0.086 0.165 0.019 0.235 0.193 0.168 RHA 0.144 0.154 0.259 0.143 0.831 0.125 0.130 0.107 0.117 0.154 0.430 0.173 0.086 0.110 0.210 0.068 0.232 0.228 0.205 LY7 0.414 0.385 0.539 0.187 1.486 0.522 0.396 0.318 0.414 0.457 0.591 0.419 0.388 0.393 0.570 0.364 0.320 0.326 0.295 AMU 1.068 1.006 0.979 0.855 1.686 1.086 1.093 1.028 1.058 0.935 1.389 1.002 0.903 1.059 1.104 0.861 0.882 1.144 0.060 SYR 1.292 1.291 0.843 0.821 1.420 1.088 1.077 1.056 1.003 1.016 1.220 0.918 0.965 0.939 1.138 0.894 0.938 1.142 0.324
values in bold face are not significant after the Bonferroni correction; all the other values are significant 1three-letter codes specify the samples location – see Table 1
southern samples; mean gene diversities = 0.55 ± 0.11 in northern samples and 0.49 ± 0.097 in south-ern samples) as observed in the studied German wild population.
In contrast, lower levels of genetic diversity have been observed in one farmed (the Czech Republic) and two introduced populations (Tunisia) in the present study compared to the wild ones men-tioned above. The decrease of allelic diversity in domesticated stocks and the large-scale loss of the original genetic diversity within the species (loss of alleles at loci MSL-2 and MSL-8) could have been the result of the stocking program if low numbers of individuals were introduced. As a consequence, high inbreeding levels and genetic drift may occur. In fact, these three populations revealed a genetic bottleneck signature detected by the Wilcoxon signed rank test. Also, the Netherlands population showed a weaker genetic variability compared to the French ones due to the fact that it is a farmed population. In addition to the usually low number of breeders used in hatcheries, the type of con-trolled reproduction (fully artificial by hormonal stimulation and stripping of eggs and sperm or semi-artificial by providing spawning substrates in the rearing tanks or ponds) might also influence the genetic variability of farmed pike-perch stocks.
However, the effect of low numbers of spawners on the genetic bottleneck is expected to be much more important. Different authors have stressed the reduced genetic variability of farmed stocks in other fish species as well such as the Atlantic salmon (Salmo salar), where a loss of genetic vari-ability at the hatchery was detected resulting from a random drift due to a small number of founders (Verspoor 1988), the common carp (Cyprinus
car-pio), in which domestication caused a reduction of
nuclear (microsatellite) and mitochondrial DNA variability (Kohlmann et al. 2005; Kohlmann and Kersten 2013), and the sea bass (Dicentrarchus
labrax), where the sample from the gulf of Tunis
showed a low level of genetic variability probably owing to its farmed origin (Bahri-Sfar et al. 2005). In contrast, Poulet et al. (2009) characterized the genetic diversity of an introduced pike-perch population in the Rhône delta (France) and high-lighted a high genetic diversity compared to 18 native populations from the Baltic Sea drainage genotyped with the same microsatellite loci as in Bjorklund et al. (2007) (ANative = 4.2 ± 1.3, AIntro = 4.9 ± 0.9 and HNative = 0.5 ± 0.1, HIntro = 0.7 ± 0.04). This high genetic diversity observed in French populations might be explained by multiple intro-duction events (Poulet et al. 2009). Indeed, the Lac
Figure 2. Results of the structure analysis with optimal K = 8 (A), Neighbour-Joining tree based on the net nucleotide distances showing the relationships between the eight clusters (B)
three-letter codes specify the samples location – see Table 1
1.0 0.8 0.6 0.4 0.2 0 (A) (B)
d’Aydat population showed a genetic variability comparable to that in the German wild popula-tion and a relatively large distinctness (Ap = 0.67). Pike-perch is a very popular game fish in France, and a tremendous number of introductions oc-curred in French drainages increasing the number
of individuals introduced and the probability that these fish have distinct genetic origins, what finally leads to an increased gene pool of these popula-tions (Poulet et al. 2009).
Heterozygote deficit (FIS < 0) has been detected in the Lac d’Aydat population; the most evident explanation for this is the potential impact of popula-tion substructure “Wahlund effect” on populapopula-tions. However, Nebhana and the Netherlands populations showed heterozygote excess (FIS > 0). This finding might be explained by the associations of alleles that have a selective heterozygote advantage.
Genetic differentiation between pike-perch populations. The high differentiation level observed between the pike-perch populations and the high average accuracy of the self-assignment tests may be related to genetic drift. In fact, drift has been an important factor determining the genetic diversity in the Tunisian, Czech, and the Netherlands popula-tions and the long-term effective population sizes have been small with a low number of founders as indicated by the positive bottleneck signal for some of these populations. After introduction, already existing differences could have increased due to genetic drift and/or selection. It could differentiate populations from each other when gene flow was absent, ceased or became negligible. Indeed, random factors within each population contribute to their later genetic separation by genetic drift (Bjorklund
Table 6. Pairwise mean relatedness (rxy) and percentage of relationship between the Nebhana and all other studied pike-perch populations
Population r Nebhana
xy (%)
SidiSalem (TUN) 0.157 30.778
Venlo (NTL) 0.0060 0.090
Lake Müggelsee (DEU) 0.0106 1.667 Vodňany (CZR) 0.0035 0.000 Lac de Pont (FRA) 0.0341 5.135 Etang du Puits (FRA) 0.0265 3.909 Complexe d’Eguzon (FRA) 0.0198 2.927
Ardres (FRA) 0.0248 3.580
Lac de Crescent (FRA) 0.0281 4.855 Lac de Madine (FRA) 0.0186 1.235 Etang des Aulnes (FRA) 0.0128 1.543 Retenue de Saint-Ferréol (FRA) 0.0229 3.978 Retenue de Bage (FRA) 0.0179 2.099 Retenue du Tordre (FRA) 0.0179 2.593 Lac d’Aydat (FRA) 0.0246 4.398 Retenue de Hautefage (FRA) 0.0454 7.310 Table 5. Results of the pike-perch self-assignment test Original
population Number of individuals classified into population
1 Correct as
signment (%) SSL NEB NTL MUG CZR CEG ARD EPU LPO LCR LMD ETA RSF RBA RTO LAY RHA
SSL 36 14 – – – – – – – – – – – – – – – 72.0 NEB 13 41 – – – – – – – – – – – – – – – 75.9 NTL – – 39 2 – – – – – – – – – – – – – 95.1 MUG – – – 44 – – 1 – 1 – – – 2 – – – 2 88.0 CZR – – – – 23 – – – – – – – – – – – – 100.0 CEG – – – – – 26 1 – 1 – – – – 1 1 – 1 83.9 ARD – – – – – – 29 – – – – – 1 – – – – 96.7 EPU – – – – – – 1 23 1 – – – 2 – – – – 85.2 LPO – – – – – – – – 18 – – 1 1 – – – 2 81.8 LCR – – – – – – – – – 33 1 1 – 1 – – 1 89.2 LMD – – – – – – – – – 1 29 – – – – – – 96.7 ETA – – – – – – – – 2 3 – 23 – 1 1 – – 76.7 RSF – – – – – 1 3 2 1 1 1 – 18 – – – – 66.7 RBA – – – – – 1 – – – 1 – – 1 23 1 1 2 76.7 RTO – – – – – 1 – 2 – 1 – – 1 – 25 – – 83.3 LAY – – – – – 1 – – – – – – 1 1 – 10 3 62.5 RHA – – – – – – – – 1 – – 1 – – – – 17 89.5
et al. 2007). Thus, the STRUCTURE software splits those populations as divergent groups with a few fairly admixed individuals.
Some pairwise comparisons of French popula-tions highlighted non-significant FST values, what can be explained by gene flow through introduc-tions probably because anglers associaintroduc-tions were supplied from the same fish farm and by the his-tory of the introduced progenitors, taking into account the usually very small number of source populations and the limited number of breeders (at least at the beginning of introductions).
In contrast, the significant genetic differen-tiation among the other French populations may stem from repeated introductions of pike-perch from different fish farms and from differences in population dynamics due to selection effects. In the study of Saisa et al. (2010) some of the loci showed especially high divergence between populations from different environments possibly indicating relation to adaptively important genes (the samples of northernmost lake populations differed strongly from the southern lake populations).
In the present study, the genetic structure of introduced pike-perch populations in Tunisia was characterized, and we tried to trace their origin. The average pairwise relatedness values highlight
a closer relationship between Tunisian and French populations than between Tunisian and German ones. In fact, most other introduced freshwater fish species were imported in the same year from French hatcheries, e.g. common carp, roach (Rutilus
ru-bilio), and rudd (Scardinius erythrophthalmus).
This is supported by the STRUCTURE results: the two Tunisian populations cluster with the French population of Ardres, whereas the Netherlands and the German Lake Müggelsee population form a distinct cluster. The remaining admixed popula-tions testify, on the one hand, that the pike-perch breeders used in stocking programs would be genetically close and, on the other hand, that a re-stocking and transfer program within sampling localities may produce an increasing gene flow.
Tunisian populations may share the same line-age as French pike-perch which is admixed, as highlighted by the clustering observed in the NJ trees based on the net nucleotide distances and on
DA genetic distances. This is also sustained by the relative proportions of cytochrome b haplotypes A and B in the studied populations. Only haplotype B was detected in Tunisian samples. In contrast, haplotype A was the most frequent type found in all French populations and haplotype B is present there with an average proportion of only 14.36%. This discrepancy might be due to different source populations originally introduced into France, mul-tiple introductions, founder effects, genetic drift, and natural selection or combinations of any of these factors. A natural contact zone of both line-ages exists in Germany and the Czech Republic (Kohlmann et al. 2013; Eschbach et al. 2014).
CONCLUSION
In conclusion, the present results demonstrate that despite the genetic differences, the studied populations still cluster or differentiate accord-ing to their phylogeographic origin. The Tunisian populations seem to be introduced from a French hatchery where the brood stock has the haplotype B of the mitochondrial cytochrome b gene.
Acknowledgement. We express our apprecia-tion to the engineers and technicians from the French National Agency for Water and Aquatic Environment (ONEMA) for assistance in obtaining samples from France. M. Kocour kindly provided samples from the Czech Republic.
Figure 3. Neighbour-Joining tree of pike-perch populations based on 9 microsatellite loci and NEI’s DA distance. Rela-tive proportions of haplotypes A (black colour) and B (grey colour) were also calculated based on data of Kohlmann et al. (2013) and attributed to the studied populations
REFERENCES
Allendorf F.W., Lundquist L.L. (2003): Introduction: popula-tion biology, evolupopula-tion, and control of invasive species. Conservation Biology, 17, 24–30.
Bahri-Sfar L., Lemaire C., Chatain B., Divanach P., Ben Has-sine O.K., Bonhomme F. (2005): Impact of aquaculture on the genetic structure of Mediterranean populations of Dicentrarchus labrax. Aquatic Living Resources, 18, 71–76. (in French)
Belkhir K., Borsa P., Chikhi L., Raufaste N., Bonhomme F. (1996): GENETIX 4.05, WindowsTM software for popula-tion genetics. Laboratoire génome, populapopula-tions, interac-tions, CNRS UMR, 5000, 1996–2004. (in French) Bjorklund M., Aho T., Larsson L. (2007): Genetic
differen-tiation in pikeperch (Sander lucioperca): the relative im-portance of gene flow, drift and common history. Journal of Fish Biology, 71, 264–278.
Cornuet J.-M., Luikart G. (1996): Description and power analy-sis of two tests for detecting recent population bottlenecks from allele frequency data. Genetics, 144, 2001–2014. Cornuet J.-M., Piry S., Luikart G., Estoup A., Solignac M.
(1999): New methods employing multilocus genotypes to select or exclude populations as origins of individuals. Genetics, 153, 1989–2000.
Eschbach E., Nolte A.W., Kohlmann K., Kersten P., Kail J., Arlinghaus R. (2014): Population differentiation of zander (Sander lucioperca) across native and newly colonized ranges suggests increasing admixture in the course of an invasion. Evolutionary Applications, 7, 555–568. Felsenstein J. (1993): Phylogeny Inference Package (PHYLIP).
Version 3.5. University of Washington, Seattle, USA. Jakobsson M., Rosenberg N.A. (2007): CLUMPP: a cluster
matching and permutation program for dealing with label switching and multimodality in analysis of population structure. Bioinformatics, 23, 1801–1806.
Kalinowski S.T. (2005): hp-rare 1.0: a computer program for performing rarefaction on measures of allelic richness. Molecular Ecology Notes, 5, 187–189.
Kalinowski S.T., Wagner A.P., Taper M.L. (2006): ML-Relate: a computer program for maximum likelihood estimation of relatedness and relationship. Molecular Ecology Notes, 6, 576–579.
Khurshut E., Kohlmann K. (2009): Application of nine species-specific microsatellite loci to characterize three pike-perch (Sander lucioperca) populations from the Aral Sea basin in Uzbekistan. Environmental Biotechnology, 5, 3–10. Kohlmann K., Kersten P. (2008): Isolation and
characteri-zation of nine microsatellite loci from the pike-perch, Sander lucioperca (Linnaeus, 1758). Molecular Ecology Resources, 8, 1085–1087.
Kohlmann K., Kersten P. (2013): Deeper insight into the origin and spread of European common carp (Cyprinus carpio carpio) based on mitochondrial D-loop sequence polymorphisms. Aquaculture, 376–379, 97–104. Kohlmann K., Kersten P., Flajshans M. (2005):
Micros-atellite-based genetic variability and differentiation of domesticated, wild and feral common carp (Cyprinus carpio L.) populations. Aquaculture, 247, 253–266. Kohlmann K., Louati M., Kersten P., Bahri-Sfar L., Poulet
N., Ben Hassine O. (2013): Detection of two major cy-tochrome b lineages in pike-perch, Sander lucioperca, and first data on their distribution in European populations. Environmental Biotechnology, 9, 1–5.
Lappalainen J., Dorner H., Wysujack K. (2003): Reproduction biology of pikeperch (Sander lucioperca (L.)) – a review. Ecology of Freshwater Fish, 12, 95–106.
Nei M., Tajima F., Tateno Y. (1983): Accuracy of estimated phylogenetic trees from molecular data. Journal of Mo-lecular Evolution, 19, 153–170.
Page R. (2001): TreeView 1.4 Software. University of Glas-gow, GlasGlas-gow, UK.
Piry S., Luikart G., Cornuet J.-M. (1999): BOTTLENECK: A program for detecting recent effective population size reductions from allele data frequencies. Available at http://www1.montpellier.inra.fr/CBGP/software/Bottle-neck/bottleneck.html (accessed Dec 10, 2014).
Poulet N., Balaresque P., Aho T., Bjorklund M. (2009): Ge-netic structure and dynamics of a small introduced popu-lation: the pikeperch, Sander lucioperca, in the Rhône delta. Genetica, 135, 77–86.
Pritchard J.K., Stephens M., Donnelly P. (2000): Inference of population structure using multilocus genotype data. Genetics, 155, 945–959.
Reynolds J., Weir B.S., Cockerham C.C. (1983): Estima-tion of the coancestry coefficient: basis for a short-term genetic distance. Genetics, 105, 767–779.
Rosenberg N.A. (2004): DISTRUCT: a program for the graphical display of population structure. Molecular Ecology Notes, 4, 137–138.
Saisa M., Salminen M., Koljonen M.L., Ruuhijarvi J. (2010): Coastal and freshwater pikeperch (Sander lucioperca) populations differ genetically in the Baltic Sea basin. Hereditas, 147, 205–214.
Szpiech Z.A., Jakobsson M., Rosenberg N.A. (2008): ADZE: a rarefaction approach for counting alleles private to com-binations of populations. Bioinformatics, 24, 2498–2504. Tamura K., Peterson D., Peterson N., Stecher G., Nei M.,
Kumar S. (2011): MEGA5: molecular evolutionary ge-netics analysis using maximum likelihood, evolutionary distance, and maximum parsimony methods. Molecular Biology and Evolution, 28, 2731–2739.
Van Oosterhout C., Hutchinson W.F., Wills D.P., Shipley P. (2004): MICRO-CHECKER: software for identifying and correcting genotyping errors in microsatellite data. Molecular Ecology Notes, 4, 535–538.
Verspoor E. (1988): Reduced genetic variability in first-gen-eration hatchery populations of Atlantic salmon (Salmo salar). Canadian Journal of Fisheries and Aquatic Sci-ences, 45, 1686–1690.
Wagner A., Creel S., Kalinowski S. (2006): Estimating re-latedness and relationships using microsatellite loci with null alleles. Heredity, 97, 336–345.
Weir B.S., Cockerham C.C. (1984): Estimating F-statistics for the analysis of population structure. Evolution, 38, 1358–1370.
Received: 2015–09–04 Accepted after corrections: 2015–12–10
Corresponding Author
Dr. Klaus Kohlmann, Leibniz-Institute of Freshwater Ecology and Inland Fisheries,
Department of Ecophysiology and Aquaculture, Müggelseedamm 310, 12587 Berlin, Germany Phone: +493 064 181 634, e-mail: [email protected]