To link to this article : DOI:
10.1117/12.2194920
URL :
http://dx.doi.org/10.1117/12.2194920
This is an author-deposited version published in:
http://oatao.univ-toulouse.fr/
Eprints ID: 18033
O
pen
A
rchive
T
oulouse
A
rchive
O
uverte (
OATAO
)
OATAO is an open access repository that collects the work of Toulouse
researchers and makes it freely available over the web where possible.
To cite this version: Bertin, Clément and Cros, Sylvain and
Saint-Antonin, Laurent and Schmutz, Nicolas Prediction of optical
communication link availability: real-time observation of cloud patterns
using a ground-based thermal infrared camera. (2015) In: SPIE Remote
Sensing 2015, 21 September 2015 - 24 September 2015 (Toulouse,
France)
Any correspondence concerning this service should be sent to the repository administrator:
Prediction of optical communication link availability: real-time
observation of cloud patterns using a ground-based thermal infrared
camera
Clément Bertin
a, Sylvain Cros
b, Laurent Saint-Antonin
a, Nicolas Schmutz
ba
IRT Saint Exupéry, 118, route de Narbonne, 31423 Toulouse, France
b
Reuniwatt SAS, 14 rue de la Guadeloupe, 97490 St-Clotilde, Reunion Island, France
ABSTRACT
The growing demand for high-speed broadband communications with low orbital or geostationary satellites is a major challenge. Using an optical link at 1.55 μm is an advantageous solution which potentially can increase the satellite throughput by a factor 10. Nevertheless, cloud cover is an obstacle for this optical frequency. Such communication requires an innovative management system to optimize the optical link availability between a satellite and several Optical Ground Stations (OGS).
The Saint-Exupery Technological Research Institute (France) leads the project ALBS (French acronym for BroadBand Satellite Access). This initiative involving small and medium enterprises, industrial groups and research institutions specialized in aeronautics and space industries, is currently developing various solutions to increase the telecommunication satellite bandwidth.
This paper presents the development of a preliminary prediction system preventing the cloud blockage of an optical link between a satellite and a given OGS. An infrared thermal camera continuously observes (night and day) the sky vault. Cloud patterns are observed and classified several times a minute. The impact of the detected clouds on the optical beam (obstruction or not) is determined by the retrieval of the cloud optical depth at the wavelength of communication. This retrieval is based on realistic cloud-modelling on libRadtran. Then, using subsequent images, cloud speed and trajectory are estimated. Cloud blockage over an OGS can then be forecast up to 30 minutes ahead. With this information, the preparation of the new link between the satellite and another OGS under a clear sky can be prepared before the link breaks due to cloud blockage.
Keywords: optical link, optical communication, long wave infrared, cloud pattern prediction, microbolometer, cloud
microphysical properties, optical ground station
1. INTRODUCTION
The demand for high-data-rate communication is generating interest in Earth–space optical links, as an alternative or an extension to conventional radio-frequency (RF) links. Indeed, the higher frequency of optical signal compared to RF permits to tremendously increase the transmitted bit rate responding to future communication needs. Moreover, optical link offers a safer way of communication because the transmitted information can be intercepted only by a receiver located in the line of sight [1].
Concretely, the optical link is a communication transmitted by a laser with a wavelength of 1.55 µm. This wavelength has been chosen rather than other common optical telecommunications (1.06 and 0.8 µm) for several reasons. It is the same than the one used by current terrestrial fiber-optic networks, permitting a convenient interface between free space and fiber networks. It enables an ultra-dense wavelength multiplexing providing an optimized data transmission rate. Moreover, this frequency is less sensitive to the rapid fluctuations of air refractive index occurring in turbulent atmospheres. Finally, this laser wavelength is recommended to protect the eyes of astronauts and aircraft pilots (Norm EN 60825-1 0 of the European Comity of Normalization (CEN)).
Even if a 1.55 µm laser benefits from a high atmospheric transmission (about 90 %) compared to the other common wavelengths, most of the clouds break the communication link with an attenuation superior to 10 dB [2]. To supply the continuity of the communication service, it is necessary to implement site diversity thanks to an optical ground station
(OGS) network. The OGS network is optimized in order to maximize the link availability with a minimum number of stations.
Low attenuation of high semitransparent clouds (cirrus) could be incorporated into the optical link budget at the price of larger or more powerful optical terminals [3].
Satellite imagery can provide worldwide cloud coverage data but with a trade-off between spatial and temporal resolutions. Satellites in geosynchronous orbits provide continuous data, but at low spatial resolutions. Satellites in Low Earth Orbits (LEO) provide higher spatial resolutions, but only once or twice a day. Moreover, for all these methods it is difficult to detect the effects of thin clouds in the aiming line of the telescope. Then, a ground-based cloud monitoring system must be set up at the OGS site.
This paper presents our prediction system which prevents cloud blockage of the optical link. An uncooled microbolometer thermal infrared (8-13 µm band) camera continuously observes (night and day) the entire sky vault above each OGS. Processing these observations permits to deliver a cloud attenuation map every minute. Then, image processing techniques enable to forecast when the optical link will next be obstructed in order to manage a handover toward an available OGS.
The next section presents the principles of atmospheric radiative transfer and the observation of cloud properties in the thermal infrared spectrum. Section 3 shows the cloud attenuation map retrieval from the camera data. The prediction process is explained in section 4. The conclusion and perspectives are presented in the last section.
2. CLOUD OBSERVATION IN THERMAL INFRARED
The LWIR atmospheric window
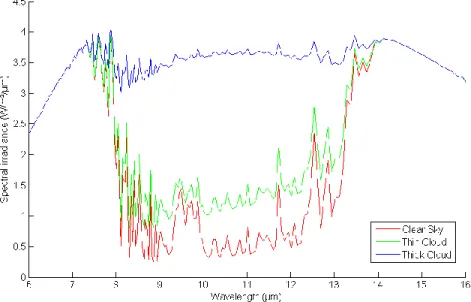
The long wave infrared (LWIR) thermal atmospheric window from 8 to 13 μm is well suited for cloud observation. Figure 1 shows the downwelling radiance emitted by three different sky states above a punctual ground location. Spectral radiances have been simulated by the radiative transfer model libRadtran [4]. The red curve clearly indicates the presence of an atmospheric window between 8 and 13 µm. Thick cloud emission (blue curve) is significantly high to present a strong contrast with a clear sky radiometric signature. However, this contrast is smaller for the detection of thin clouds (green curve) such as cirrus.
Atmospheric emission in this window is however very sensitive to water vapor presence. Thus, the determination of cloud-free atmospheric emission must be very accurate to consistently detect thin clouds with varying water vapor contents.
A thermal infrared imager has the advantage of directly detecting cloud emission rather than relying on reflected and scattered sunlight in the case of visible or near-infrared observation systems. Thus cloud detection performance does not depend on the illumination of the cloud cover by the sun. Thus, the time of the day has absolutely no influence on the thermal infrared imager’s performance, enabling continuous night and day observation.
However, observations at a low angular elevation (typically less than 20° above the horizon) encounter the issue of an increasing atmospheric thickness in the line of sight. This case leads to two distinct effects. Firstly, emission of atmospheric components (mainly water vapor and aerosols) increase with atmosphere thickness (quantified by the air mass). Secondly, a thick atmosphere is less transparent to a cloud signal. Consequently, the observed radiance ratio between clouds and a clear atmosphere decreases drastically. The detection of thin clouds and the retrieval of their physical property becomes problematic.
Instrumental observation
Several sky vault observation systems have been set-up to monitor the cloud cover in the LWIR band. A Radiometric All-Sky Infrared CaMera (RASICAM) was developed by the SLAC National Accelerator Laboratory to astronomically monitor night-time observations at the Cerro Tololo Inter-American Observatory [5]. The camera provides a real time sky quality map which guarantees sufficient sky clearness to validate the photometric acquisition. The Infrared Cloud Imager (ICI) is a camera developed by the University of Montana. Dedicated to climate studies, ICI is primarily used for day and night cloud-cover monitoring to assess cloud contribution in the atmospheric radiative budget, especially in high latitudes, where satellites have difficulties distinguishing between clouds and the underlying surface [6]. ICI is also used by NASA to assess different sites’ space-to-earth communication feasibility [7]. The All-Sky Infrared Visible Analyzer (ASIVA) is a Solrimus Corporation product that provides multiple products on clouds, as sky quality map, for observatories and weather offices [8].
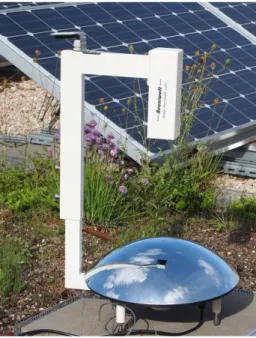
The prediction system currently developed at IRT Saint-Exupéry and presented in this paper is based on the instrument SIONS-T (French acronym for ground-based thermal infrared imager for cloud observation) developed by the company Reuniwatt (figure 2).
The instrument is composed of a LWIR camera core with a 640 by 480 spatial resolution. A hemispherical mirror provides a 180° field of view. The chromed coating of mirror surface ensures an optimal reflection of LWIR radiation. The resolution of the field of view is about 0.35° per pixel. Humidity and temperature sensors, installed in a radiation shield located near the camera, provide in-situ meteorological information improving the estimation of clear atmosphere radiance. An embedded computer is used to acquire and upload the data on a server for measurement processing.
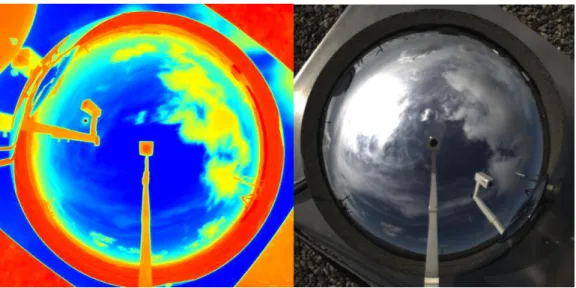
Figure 3. Infrared and visible images of the sky.
Figure 3 shows a raw image of our instrument (left) obtained during an optical communication test. A sky imager has been installed next to the SIONS-T, simultaneously acquiring the same scene in the visible spectrum (right). The LWIR image clearly shows a better contrast between clear sky and clouds. The visible camera presents a strong sun flare where the sun disk has almost no impact in the infrared image. Illumination effects (light and shadows) on the cloud surface due to the reflection of the sun’s radiance confirm that the image from the visible sky imager is influenced by the sun’s position in the sky, which is not the case of the LWIR sensor.
3. CLOUD PROPERTY RETRIEVAL METHOD
Atmospheric radiative transfer modeling inversion
The principle of the present cloud property retrieval method consists in inverting a radiative transfer model which simulates the downwelling LWIR (8 to 13 µm) radiance of the sky as observed by the instrument. We chose the radiative transfer model libRadtran developed by the German Aerospace Center under the GNU license [4]. This model permits to simulate the downward or upward radiations emitted by atmosphere layers in function of their assumed physical state and chemical composition (temperature and humidity profiles, aerosol and greenhouse gas concentration…). It has been widely used for various remote sensing applications and includes full solar and thermal spectrums.
The forward modeling of the radiance considers three different sky states: a clear (cloud-free) atmosphere, an atmosphere containing a thick cloud and an atmosphere containing a thin cloud. Simulating a clear atmosphere permits to subtract a cloud-free atmosphere radiance from the observed radiance in order to assess the radiance emitted by clouds only. We assume thick cloud emission depends only on cloud base temperature (directly related to its altitude). This assumption cannot be valid for thin cloud radiance which also depends on its optical depth (OD).
Clear atmosphere LWIR modeling
Simulating clear sky radiance (Rcs) requires the availability of temperature (T) and relative humidity (RH) vertical
profiles. However, obtaining these meteorological products anywhere in real-time is impossible in most cases. Atmospheric radiosoundings are available only for a few locations. Weather offices can provide modelled profiles but real-time or near-real-time delivery is expensive. Ground instrumentation such as LIDAR is also very costly. We proposed an empirical method permitting to estimate Rcs from ground temperature and relative humidity measured by
our instrument.
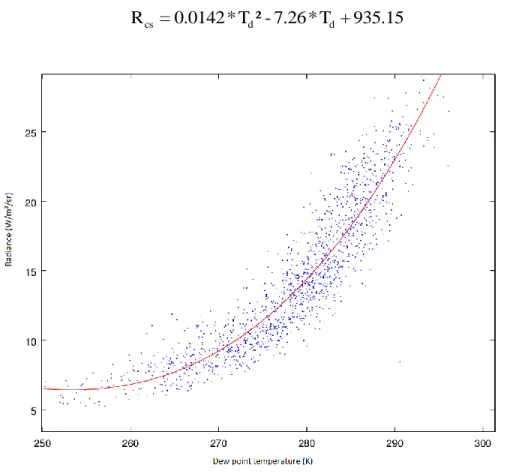
The University of Wyoming offers a worldwide atmospheric radio sounding historical database [9]. Density of radiosounding stations is relatively scarce. If profiles are not available near the instrument’s location, the reanalysis data from ECMWF (ERA-INTERIM) [10] can be used. We collect at least one year of vertical profiles, representing 1 to 4 profiles per day. For each couple of (T, RH) profile, we simulate the associated Rcs with libRadtran. We determine, for a
given site, the relationship between Rcs and the dew point temperature (Td), generally delivered with the atmospheric
profiles, with a second order polynomial regression. Equation 1 and figure 4 show the fitted relationship using the radiosounding data of Nîmes (France) during the years 2012 and 2013.
935.15
+
T
*
7.26
-²
T
*
0.0142
=
R
cs d d (1)Figure 4.Clear sky radiance as function of dew point temperature
We use this relationship to assess Rcs from our T and RH ground measurements. We compute Td using the formula of
Thick cloud altitude retrieval
As shown on figure 1, the presence of thick clouds is detected when the radiance is much larger than Rcs appears on the
instrument image. The radiance threshold to distinct a thick cloud must be preliminarily determined according to the climatic area (tropical, temperate, artic…).
We consider that Rcs is the downward radiance emitted by the entire cloud-free atmospheric column. RTkC is the
downward radiance emitted by the base of a thick cloud. A cloud is considered here as “thick” if atmospheric radiance above it cannot be detected from the ground (OD > 3). The downward radiance viewed from ground level (Rg), in the
presence of a single thick cloud layer in the atmosphere, is modelled by a combination of RTkC and the contribution of
the clear sky layer between the cloud base and the ground. For several discrete values of Rcs, a thick cloud is modelled at
different realistic altitudes. Then, for a given Rcs, a correspondence is set up between Rg and cloud base altitude.
Thin cloud property retrieval
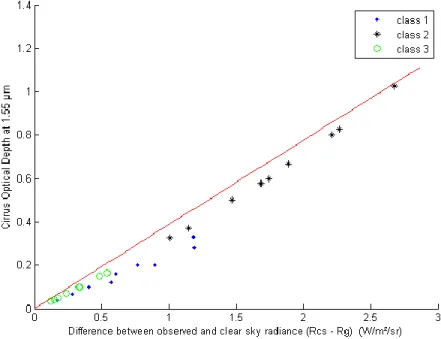
The case of thin clouds raises an issue. Low and thin cirrus clouds can show the same radiance as thicker and higher cirrus. In order to maximize the precaution to avoid cloud blockage during optical communications, the cloud property retrieval considers that any thin cloud detected is considered as a thicker and higher cirrus for the observed radiance. We simulate cirrus cloud radiances according to physical properties observed from a 12-year observation made by a Rayleigh-Mie-Raman ground-based lidar and CALIOP space borne lidar at the Observatory of Haute-Provence (South of France) [12]. In this climatological study, cirrus are categorized into three classes. Figure 5 shows the relationship between cloud optical depth at 1.55 µm for each classes and the simulated radiometric contrast (Rg - Rcs) observable by
our instrument. OD at 1.55 µm has been computed by converting cloud OD in the visible range given by [12], extrapolated at 1.55 µm using a microphysical model from the University of Madison-Wisconsin [13][14] and assuming that effective cloud radius is equal to 57 µm.
Figure 5. Relationship between cirrus optical depth and simulated radiometric contrast.
Even if class 1 (thin middle troposphere) and class 3 (high upper troposphere) cannot be properly differentiated, we can deduce a linear relationship (red line) which provides the maximal cloud optical depth for a given (Rcs – Rg) value.
4. CLOUD MOTION PREDICTION
The cloud property retrieval scheme described in section 3 leads to the real-time delivery of an optical link attenuation map. For each exploitable pixel of the SIONS-T’s field of view, the pixel is flagged as clear sky, thick cloud or thin cloud. For the last flag, we associate the retrieved cloud optical depth at 1.55 µm.
To predict a cloud blockage of the communication in the next half hour, we assume that the cloud pattern will be translated without any modification of optical cloud properties. Some intra-hour solar power forecasting methods use all-sky cameras in the visible spectrum to predict cloud obstruction of the solar disk and then forecast an abrupt decrease of photovoltaic production [15][16][17]. Reusing such algorithms for optical communication blockage prediction consists in considering the satellite’s position instead of the sun’s. We briefly present the chosen algorithm steps.
The first step consists in assessing the cloud motion field. Using two subsequent cloud maps, an optical flow analysis method provides the vector field describing the cloud motion between the two considered instants. The method of Lucas-Kanade [18], widely used in computer vision, is a convenient algorithm for this application. The second step is the temporal filtering of the cloud motion vector to minimize abrupt changes of cloud speed between subsequent vector fields. This process permits to suppress unrealistic cloud motions [16]. The final step consists in translating the cloud attenuation map according to the directions and speeds imposed by the cloud motion vector field. Consequently, the predicted attenuation maps are obtained for a series of selected time horizons. In parallel, if the satellite is not geosynchronous, its position is calculated for each time horizon. We can then derive the period duration from present to optical link blockage.
5. CONCLUSION
We presented the first elements of a cloud obstruction prediction system composed of an original all-sky observation instrument and algorithms retrieving and forecasting cloud attenuation characteristics in the next half hour. The objective of this system consists in preventing optical link cloud blockage interruption by providing operational forecasts of critical cloud cover passing through the laser line of sight. Compared to the state-of-the art, it has the advantage to providing a larger field of view of the sky vault and proposes empirical cloud property retrieval methods which are simple to implement in operational conditions.
The validation and refinement of our algorithms can be undertaken by installing a ground based lidar next to our system. Then, uncertainty of cloud altitude and cloud optical depth can be objectively assessed. An operational limit of our system concerns the lowest angular elevations. In the case of a communication with low orbit satellites, the maximization of communication time leads to the necessity of applying our algorithms at a low elevation above the horizon. The atmosphere’s higher thickness for these longer lines of sight attenuates the contrast between clear and cloudy scenes in the LWIR vision. Experimental optical communication campaigns must be undertaken to properly assess the possibility of preventing cloud blockage at a low elevation according to the quality of the optical link budget in such situations.
Simultaneous observations using geostationary meteorological satellites such as Meteosat will permit to extend the forecast time horizon by monitoring cloud cover at a higher spatial scale.
REFERENCES
[1] Juarez, J. C., Dwivedi, A., Jones, S. D., Weerackody, V., & Nichols, R. (2006). Free-space optical communications for next-generation military networks. Communications Magazine, IEEE, 44(11), 46-51.
[2] Florian Moll M. K., “Wavelength selection criteria and link availability due to cloud coverage statistics and attenuation affecting satellite, aerial, and downlink scenarios,” Proc. SPIE Free-Space Laser Communications VII, 2007.).
[3] Poulenard S., Ruellan M., Roy B., Riédi J., Parol F., Rissons A., ”High altitude clouds impacts on the design of optical feeder link and optical ground station network for future broadband satellite services”, SPIE – Photonic West LASE, 2014
[4] Mayer, B. and Kylling, A.: Technical note: The libRadtran software package for radiative transfer calculations - description and examples of use, Atmos. Chem. Phys., 5, 1855-1877, doi:10.5194/acp-5-1855-2005, 2005.
[5] Lewis, P. M., Rogers, H., & Schindler, R. H. (2010, July). A radiometric all-sky infrared camera (RASICAM) for DES/CTIO. In SPIE Astronomical Telescopes+ Instrumentation (pp. 77353C-77353C). International Society for Optics and Photonics.
[6] Thurairajah, B., & Shaw, J. (2005). Cloud statistics measured with the infrared cloud imager (ICI). Geoscience and Remote Sensing, IEEE Transactions on, 43(9), 2000-2007.
[7] Nugent, P. W., Shaw, J. A., & Piazzolla, S. (2009). Infrared cloud imaging in support of Earth-space optical communication. Optics express, 17(10), 7862-7872.
[8] Klebe, D. I., Blatherwick, R. D., & Morris, V. R. (2014). Ground-based all-sky mid-infrared and visible imagery for purposes of characterizing cloud properties. Atmospheric Measurement Techniques, 7(2), 637-645.
[9] http://weather.uwyo.edu/upperair/sounding.html
[10] Dee, D. P., Uppala, S. M., Simmons, A. J., Berrisford, P., Poli, P., Kobayashi, S., ... & Vitart, F. (2011). The ERA‐Interim reanalysis: Configuration and performance of the data assimilation system. Quarterly Journal of the Royal Meteorological Society, 137(656), 553-597.
[11] Barenbrug, A.W.T., Psychrometry and Psychrometric Charts, Cape Town, South Africa, Cape and Transvaal Printers Ltd., 1974, 3rd ed.
[12] Hoareau, C., Keckhut, P., Noel, V., Chepfer, H., & Baray, J. L. (2013). A decadal cirrus clouds climatology from ground-based and spaceborne lidars above the south of France (43.9° N–5.7° E). Atmospheric Chemistry and Physics, 13(14), 6951-6963
[13] Baum, B., Yang, P., Heymsfield, A., Platnick, S., King, M., Hu, Y.-X., and Bedka, S.: Bulk scattering models for the remote sensing of ice clouds. Part 2: Narrowband models, J. of Applied Meteorology, 44, 1896–1911, 2005b. [14] Baum, B., Yang, P., Nasiri, S., Heidinger, A., Heymsfield, A., and Li, J.: Bulk scattering properties for the remote
sensing of ice clouds. Part 3: High resolution spectral models from 100 to 3250 cm-1, J. of Applied Meteorology, 46, 423–434, 2007.
[15] West, S. R., Rowe, D., Sayeef, S., & Berry, A. (2014). Short-term irradiance forecasting using skycams: Motivation and development. Solar Energy, 110, 188-207.
[16] Marquez, R., & Coimbra, C. F. (2013). Intra-hour DNI forecasting based on cloud tracking image analysis. Solar Energy, 91, 327-336.
[17] Nitche N., Trombe P-J., Cros S., Using cloud fraction derived from all-sky camera to improve beam solar irradiance forecasting by time-series modelling, 14th European Meteorological Society (EMS) Annual Meeting & 10th European Conference on Applied Climatology (ECAC), October 6 -10 2014, Prague, Czech Republic.
[18] Lucas, B. D., & Kanade, T. (1981, August). An iterative image registration technique with an application to stereo vision. In IJCAI (Vol. 81, pp. 674-679).