Sm-Nd isotope systematics in deep-sea sediments: clay-size versus
coarser fractions
C. Innocent, N. Fagel1, C. Hillaire-Marcel GEOTOP, Université du Québec à Montréal, Montréal, Que., Canada 1Géologie des Argiles, Université de Liège, Sart-Tilman, Liège, Belgium.
Abstract
Sm-Nd studies were carried out on Last Glacial and Holocene sediments from the Labrador Sea. Three grain-size fractions were analyzed for each sediment: the clay-size fraction (<2 µ m), the fine cohesive silts (2-10 µ m) and the coarse silts (10-63 µm). In most cases, Sm-Nd signatures are different from one grain-size to another. In addition, different Sm-Nd signatures are derived from the clay-size fractions compared to the cohesive silt fraction, indicating that the cohesive fraction is heterogeneous and that distinct origins in terms of source-areas are implied. Silt fractions record the influence of supplies from the North American Precambrian Shield, whereas clay-size fractions (<2 µ m) are more sensitive to sedimentary input from the Eastern Basins, in relation with deep currents. Coupling Sm-Nd studies on silt and clay fractions may be a powerful tool to unravel the evolution of deep circulations versus detrital supplies.
Keywords : clay minerals ; deep-sea sediments ; Last Glacial Maximum ; Northwest Atlantic ; Nd-144/Nd-143
1. Introduction
Since the early work of Goldstein and O'Nions (1981), Nd isotopes have been extensively used as a natural tracer of the sources of deep-sea sediments. Several studies have been done on surface sediments from the Pacific (Jones et al., 1994), Indian (Dia et al., 1992; Vroon et al., 1995) and Atlantic (White et al., 1985; White and Dupré, 1986; Grousset et al., 1988; Innocent et al., 1997) oceans. In addition, during the last decade, past deep-sea sediments have been increasingly investigated in order to reconstruct the evolution of sedimentary supplies through time, in connection with deep current and climate changes (Grousset et al., 1993; Fagel et al., 1994, 1997a; Revel et al., 1996a; Innocent et al., 1997; Winter et al., 1997; Fagel et al., 1999).
Nd isotopes probably constitute the best long-period, radiogenic isotopic system to identify the sources of deep-sea sediments. Sr isotopic signatures may be dramatically biased due to the presence of deep-seawater Sr resulting from the long residence time of this element in seawater (Fagel et al., 1997a). Pb isotopes are generally affected (at least in the case of surface sediments) by the huge input of anthropogenic industrial lead. Recently, Innocent et al. (1997) and Fagel et al. (1999) attempted to overcome this lack of isotopic tracers by coupling the Nd isotopic ratios and the Sm/Nd ratios in order to trace the different sediment sources in an ocean area where more than two end-members are involved. This naturally requires that Sm and Nd do not fractionate significantly after deposition.
The information provided by deep-sea sediments are complementary to metalliferrous materials, such as Fe-Mn nodules. While nodules are considered to "freeze" the past seawater Nd isotopic composition (as they precipitate from seawater), sediments constitute a tracer of sedimentary inputs through time, in relation with the deep currents. However, the choice of size parameters is a matter of debate. Revel et al. (1996b) chose to work on the 10-63 µm fraction, since coarser, >63 µm fractions are unlikely to be transported by deep currents, and finer particles (<10µm) behave cohesively in the seawater and cannot be winnowed by deep currents after deposition (e.g. Mc Cave et al., 1995). In contrast, Fagel et al. (1994) have worked on the clay-size (<2 µ m) fraction. Clay-size particles may also be transported by deep currents, then deposited when the current strength decreases, but they are not further winnowed due to their cohesive behavior. Subsequent papers (Revel et al., 1996a; Innocent et al., 1997) have demonstrated that both approaches are adequate to trace the deep circulations. Following the paper of Mc Lennan et al. (1989), attempts have been made to check whether the same isotopic signature is
provided from one fraction to another. Revel et al. (1996b) have demonstrated on a Sr-Nd data set of sediments from the Gardar Drift (Northeastern North Atlantic Ocean) that different size fractions do provide different Sr-Nd isotopic compositions, reflecting the relative input of the materials derived from the two possible sediment sources (Iceland volcanism and European continental crust).
In this paper, the Sm-Nd isotopic signatures are first investigated in different granulometric fractions of deep-sea sediments: the clay-size fraction, the cohesive silt fraction and the non-cohesive silt fraction. Then, in the light of the information derived from each granulometric fraction, a standard technique for deep-sea sediments analysis is proposed.
2. Analytical techniques
2.1. Sampling and choice of the size parameters
The Last Glacial and Holocene sediments were sampled from a piston core (90-013-013, further referred as PC 13 in the text) collected in the Labrador Sea during the CSS Hudson cruise 1990. PC 13 was taken from the SW Greenland Rise at the inlet of the Western Boundary Undercurrent (WBUC) gyre (Fig. 1), and the sediments are presently bathed by the cold Denmark Strait Overflow Water (Hillaire-Marcel et al., 1994). This core has been extensively studied (sedimentology, AMS 14C dating, oxygen isotope stratigraphy, fauna and flora assemblages, mineralogy, magnetic parameters, 230Th excess, etc.) and is subsequently particularly well known.
A high-resolution Sm-Nd study on the clay-size fraction of sediments from PC 13, ranging in age from 8.6 to 26.1 kyr, has been achieved (Fagel et al., 1999). Six of these sediments were chosen for the grain-size investigations: the clay-size, <2 µm fraction, and two coarser (2-10 and 10-63 µm) fractions were analyzed for Sm-Nd. Both the clay-size and the fine silt (2-10 µ m) fractions behave cohesively in the seawater but, as the fine, <10 µ m fraction includes both fine silt and clay-size fractions, there is no reason for the cohesive fraction to be a priori homogeneous. Moreover, it should be recalled that the clay-size fraction may be independently and precisely characterized by its mineralogy, and that valuable information on the origin of deep-sea sediments are subsequently derived from clay mineralogy (e.g. Biscaye, 1965; Grousset and Chesselet, 1986; Fagel et al., 1997b), which is not the case for silt fractions.
2.2. Decalcification treatment
Most of the Nd studies of deep-sea sediments include a decalcification treatment in order to remove biogenic carbonates. Some recent studies involve a 1 N HCl treatment (Revel et al., 1996a), although it has been demonstrated that 1 N HCl leaching of clay fractions induces an important removal of REE (e.g. Clauer et al., 1993). Other decarbonation procedures are carried out using more dilute hydrochloric acid in order to avoid the alteration of clay minerals: 0.2 N (Fagel et al., 1994), or even 0.05 N in a continental environment (Toulkeridis et al., 1994). Leaching experiments on surface sediments of the northern North Atlantic Ocean (Innocent et al., 1999) have demonstrated that decalcification using 0.1 N HCl did not result in any clear shift in either Sm/Nd and Nd isotopic ratios. In contrast, 1 N HCl leaching drastically affects the Sm-Nd signature. One-third to half of both REE may be removed, producing Sm/Nd and Nd isotopic ratios that are clearly lower in the residues. Samples were thus decalcified in 0.1 N HCl and the excess acid removed by repeated washings in deionized water and centrifugation. The clay-size fraction was separated after settling according to Stake's law (Fagel et al., 1997b).
2.3. Isotope geochemistry
The analytical techniques are identical to those of Innocent et al. (1997). Briefly, samples were spiked with a mixed Sm-Nd spike. After acid dissolution, and chemical separation, Sm and Nd were run on a Sector 54 mass spectrometer. Repeated analyses of La Jolla Nd standard gave an average value of 0.511849 ± 12 (2σ standard deviation on 21 analyses). Sm-Nd data, including the depth of each sediment with corresponding AMS 14C and calibrated ages, are reported in Table 1.
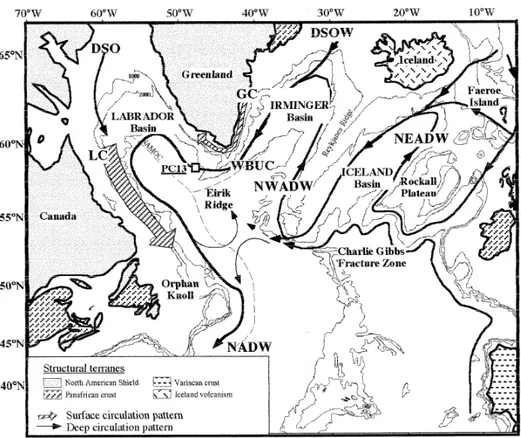
Fig. 1. Geographic map of the northern North Atlantic, showing the PC 13 coring site, major surface and deep
current trajectories modified from Mc Cartney (1992), Schmitz and Mc Cartney (1993), Dickson and Brown (1994), Lucotte and Hillaire-Marcel (1994), and structural terranes outcropping in the nearby continents. DSO: Davis Strait Overflow, DSOW: Denmark Strait Overflow Water, GC: Greenland Current, LC: Labrador Current, NADW: North Atlantic Deep Water, NAMOC: Northwest Atlantic Mid-Ocean Channel, NEADW: North East Atlantic Deep Water, NWADW: North West Atlantic Deep Water, WBUC: Western Boundary Undercurrent.
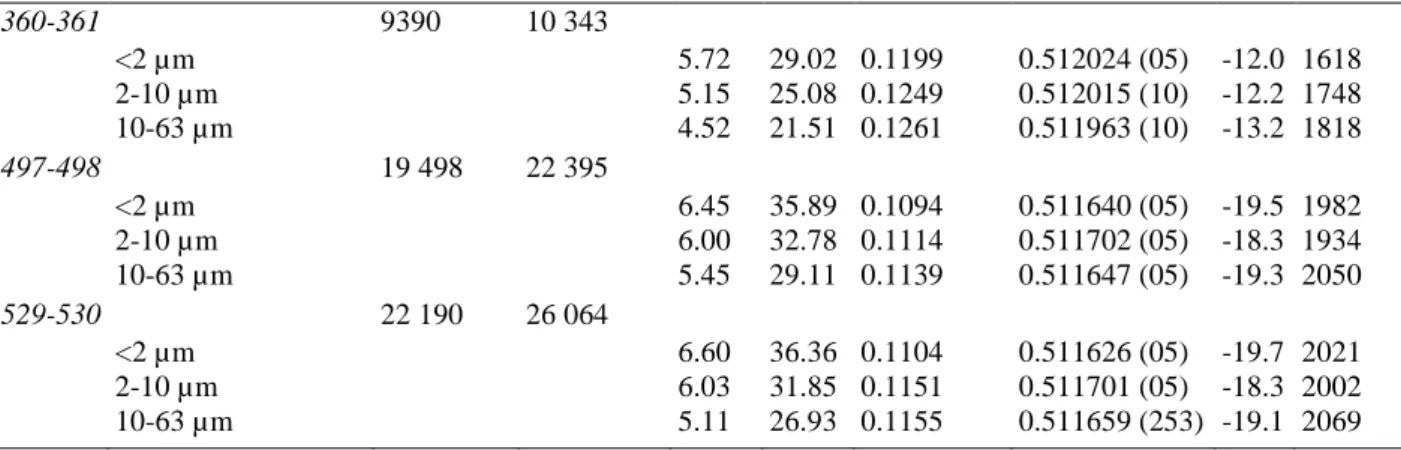
Table 1. Sm-Nd data on carbonate-free <2, 2-10, and 10-63 µm material from PC 13. Parameters for depleted
mantle model ages and eNd calculations can be found in Innocent et al. (1997). The accuracy of the Sm/Nd ratios is better than 2%. In spite of its huge uncertainty due to analytical problems, the Nd isotopic data of sample 529-530 (10-63 µm) has been reported, as its Nd isotopic ratio remains "reasonable" considering the whole data set. However, this isotopic ratio should be only considered as a "reference value". Ages reported for each sample depth were all estimated by direct linear interpolation of available AMS 14C ages, assuming a constant sedimentation rate. These ages have been further calibrated using the curve of Stoner et al. (1998). AMS C ages of this core are normalized to PDB and corrected by -400 years for reservoir effect. They are available in Hillaire-Marcel et al. (1994)
Sample (interval depth in cm) Age (years BP) Age (calibrated) Sm (ppm) Nd (ppm) 147 Sm/144Nd 143Nd/144Nd (2σ) εNd Model age (million years) 309-310 8523 9324 <2 µm 6.56 34.19 0.1167 0.511867 (07) -15.0 1795 2-10 µm 6.75 34.43 0.1193 0.511537 (10) -21.5 2324 10-63 µm 5.28 27.44 0.1171 0.511567 (11) -20.9 2233 325-326 8689 9549 <2 µm 6.15 32.25 0.1160 0.511822 (06) -15.9 1847 2-10 µm 6.05 30.41 0.1210 0.511842 (10) -15.5 1908 10-63 µm 5.10 25.35 0.1224 0.511767 (11) -17.2 2066 356-357 9200 10 151 <2 µm 7.48 40.70 0.1118 0.511872 (26) -15.2 1708 2-10 µm 5.31 26.38 0.1225 0.511851 (11) -15.4 1923 10-63 µm 4.75 23.75 0.1217 0.511684 (11) -18.6 2159
360-361 9390 10 343 <2 µm 5.72 29.02 0.1199 0.512024 (05) -12.0 1618 2-10 µm 5.15 25.08 0.1249 0.512015 (10) -12.2 1748 10-63 µm 4.52 21.51 0.1261 0.511963 (10) -13.2 1818 497-498 19 498 22 395 <2 µm 6.45 35.89 0.1094 0.511640 (05) -19.5 1982 2-10 µm 6.00 32.78 0.1114 0.511702 (05) -18.3 1934 10-63 µm 5.45 29.11 0.1139 0.511647 (05) -19.3 2050 529-530 22 190 26 064 <2 µm 6.60 36.36 0.1104 0.511626 (05) -19.7 2021 2-10 µm 6.03 31.85 0.1151 0.511701 (05) -18.3 2002 10-63 µm 5.11 26.93 0.1155 0.511659 (253) -19.1 2069
3. Results and discussion
3.1. Evidence of Sm-Nd fractionation from one grain-size to another
There is a clear variation of Sm and Nd concentrations according to grain-size (Table 1). In all but one sample (356-357 for which the clay fraction displays the highest Sm and Nd contents), the coarse silt fraction is slightly depleted in both REE compared to the two finer fractions. In addition, a slight but significant shift of 147Sm/144Nd ratios is exhibited in four samples (it is much less clear in the 497-498 and 309-310 samples), the clay fraction having the lowest 147Sm/144Nd ratios. However, these variations do not seem to correlate directly with REE contents.
The Nd isotopic signatures are also clearly different from one grain-size to another (Table 1). The most significant shifts occur in the three shallowest sediments (younger than 10.3 kyr), where the finest fractions (<2 µ m) display systematically more radiogenic Nd ratios than the coarsest fractions (10-63 µ m) (Fig. 2). The fine silt fractions (2-10 µ m) have isotopic ratios close to either the corresponding finest or coarsest fractions, at least for the four youngest samples (Table 1). In contrast, similar Nd isotopic signatures between coarse silts and clay fractions are recorded in the two oldest, Last Glacial samples. In both cases, cohesive silts seem to be more radiogenic (Table 1), but it should be noticed that the variations are very slight. Such results are sufficient to state that the different grain-size fractions record different sedimentary processes, as previously demonstrated by Mc Lennan et al. (1989), and Revel et al. (1996b) in other sites.
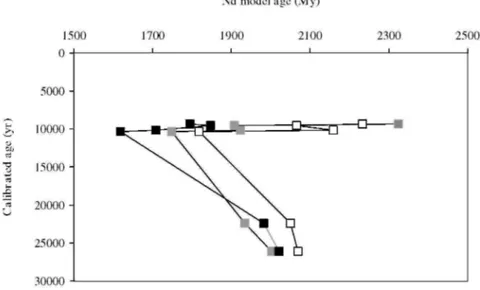
Fig. 2. Nd isotopic compositions versus calibrated ages for the PC 13 samples. Nd isotopic compositions of the
Last Glacial sediments (older than 20 kyr) cluster around 0.5116-0.5117, whatever the grain size. In contrast, clay-size fractions of post-glacial sediments provide higher Nd isotopic compositions compared to the corresponding coarser fractions. Error bars are not bigger than the symbols (except for sample 529-530, 10 µm to 63 µm).
3.2. The different sedimentary sources
In the three oldest sediments, Nd isotopic compositions of each grain size follow a similar trend of evolution through time (Figs. 2 and 3). The highest Nd isotopic ratios, together with the youngest model ages are measured in sample 360-361 (10.3 kyr). Then, coarse silts and clays are influenced by clearly distinct sedimentary supplies: non-cohesive silts undergo a enhanced "old" sedimentary input, as indicated by lower Nd isotopic ratios and older Nd model ages. This old sediment source is not evidenced in the clay-size fractions, for which Nd isotopic signatures are very similar in the three samples (Figs. 2 and 3), the cohesive silt fraction displaying once again "intermediate" characteristics.
Fig. 3. Nd model ages versus calibrated ages for the PC 13 samples. The legends are as in Fig. 2. In this case,
the clay-size fractions of postglacial sediments provide the youngest model ages.
Three main source-areas are considered to be involved to account for the Sm-Nd signature of the deep-sea sediments of the northern North Atlantic Ocean (Revel et al., 1996a,b; Innocent et al., 1997; Fagel et al., 1999). These are: the Phanerozoic crust of western Europe; the mantle-derived Mid-Atlantic volcanism; and the Precambrian North American Shield. Fig. 4 suggests that the 18 samples of this data set might be modeled as a three end-member mixing between these three sediment sources. The fact that the cohesive silt fraction of sample 309-310 plots slightly off the mixing triangle may be attributed to the uncertainty on the characteristics of each end-member (Fig. 4).
The Late Glacial samples (26.1 and 22.4 kyr) show only slight variations between the silt fractions and the clay-size fraction. This indicates that these sediments originate from the same sources, with comparable respective contributions whatever the grain size fraction. Furthermore, Sm-Nd signatures of 26.1 and 22.4 kyr samples are very similar. This suggests that sedimentary input has remained very stable during the last glaciation, or at least during its final stage (Last Glacial Maximum). Considering that Sm-Nd signatures are similar in the different size fractions, it would be tempting to conclude that they originate from the same area. In this case, this would involve a dominant, non-sorting agent transport. The high amount of coarse (>125 µm) material in these two glacial sediments (Hillaire-Marcel et al., 1994) agrees with this hypothesis. Supplies from the North American Shield are dominant, although the two finest fractions have slightly younger Nd model ages (Table 1 and Fig. 3). This agrees with mineralogical (Fagel et al., 1997b) and geochemical (Innocent et al., 1997; Fagel et al., 1999) evidences that the WBUC outflow (Fig. 1) was present but strongly reduced during the Last Glacial Maximum.
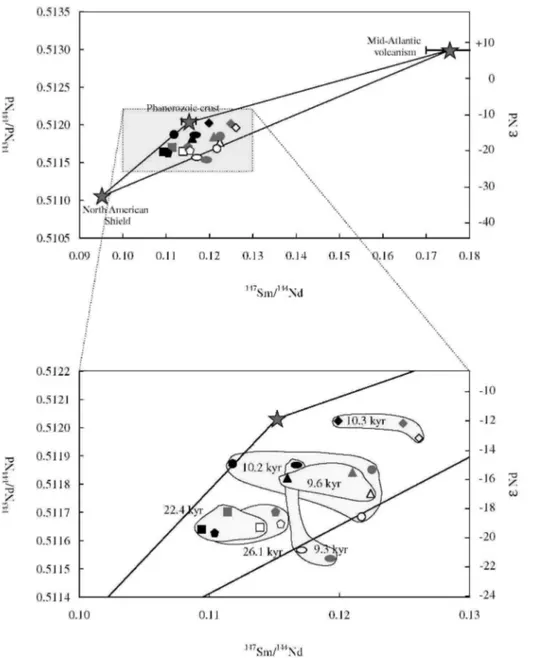
Fig. 4. Sm-Nd mixing diagram for the PC 13 samples. As in Fig. 2, black symbols correspond to clay-size (<2
µm) fractions, gray symbols to 2-10 µm fractions and open symbols to 10-63 µm fractions. Ellipses: 9.3 kyr samples, triangles: 9.6 kyr samples, circles: 10.2 kyr samples, diamonds: 10.3 kyr samples, squares: 22.4 kyr samples, pentagons: 26.1 kyr samples (see zoom diagram, downwards). Error bars are not bigger than the symbols in the zoom diagram (downwards), except for sample 529-530, 10-63 µm. The end-members defined in Fagel et al. (1999) have been reported in the diagram. They are derived from a review, then a statistical treatment of the available Sm-Nd data on rock samples (shales and greywackes) from surrounding outcropping structural terranes, except the North American Shield, which has been deduced from both surface sediments (Innocent et al., 1997) and previously published data (Revel et al., 1996a and references therein). As it includes a large variety of structural terranes, it should not be considered as an invariable point. Also, when larger than the symbols, the uncertainties have been reported for the two other end-members. The general diagram (upwards) shows clearly that the clay-size fractions (black symbols) are shifted towards the Phanerozoic crust end-member compared to coarser fractions. The zoom diagram (downwards) emphasizes, in addition, the evolution of the Sm-Nd signatures through time, depending on the mantle sedimentary input from the Mid-Atlantic Ridge (one should keep in mind that as Nd concentrations are lower in such types of material compared to typical crustal rocks, the contribution of volcanic material tends to be underestimated in this diagram).
The analyzed post-glacial samples range from 10.3 to 9.3 kyr, i.e. after the Younger Dryas cooling event. All the samples are shifted towards the Mid-Atlantic Volcanism end-member, whatever the grain-size, indicating
enhanced sedimentary input from the eastern Iceland and Irminger Basins after the Younger Dryas. The influence of Mid-Atlantic Volcanism is best marked at 10.3 kyr, in agreement with the changes in WBUC strength (Fagel et al., 1997b). In all samples, the clay-size fractions are strongly shifted towards the "young crust" end-member (Fig. 4), whereas non-cohesive silt fractions are influenced by "old" supplies originating from the North American Shield. As coarser fractions do not have apparently the same origin, one may consider that a sorting transport agent is involved. The simplest explanation would call for a transport by bottom waters from the Greenland Sea to the Labrador Sea through the Denmark Strait (Innocent et al., 1997). Moreover, it is striking that no further influence of "old" Nd can be evidenced in the clay-size fraction of sample 309-310 (9.3 kyr), compared to other post-glacial sediments. During this period, a massive discharge event, probably resulting from the collapse of the Hudson Bay ice dome (Hillaire-Marcel et al., 1994; Andrews et al., 1995), provided massive sediment supplies from the North American Shield, as it is recorded in both silt fractions (either cohesive or not) of sample 309-310 (Figs. 2-4).
4. Concluding remarks
In the light of this study, it appears that Sm-Nd studies on clay-size and silts fractions are complementary. The cohesive fraction of deep-sea sediments is clearly heterogeneous, and their respective origin may be completely different. If the Sm-Nd signatures are different from one grain-size to another, distinct information may be derived. Clay-size fractions appear to constitute the best tracer of sedimentary supplies transported by deep currents. The coupled analysis of different size fractions may also help to draw preliminary conclusions on the transport agent. This may allow to trace simultaneously both the evolution of deep circulation patterns through time and of detrital supplies deriving from nearby outcropping terranes.
Acknowledgements
This study is part of a scientific project on the northern North Atlantic Ocean, supervised by C.H.M. Thanks are due to Prof. R.K. Stevenson for his help with Sm and Nd analyses, and to Dr A. Dia for reviewing the manuscript.
References
Andrews, J.T., Mc Lean, B., Kerwin, M., Manley, W., Jennings, A.E., Hall, F., 1995. Final stages in the collapse of the Lauren-tide ice sheet, Hudson Strait, Canada, NWT: 14C AMS dates, seismic stratigraphy, and magnetic susceptibility logs. Quat. Sci. Rev. 14, 983-1004. Biscaye, P.E., 1965. Mineralogy and sedimentation of recent deep-sea clay in the Atlantic Ocean and adjacent seas and oceans. Geol. Soc. Am. Bull. 76, 803-832.
Clauer, N., Chaudhuri, S., Kralik, M., Bonnot-Courtois, C., 1993. Effects of experimental leaching on Rb-Sr and K-Ar isotopic systems and REE contents of diagenetic illite. Chem. Geol. 103, 1-16.
Dia, A., Dupré, B., Allègre, C.J., 1992. Nd isotopes in Indian Ocean sediments used as a tracer of supply to the ocean and circulation paths. Mar. Geol. 103, 349-359.
Dickson, R.R., Brown, J., 1994. The production of North Atlantic Deep Water: sources, rates, and pathways. J. Geophys. Res. 99, 12 319-12 341.
Fagel, N., Debrabant, P., André, L., 1994. Clay supplies in the Central Indian Basin since the Late Miocene: climatic or tectonic control?. Mar. Geol. 122, 151-172.
Fagel, N., André, L., Debrabant, P., 1997a. Multiple seawater-derived geochemical signatures in Indian oceanic pelagic clays. Geochim. Cosmochim. Acta 61, 989-1008.
Fagel, N., Hillaire-Marcel, C., Robert, C., 1997b. Changes in the Western Boundary Undercurrent outflow since the Last Glacial Maximum, from smectite/illite ratios in deep Labrador Sea sediments. Paleoceanography 12, 79-96.
Fagel, N., Innocent, C., Stevenson, R.K., Hillaire-Marcel, C., 1999. Deep circulation changes in the Labrador Sea since the Last Glacial Maximum: new constraints from Sm-Nd data on sediments. Paleoceanography 14, 777-788.
Goldstein, S.L., O'Nions, R.K., 1981. Nd and Sr isotopic relationships in pelagic clays and ferromanganese deposits. Nature 292, 324-327. Grousset, F.E., Chesselet, R., 1986. The Holocene sedimentary regime in the northern Mid-Atlantic Ridge region. Earth Planet. Sci. Lett. 78, 271-287.
North Atlantic. Earth Planet. Sci. Lett. 87, 367-378.
Grousset, F.E., Labeyrie, L., Sinko, J.A., Cremer, M., Bond, G., Duprat, J., Cortijo, E., Huon, S., 1993. Patterns of ice-rafted detritus in the glacial North Atlantic (40°-55°N). Paleoceanography 8, 175-192.
Hillaire-Marcel, C., de Vernal, A., Bilodeau, G., Wu, G., 1994. Isotope stratigraphy, sedimentation rates, deep circulation, and carbonate events in the Labrador Sea during the last ~200 ka. Can. J. Earth. Sci. 31, 63-89.
Innocent, C., Fagel, N., Stevenson, R.K., Hillaire-Marcel, C, 1997. Sm-Nd signature of modern and late Quaternary sediments from the northwest North Atlantic: implications for deep current changes since the Last Glacial Maximum. Earth Planet. Sci. Lett. 146, 607-625. Innocent, C., Fagel, N., Stevenson, R.K., 1999. Do leaching experiments in deep-sea clays isolate a seawater component?. Can. J. Soil. Sci. 79, 707-713.
Jones, C.E., Halliday, A.N., Rea, D.K., Owen, R.M., 1994. Neodymium isotopic variation in North Pacific modern silicate sediment and the insignificance of detrital REE contributions to seawater. Earth Planet. Sci. Lett. 127, 55-66.
Lucotte, M., Hillaire-Marcel, C., 1994. Identification des grandes masses d'eau dans les mers du Labrador et d'Irminger. Can. J. Earth Sci. 31, 5-13.
Mc Cartney, M.S., 1992. Recirculating components to the deep boundary current of the northern North Atlantic. Prog. Oceanogr. 29, 283-383.
Mc Cave, I.N., Manighetti, B., Robinson, S.G., 1995. Sortable silt and fine sediment size/composition slicing: parameters for paleocurrent speed and palaeoceanography. Paleoceanography 10, 593-610.
Mc Lennan, S.M., Mc Culloch, M.T., Taylor, S.R., Maynard, J.B., 1989. Effects of sedimentary sorting on neodymium isotopes in deep-sea turbidites. Nature 337, 547-549.
Revel, M., Sinko, J.A., Grousset, F.E., 1996a. Sr and Nd isotopes as tracers of North Atlantic lithic particles: paleoclimatic implications. Paleoceanography 11, 95-113.
Revel, M., Cremer, M., Grousset, F., Labeyrie, L., 1996b. Grain-size and Sr-Nd isotopes as tracer of paleo-bottom current strength, Northeast Atlantic Ocean. Mar. Geol. 131, 233-249.
Schmitz, W.J., Mc Cartney, M.S., 1993. On the North Atlantic circulation. Rev. Geophys. 31, 29-49.
Stoner, J.S., Channell, J.E.T., Hillaire-Marcel, C, 1998. A 200 kyr geomagnetic chronostratigraphy for the Labrador Sea: indirect correlation of the sediment record to SPECMAP. Earth Planet. Sci. Lett. 159, 165-181.
Toulkeridis, T., Goldstein, S.L., Clauer, N., Kröner, A., Lowe, D.R., 1994. Sm-Nd dating of Fig Tree clay minerals of the Barberton greenstone belt, South Africa. Geology 22, 199-202.
Vroon, P.Z., Van Bergen, M.J., Klaver, G.J., White, W.M., 1995. Strontium, neodymium, and lead isotopic and trace-element signatures of the East Indonesian sediments: provenance and implications for Banda Arc magma genesis. Geochim. Cosmochim. Acta 59, 2573-2598. White, W.M., Dupré, B., 1986. Sediment subduction and magma genesis in the Lesser Antilles: isotopic and trace element constraints. J. Geophys. Res. 91 (B6), 5927-5941.
White, W.M., Dupré, B., Vidal, P., 1985. Isotope and trace element geochemistry of sediments from the Barbados Ridge-Demerara Plain region, Atlantic Ocean. Geochim. Cosmochim. Acta 49, 1875-1886.
Winter, B.L., Johnson, C.M., Clark, D.L., 1997. Strontium, neodymium and lead isotope variations of authigenic and silicate sediment components from the Late Cenozoic Arctic Ocean: implications for sediment provenance and the source of trace metals in seawater. Geochim. Cosmochim. Acta 61, 4181-4200.