SIMULATION-BASED ANALYSIS OF THE OVERHEATING RISK
IN AN AUDITORIUM BUILDING
Philippe ANDRE and Jacques NICOLAS Fondation Universitaire Luxembourgeoise
185, Avenue de Longwy B-6700 ARLON
Belgium
U1. INTRODUCTION
In 1986, a passive solar building was constructed on the FUL campus, to serve as a place for meetings and lectures. The building features several typical passive solar concepts with the objective of reducing the heating load: high level of thermal insulation, important thermal inertia, highly glazed south facade. For heating purposes, the building uses direct gain (windows) and indirect gain (mass walls) concepts. The building is furthermore equiped with a gas-fired boiler, a mechanical ventilation system and an external shading device. An intensive monitoring campaign was conducted on the building, between 1988 and 1990, in the context of an International Energy Agency project (Solar Heating and Cooling programme), namely "Passive Solar and Commercial Buildings". The monitoring pointed out several problems related to the efficiency of the passive solar system (important shading of the mass wall, too large glazed facade), but also with the summer overheating conditions: temperatures up to 31.5 °C were recorded in the offices and up to 35.7 °C was measured in the central hall (direct gain zone) of the building. Consequently, different solutions were engineered to reduce the problem. A systematic simulation-based analysis was realized in order to compare several cooling variants. The purpose of this paper is to explain and illustrate how the commercial softwares MBDSA ("UMUultizone UBUuilding UDUynamic USUimulation of UAUTIC") and TRNSYS were used for that purpose: modelling and simulation hypothesis, relevancy with the real situation, validation approach. This procedure allows conclusions to be drawn, that should be implemented in the building in a near future in order to reduce the overheating risk in the building.
U2. BUILDING DESCRIPTION. [1]
The building is situated in a peripheral area of Arlon, a small town in South Belgium. It has been built on a horizontal surface, close to a highway. There is no material obstruction to solar radiations until the end of the afternoon when the sun disappears behind surrounding buildings.
The building has a rectangular (30 x 14 m) shape. This two-storied building is elongated from east to west and the southern facade has a trapezoidal shape with a maximum height of 10.75 m. The first storey consists of two amphitheaters enclosing a central hall. The second storey includes two meeting-rooms and several offices enclosing the same hall. The amphitheaters, offices and meeting-rooms are separated from the glazed south facade by concrete mass walls and narrow sunspace areas. The building cross-section is trapezoidal with a height continuously decreasing from 10.75 m (south facade) to 4 m (north facade).
The structure of the building is composed by load-bearing masonry walls with an insulating material (thickness = 12 cms) and a covering material for rain protection. The south-faced side is highly glazed : the glazed fraction is 66 % of the total southern facade. Concrete mass walls are situated behind the glazing and have both a thermal storage and a load bearing function. The north-faced side is insulated and consists of load-bearing concrete walls. The windows are double high emissivity glazing with aluminium frame. The insulating material of walls, roofs and floors is glass wool. The typical U-values in W/m2K are 0.41 (floor), 0.28 (walls), 3.02 (windows) and 0.18 (roofs). This leads to an envelope heat loss factor of 1.6 kW/K for transmission through the fabric.
The direct gain rooms are heated by solar radiation. The concrete walls provide short-term heat storage for amphitheatres, meeting rooms and offices and dampens the temperature fluctuations. Additionally, heating is produced by an auxiliary gas-fired boiler and distributed by thermostatically controlled radiators. In case of overheating or air pollution, ventilation automatically activated in amphitheaters and meeting-rooms. The glazed facade is provided with external roller-blinds which are activated during the night, in order to reduce the heat losses, and during overheating periods. No computer control of the building is provided even though the heating, ventilating and shading systems are partly automatically controlled.
The main passive solar feature consists of two mass walls situated in the southern facade and enclosing a direct gain central zone. Each mass wall is composed by a glazing with an external shading device, a buffer space and a thermal accumulation wall. The total glazing area is 135 m2, representing 66 % of the south facade. The solar radiation is collected by the glazing and accumulated in the wall. Long-wave radiations are exchanged between the wall and the glazing and increase wall surface and air temperatures. The heat is slowly conducted through the wall and released, with a timeshift, to the rooms to be heated. The glazing is double without low-emissivity coating. The walls are painted white even though this colour is not optimal for the purpose of solar collection. The walls are composed by a combination of L-shaped concrete elements, separated between each other by interior windows. Additional interior windows are integrated in the concrete elements themselves at the second storey in order to provide some more daylighting in the offices and meeting-rooms. The external shading device is automatically activated during the night, during the weekend in winter and can be partly lowered manually by the occupants in case of overheating. Furthermore, the
central part of the building works as a direct gain zone with a lot of solar radiation and heat storage in the walls, floors and concrete beams.
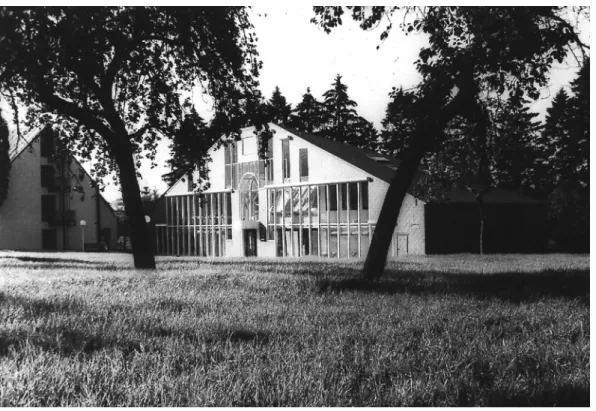
Fig. 1: General view of the FUL building
U3. MONITORING RESULTS.
An intensive monitoring campaign was conducted between 1988 and 1990. The campaign involved more than 60 sensors: temperatures, air velocities, solar radiations, heat flows. The results showed the summer overheating problems appearing in the direct gain central zone but also in the offices zone where additional windows are present in the mass wall.
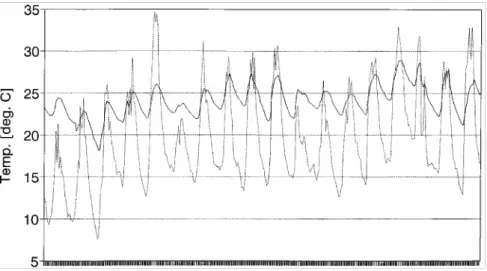
Fig. 2 shows an evolution of the temperature in this zone for the august 89 period. On the same figure, the evolution of the ambient temperature is shown as well.
Fig. 2: Ambient and offices temperature for the august 89 period.
Still higher temperatures (up to 35°C) were recorded in the direct gain central zone. To solve these problems, an additional ventilation system was installed in the offices zone (ventilation rate: 1200 m3/h). This system was actually connected to the system ventilating the auditorium, thanks to a flow diverter. This additional system has to be manually (by mean of a switch) activated by the occupants of the offices. A reverse connection between the switch and the position of the flow diverter and the noise produced by the ventilator made this device UnotU used at all.
In a second phase of renovation, internal shutters were placed in front of the offices windows. Their efficiency was not monitored but does not seem to be very important.
Furthermore, the 1994 and 1995 summers were very dramatic at the overheating viewpoint, and still warmer temperatures than in 1989 were observed.
For all these reasons, solving the overheating problem appears as more and more crucial and it was decided to perform a systematic analysis of the problem and to test, using a simulation technique, different "cooling" strategies.
U4. SIMULATION-BASED ANALYSIS.
Simulation allows the testing of a selection of cooling strategies provided the software used for the analysis includes the relevant calculation routines. In this paper, the analysis will concentrate on the temperatures calculated for the "offices" zone (first floor).
4.1. Selected software.
Two simulation softwares were used in this analysis, which are in some respect very close to each other and even include some common calculation routines: MBDSA [2] and TRNSYS [3]. MBDSA is a software developed by the University of Liège in order to dynamically simulate multizone buildings. The main features of the program are the following:
• consideration of the main energy flows participating to the energy balance of the different zones of a building.
• solution of the diffusion equation by the z-transform approach. • typical time step: 1 h
The energy balance calculation routine of MBDSA was developed to be compatible with the TRNSYS software: this routine is in fact a TRNSYS "Type" (named Type 46) and can be included as such in the simulation with the TRNSYS software.
Consequently, TRNSYS was also used in this analysis, either to use the Type 46 (and obtain results identical to those obtained with MBDSA) or to use other components (cooling coils and mechanical ventilation systems) in order to take more complex systems into account. 4.2. Simulated strategies.
The building was designed with a number of cooling strategies. Others were added during the life of the building. The simulation considered those strategies as well as others that were not introduced in the building, either for financial or for technical reasons.
The simulated strategies are the following:
- No device at all (hereafter considered as the "base" case) - Placement of overhangs (1m and 2m deep)
- Activation of external shutters - Activation of internal shutters
- Ventilation at the ambient temperature (day-time and/or night-time) - Perfect cooling at a given setpoint
- Day time ventilation with addition of a cooling coil in the ventilation system - Air and structure night ventilation at the ambient temperature.
4.3. Simulated meteorological periods.
Two different meteorological periods were simulated:
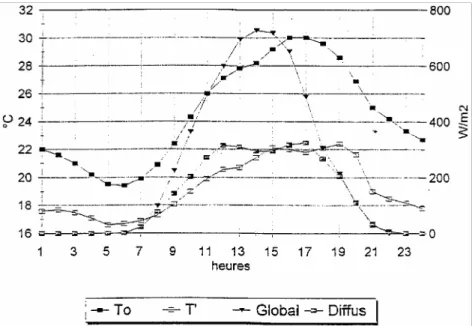
- an "artificial" hot wave made of a repetition of 25 times the same day, obtained with a slight adaptation of a real day recorded at the belgian station of Uccle (Brussels). Fig. 3 shows the evolution of the ambient temperature and of the global horizontal solar radiation for this day.
Fig. 3: Ambient temperature and global solar radiation for the artificial belgian "hot" day. - a real period, recorded on the FUL campus (Arlon, south of Belgium), during august 89. The use of this data set allows a comparison of measured and calculated quantities. Fig. 2 shows the evolution of the ambient temperature during this period.
U5. SIMULATION OF THE DIFFERENT VARIATIONS. 5.1. Base case (No device at all).
a. Description.
Simulation of the base case allows, at least for the august 89 period, a direct comparison of calculation results and measured values. Indeed, during 89, no cooling device was operating in the building. This led to a maximum observed temperature of 29°C in the "offices" zone and to 34.4 °C in the central hall zone (upstairs). Fig.4 shows a comparison of the observed and calculated temperatures in the offices zone for a sequence of a few days during the reference period. The analysis shows that the results of the simulation can be considered as reliable and that the software used (MBDSA or, equivalently, TRNSYS with the Type 46 routine) can be used to perform the parametric analysis.
Fig. 4: Offices temperature for the August 89 period. Base case.
b. Calculation method.
For this simulation, results were obtained with a "standard" use of MBDSA or TRNSYS Type 46. A detailed review of the modelling hypotheses is given in [4]. c. Hot wave period.
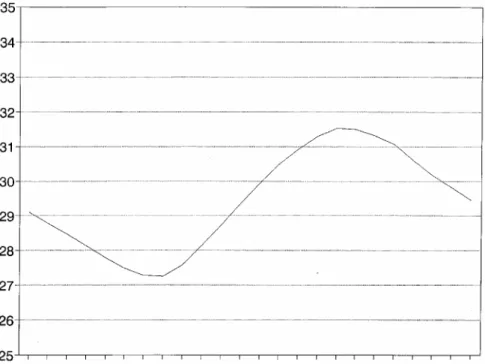
Figure 5 shows the evolution of the temperature in the "offices" zone (results are given for the last day of the fictitious 25 days period). This will serve as a basis for comparison with the other variants. It can be seen that highly uncomfortable temperature are observed in the room (maximum temperature = 31.5 °C).
Fig. 5: Offices temperature for the hot wave. Base case.
5.2. Placement of overhangs. a. Description.
This is the most passive solar protection. In this variation, an overhang is placed at the top of the window facing the offices. The dimensions of the overhang are the following:
-length: 6.3 m
- width : 1m or 2m (two variants considered) b. Calculation method.
For the simulation with the MBDSA software, the calculation uses the possibility offered by the meteorological preprocessor of MBDSA (called "PRETA") to define solar protections using either a geometrical method or a shading coefficient method. The first method is only valid for some shape of overhangs which happily fit with the present case. Consequently, the first method was used. The principle is to calculate, from the dimensions of the window, of the overhang and from the position of the sun (altitude and azimuth), whether the direct solar radiation is intercepted or not. The reduction of solar radiation is only applied to the direct part and provides a modification of the solar radiation impinging the shaded surface.
For simulation with the TRNSYS program, two alternatives are feasible:
• use the same preprocessor as above and input the preprocessed data directly as TRNSYS input file, by means of a data reader (Type 9).
• use the solar radiation preprocessor fo TRNSYS (Type 16), which proposes a number of calculation methods, and connect this preprocessor to the "Overhang and Wingwall" Type 34, also part of the TRNSYS library. This last component does take into account the reduction of the diffuse part of the radiation by the overhang or the wingwall: view factors are calculated between the overhang/wingwall and the sky on the ground. For these calculations, the diffuse and reflected radiation component are supposed isotropic.
c. Hot wave period.
It appears that the effect of placing an overhang is not very important: maximum temperaure is only reduced to 30.7 °C (1m overhang) and 30.5°C (2m overhang). This shows that the overheating is not only due to the effect of direct solar radiation reaching the offices windows but also to the radiation entering in the building through the direct gain system. Consequently, overhangs should be placed on top of this window as well.
The previous results are confirmed for the August 89 period. Placing an overhang only reduces the offices temperature by a few tenths of degrees.
e. Comments.
Placing an overhang on top of the offices window is a simple design solution but does not change the comfort in the zone to a sufficient extent. Overhangs should be placed on top of all the windows (specially the direct gain ones) of the south facade.
5.3. Activation of external shutters. a. Description
The building is provided with external shutters which are normally activated during the night in wintertime to reduce the heat losses of the building. They could be used for overheating control as well, in summertime but, in this case, they dramatically reduce the daylighting in the building and obviously create a non pleasant working atmosphere. Nevertheless, the activation of the shutters, during the day in summertime, has been simulated to analyze the real influence of solar radiation on the overheating risk.
b. Calculation method.
The activation of the external shutters is simulated by a scheduled modification of the optical properties of the window. Table 1 shows the optical and thermal properties of the glazing in both cases.
Property/Case Glazing Glazing+shutters
U value 7.35 7.35
Solar absorptance 0.14 0.2
Transmittance 0.675 0.0
Reflectance 0.185 0.8
Table 1: Optical and thermal properties of glazing, with and without external shutters.
The table shows that identical U-values (from surface to surface) were considered for both cases, with the implicit assumption that the temperature in the space btween the shutters and the glazing was identical to the ambient temperature, thanks to a good ventilation of this space. Aluminium, white painted shutters explain the increase of the reflectance value up to 0.8.
Furthermore, reduction of solar gains in the offices made artificial lighting necessary during the working hours: a constant lighting of 15 W/m2 was supposed in the offices. c. Hot wave.
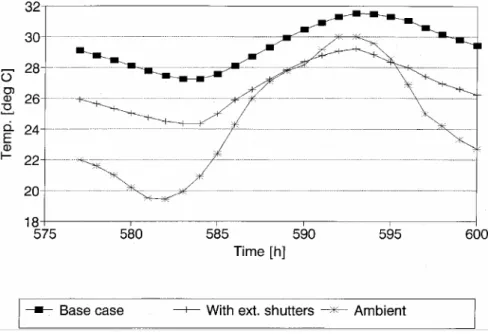
Fig. 6 shows the effect of activating the external shutters on the office temperature: the decrease of the temperature is more or less constant throughout the day UandU the night and amounts to 3 °C. This is not sufficient to provide comfort in the zone as the temperature does not fall below 24°C at the end of the night. This confirms that solar radiation is not the only responsible factor of the overheating. But, as for the overhangs, the shutters were supposed to be activated on the windows facing the offices only.
d. August 89 period.
The effect of the activation of external shutters is the same for the august 89 period. Maximum temperature is reduced to 26°C at the end of the afternoon. In this case, the decrease in temperature is constant and amounts to 2..3°C.
e. Comments.
Activation of external shutters induce a reasonably correct effect on the temperature. But the question of the acceptance of this strategy by the occupants is crucial. It is also important not to forget the increase of the lighting load resulting from the cancellation of solar gains.
5.4. Activation of internal shutters. a. Description.
The building is also provided with internal shutters (with movable orientation) in front of the offices windows. These devices were installed after a few years of building operation.
b. Calculation method.
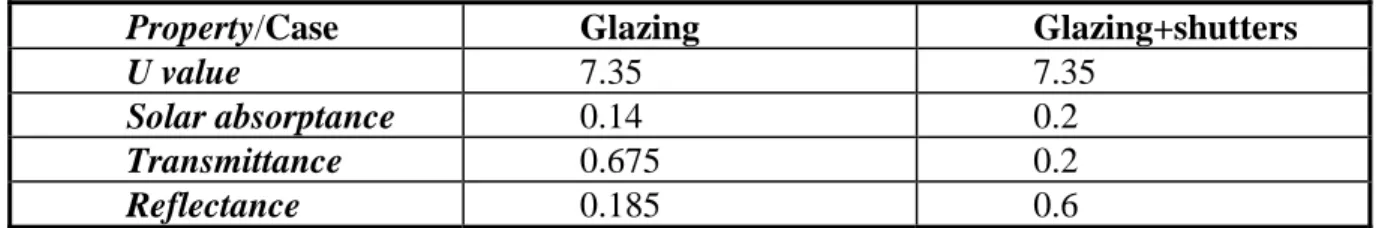
As for the external shutters, the internal solar protections are simulated by a modification of the optical properties of the glazing. Table 2 shows the compared properties of the window, with and without the internal shutters.
Property/Case Glazing Glazing+shutters
U value 7.35 7.35
Solar absorptance 0.14 0.2
Transmittance 0.675 0.2
Reflectance 0.185 0.6
Table 2: Optical and thermal properties of the window with and without internal shutters.
c. Hot wave.
The effect of placing internal shutters is qualitatively the same as that of the external ones. The magnitude of the decrease of the offices temperature is smaller than in the former case. For the hot wave period, the maximum temperature is reduced to 30.9 °C. It is nevertheless important to note that the window modelling technique (reduction to an equivalent single layer) does not allow to consider that the solar radiation is absorbed or reflected UbehindU the glazing. The "greenhouse effect" occuring between the glazing and the shutters is not considered.
d. August 89.
A very small effect is observed when placing internal shuters on the offices temperature for the August 89 period. The device appears as quite unefficient.
e. Comments.
Despite of the relative modelling unaccuracy (which calls for improvement of window modelling), this variation shows that the placement of internal shutters in front of the offices windows does not affect the thermal comfort in the zone to a sufficient extent.
5.5. Ventilation of the offices at the ambient temperature.
a. Description.
The building was constructed without any ventilation system in the offices zone, although the first project of the architects did include such a system. The first renovation operation of the building was the continuation of the ventilation system in the offices (see above). This system is connected to the existing ventilator (nominal flow: 1200 m3/h), normally ventilating the auditoriums.
b. Calculation method.
To simulate this variation, the "ventilation" component available in the Type 46 software was used. This component allows the definition of an air renewal (in volumes/h) at a given temperature, which can be either the ambient temperature or the temperature of a "cooled" air, if a cooling coil is present in the ventilation system. In this case, the ambient temperature was selected with a nominal flow rate of 1200 m3/h.
c. Hot wave.
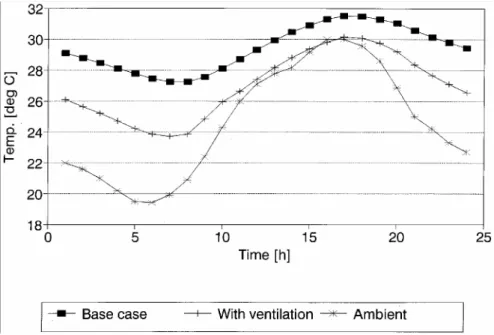
Figure 7 shows the effect of the day time ventilation of the offices at the ambient temperature. This effect is quite small because of the high level of ambient temperature. As expected, the temperature is reduced to a kind of average value between the base case temperature and the ambient temperature. In the simulation, it is not considered that the ventilated air is taken on the north side of the building, where the ambient temperature might be somewhat lower than on the south side.
Figure 8 shows the effect of a night activation of the ventilation. It is slighty more efficient to ventilate during the night but this does not allow the room temperature to fall below 24°C at the end of the night. Consequently, for extreme conditions, it is not possible to maintain acceptable comfort conditions by ventilating air at the ambient temperature.
Fig. 7: Effect of day time offices ventilation at the ambient temperature. Hot wave period.
Fig. 8: Effect of night time ventilation at the ambient temperature. Hot wave period.
d. August 89 period.
Although not so extreme, the august 89 period points out the total unefficiency of the day time ventilation at the ambient temperature: the high level of the ambient temperature induces an additional heating of the rooms by the ventilation system. Conversely, activation of the ventilation system during the night results in making the rooms comfortable during the first hours of the day.
e. Comments.
The efficiency of a ventilation system to improve thermal comfort strongly depends on the temperature of the flow stream. When the ambient air is hot, it is probably not very useful to ventilate it without any cooling action. The effect of a cooling action is analyzed in the next paragraph. In any case, it seems better to ventilate during the night, in case of extreme summer conditions.
5.6. Improvement of the natural ventilation concept. a. Description.
The design of the building does not allow a good natural ventilation to take place. Only the entrance door of the building can be opened as well as two emergency doors placed in each auditorium. Windows are generally not openable, some roof windows excepted. Furthermore, they were placed in the offices, not in the central hall, and the the flow path appears quite difficult to establish between the door and the roof windows. It would probably have been more useful to place an openable window on top of the roof and to use either the main door or the emergency doors as fresh air inlet. Simulation allows the different strategies to be tested:
• Natural ventilation with the following flow path: main entrance door, central hall, roof top window.
• Natural ventilation with the following flow path: emergency doors, auditorium, central hall, roof top window.
b. Calculation method.
The MBDSA software, as well as TRNSYS Type 46, allows to take natural ventilation flows into account and to determine their effect on the energy balance. It does not calculate the flows themselves but calculate the energy balance of the zone once the flows are known and imposed. This is of course a serious limitation of the program. If a detailed calculation of the ventilation flows was required, a more specific program like COMIS [5] or ESP-r [6] should be used. For a calculation with MBDSA or TRNSYS, the key point is of course to estimate the flows with a reasonable level of accuracy. In this case, they were fixed to 1200 m3/h between each auditorium and the central hall.
c. Hot wave results.
Results are not effective for the first strategy. This can easily be explained by the fact that the ambient temperature is too high in order to substantially decrease the building temperature. In this case, natural ventilation should be limited to the night when the potential for cooling is slighly higher. The second strategy does not appear effective either. The offices temperature stays above 31°C.
d. August 89 period.
Similar conclusions can be drawn from the simulation of the august 89 period. e. Comments
The use of natural ventilation does not appear effective in this building. Estimated airflows are too small in order to reduce the overheating. Furthermore, the flow path between the ambient and the offices is difficult to establish.
5.6. Perfect cooling of the offices. a. Description.
The previous paragraph showed the importance of the ventilated air temperature. The problem of estimating the required air temperature can be solved by the definition of a perfect cooling action in the offices (with a "high" cooling power). This cooling device calculates a "net" cooling power to be injected in the zone. From that net power, the required air temperature to produce this cooling effect can be calculated. b. Calculation method.
The calculation will make use of the "cooling" component available in the Type 46. Such a cooling device was defined in the offices zone with a "big" power(5 kW), in order to allow an estimation of the required power. The cooling device was defined with a 24°C setpoint during the occupation period and 40°C outside of it (ie no cooling at all). A subsequent simulation used the TRNSYS software and a more complex representation of the cooling system: cooling coil with a proportional control of the cold water inlet, ideal chiller (producing water at 7°C), zone temperature controlled fan.
c. Hot wave.
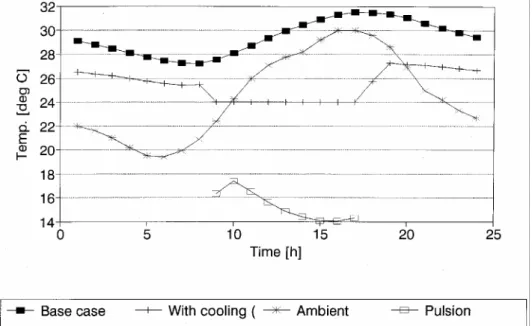
Fig.9 shows the evolution of the temperature due to the activation of a 5 kW cooling device. This power appears as sufficient in order to reduce the temperature to the setpoint value (24°C) during occupation time. The required maximum power amounts to 4 kW and can be "translated" in a required pulsion temperature, assuming a constant air flow (1200 m3/h). The figure shows also the evolution of the pulsion air temperature. The minimal required air temperature is 14°C. It is interesting to observe that this strategy does not avoid the night time overheating: temperature during the
night is stabilized around 26°C. An interesting variant would be to complement day time cooling by a night time ventilation at the ambient temperature. It is also important to take the required cooling energy into account to make the comparison with the previous options totally objective.
Fig. 9: Effect of a perfect cooling action on the office temperature. Hot wave period.
d. August 89 period.
To analyze the august 89 period, the perfect cooling was replaced by a ventilation at the temperature of 14°C and the resulting offices temperature was calculated. Fig. 10 shows this evolution which indicates a perfect maintenance of the comfort conditions. The 14°C temperature is even too low and could be slightly increased.
Fig. 10: Offices temperature with a 14°C ventilation. August 89 period.
5.7. Structure ventilation. a. Description.
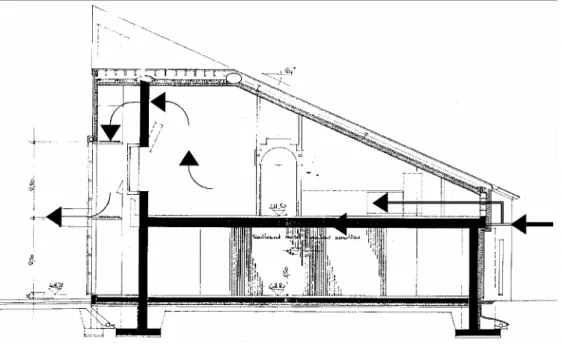
The first concept proposed by the architects included the summer time ventilation of fresh air within the structures (concrete slabs and mass walls) of the building (during the night). Similarly, in winter time, ambient air, preheated in the sunspace would have been ventilated in the same structures. It was therefore interesting to analyze, by simulation, what would have been the influence of such a strategy, in order to reduce the overheating risk. Fig. 11 shows a cross-section of the building and the localisation and direction of the associated ventilation flows. Ventilation through the structure is associated with a night time ventilation of ambient air in the rooms.
Fig. 11: The concept of air+structure ventilation. b. Calculation method.
The Type 46 does not offer the possibility to explicitely simulate such components as "hollow core slabs" in which a ventilation can be defined UwithinU a given structure. It was therefore necessary to use a trick. The following method was selected: the slab (floor of the offices zone) was divided in two "half slabs" and the mass wall was divided in two "half walls" separated by an air gap. This gap, starting in the slab and continuing in the mass wall was defined as a fictitious thermal zone (assuming an homogeneous temperature). The heat exchange between this zone and the connected half slabs and half walls was increased by the selection of a high value (23 W/m2K) for the convection coefficient within the gap. The size of the air gap was obtained with the assumption that in a classical hollow core system, some 10% of the slab section are occupied by the ventilation ducts. Assuming a maximum flow rate of 2400 m3/h within the structure leads to an air renewal of 800 volumes/h. This correspond to an air
velocity of 3.5 m/s in the gap, which is a quite classical value in such a system [7]. The figure 12 summarizes the modelling strategy.
2400 m3/h
Half-slab Half-slab
Half-wall Half-wall
Fig. 12: Modelling strategy of the hollow core system. c. Hot wave.
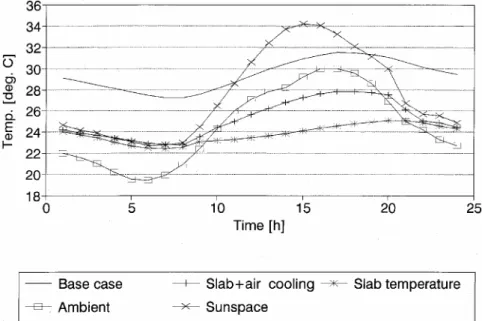
Fig. 13 shows the evolution of the different temperatures involved in this system during the hot wave period: offices temperature, slab, sunspace and ambient temperatures. Compared to the base case, only a reduction of 3°C can be observed: the air temperature still amounts to 28°C at the end of the afternoon.
Fig. 13: Different temperatures in the hollow core system. Hot wave period.
d. August 89 period.
The same effect is observed for the august 89 period. In this case, it is possible to maintain the comfort conditions without using any cooling equipment: the maximum temperature is slightly higher than 24°C at the end of the afternoon .
U6. GENERAL COMPARISON OF STRATEGIES.
In order to compare the different strategies, an integral quantity, characterizing the overheating risk has been calculated:
J T t t = − =
∑
( ( ) 24) 9 17 if T(t) >= 24°CTable 3 gives the value of the comparison criteria for the different design variations:
Strategy/period Hot wave August 89
Base case 51.9 12.9
External shutters 32.1 6.2
Internal shutters 46.1 12.6
Overhang 1m 45.7 12.1
Overhang 2m 44.0 11.3
Day time ventilation 42.6 27.0
Night time ventilation 35.3 6.4
Perfect cooling 0.0 0.0
Ventilation at 14°C 0.3 0.0
Structure ventilation 18.3 0.8
Table 3: General comparison of the different strategies
U7. CONCLUSIONS.
Summer overheating is still a problem in the FUL passive solar building. The very hot last summers made this problem really crucial and a definite solution has to be found. This paper used the simulation approach (programs MBDSA and TRNSYS) in order to test and compare several cooling strategies. From the analysis, it appears that, for not too extreme conditions, a night time ventilation of ambient air through the structures of the building could have succeeded in making the rooms comfortable during the day. The most passive devices (overhangs, shutters) have a too small effect on the overheated rooms. The placement of a cooling coil in the existing ventilation system appears as a potential solution, but of course at the price of producing some cooling energy at a quite low temperature (14°C).
[1] ANDRE, Ph.; NICOLAS, J. and B. COLSON. Thermal comfort analysis in a passive
solar building. Proceedings Conference "Building Design, Technology and Occupant
Well-Being in Temperate Climates. ASHRAE, 1993.
[2] ANDRE, Ph. Application of MBDS to a Passive Solar Commercial Building. Building Analysis Group report, University of Liège, 1989.
[3] SOLAR ENERGY LABORATORY . TRNSYS 13.1 Reference Manual. University of Wisconsin-Madison, 1990.
[4] COTTON, L.; NUSGENS, P. MBDSA User's guide. ATIC, 1990.
[5] FEUSTEL, H.; SMITH, B. COMIS 2.1 User's guide. Lawrence Berkeley Laboratory, 1995 [6] CLARKE, J.; STRACHAN, P.; HAND, J.; HENSEN, J.; PERNOT, C.; AASEM, E.
ESP-r. A Program for Building Energy Simulation Version 8 series. Passys project final
report. European Commission Joule Programme, 1993.
[7] BECKER, R. Computational Model for Analysis of Dynamic Thermal Performance of a
Hybrid Slab-collector System with Passive Discharge. Solar Energy, vol. 55, n°6, pp