HAL Id: tel-02541973
https://tel.archives-ouvertes.fr/tel-02541973
Submitted on 14 Apr 2020HAL is a multi-disciplinary open access archive for the deposit and dissemination of sci-entific research documents, whether they are pub-lished or not. The documents may come from teaching and research institutions in France or abroad, or from public or private research centers.
L’archive ouverte pluridisciplinaire HAL, est destinée au dépôt et à la diffusion de documents scientifiques de niveau recherche, publiés ou non, émanant des établissements d’enseignement et de recherche français ou étrangers, des laboratoires publics ou privés.
Molecular tagging velocimetry in rarefied and confined
gas flows
Dominique Fratantonio
To cite this version:
Dominique Fratantonio. Molecular tagging velocimetry in rarefied and confined gas flows. Mechanics of the fluids [physics.class-ph]. INSA de Toulouse, 2019. English. �NNT : 2019ISAT0027�. �tel-02541973�
A Minù, Gioacchino, Giada e Yanick.
- ♥ ♠ ♣ ♦ -
Acknowledgments
This work would have not been possible without the emotional and scientific support of many. During 3 years in Toulouse, the number of people that contributed to make me grow up in different ways is huge. If your name does not figure out in these pages, although you contributed to the occurrence of this work, forgive me. My brain has a very limited memory size and random selectivity.
Firstly, big thanks to the member of the jury, Prof. Annie Colin, Prof. Irina Graur, Prof. Salvador Montero, Prof. Gianluca Morini, and Prof. Aldo Frezzotti, for having been present at my Ph.D. defense and for having carefully read this manuscript.
Thanks to my Ph.D. and life supervisor, Stéphane Colin and Marcos Rojas-Cardenas, who have played the role of chiefs, fathers, and brothers. Chiefs, because during the development of this project, they have been able to understand when it was necessary to guide me and help me and when it was the moment to give me freedom and to give space to my personal creativity. Fathers, for being supportive and understanding in my personal (sometimes slightly dramatic) matters. Brothers, for all the laughs and the beers.
Thanks to the whole microfluidic team, for their help and friendship. Christine Barrot, Pascal Magaud, Lucien Baldas, Ahmad Batik, Batul Batik, Nicolas Laurien, Gamin, Hacene Si-Hadj Mohand, Daniel Mariuta, Thome Thome, Georges Chabouh (booob habibi mi fra), Georges Saliba, Shiqi, Jie Chien, Yan Feng, Rodrigo (yooooo man!).
Thanks to Ernane, my first office mate, who knows everything about football and the names of all possible comestible parts of animals. Our common inability to speak French and curiosity towards the unknown help us to drastically improved outselves. Cada enxadada uma miñoca, my friend.
Thanks to the whole ICA group, in particular Dong Hai, Jim, Florian, Vivien, Léonard, Fu Jiang, Iwey, Louis, Geneviève, Laure, Simon, Adama, Alexandra, Landry, Colo, Wafaa, Montassar, Amin, Ange, Yann.
Thanks to all people of the MIGRATE project for the great conference meetings and the amazing time all over Europe.
Special thanks to Prof. Stefan Stefanov and Elena Miteva for being such good hosts during my Bulgarian experience. In Sofia, I could learn a lot about DSMC, Bulgarian culture, and the art of drinking Rakija: “You need to drink in big quantities, but slowly.”
Other special thanks to M. Cedric Degouet from LaVision, for the constant assistance, for his excellent professionality and for sharing with me crucial knowledge which helped me better understanding CCD cameras and laser systems.
Thanks to the Spanish dream team, Javier, Alejandro, Samu (un giorno all’improvviso!), Lopez, Guillermo, David, for the crazy time in Toulouse and in Benicassim, and for introducing me to climbing.
Thanks to Sara Bessegato, who allowed me to experience a wide spectrum of emotions, some of which unknown to me until a couple of years ago, and who helped me knowing better myself, my qualities, and my defects. Guillermo Lopez Quesada, known as El Diablo. Crazy man and great friend. He made me be wiser and more stupid at the same time. We grew up together. Our intellectual growth spike is represented by the Tequila Suicide, a secret knowledge that all the world envies us. I will never forget all our night (hetero) adventures in Shanghai, because I have nothing to forget. I actually do not remember a thing. I still do not know where Shanghai is. It was something like l’Isla de Muerte: you cannot find it if you do not get lost both physically and spiritually. Gracias hermano.
Thanks to dude! Varun Yeachana, who has been at my side during most of the experimental work and with who I shared very good times in Sofia and Greece (with Shiqi as well!!). I saw him growing up during these 3 years, from a shy, mind-chained dude to an unleashed crazy animal party guy who now is a free man.
Thanks to Irene Lbeas, for the nightly kebab and champagne, and to Giorgios Tatsios, the reason why now I remember by heart the most important phone number, 0534674176.
Thanks to Julien Cochet, who let me discover something that I did not know was still truly existing in our times. The first time I saw him performing magic, I was speechless. I still remember that feeling of not having a clue of what just happened in front of my eyes, that mixed excitement of surprise and hope that the impossible was indeed possible in a world full of disenchanted people overwhelmed by progress and technology. Thanks to Julien, I now have the privilege of seeing again and reproducing those same feelings in the faces of all the persons to whom I perform magic tricks. The real magic happens in the eyes of the people.
Merci à Carole Dautel, femme incroyable d’une bonté sans limite. Merci pour avoir été toujours présente et prête à m’aider en cas de besoin. Tu as été comme une mère pour moi. Merci mon amie. Je te souhaite le mieux, à toi et à tes fils.
Grazie infinite Francesco De Giorgi e Silvio Akitani. Amici miei, nonostante la mia ripetutata mancata partecipazione alla vita notturna Tolosana, mi avete sempre supportato, constantemente e incondizionatamente, in qualsiasi mia scelta di vita, giusta o sbagliata che sia, come due veri fratelli. I più grandi bomber che abbia mai
incontrato, con una grande mente perversamente geniale e con un cuore ancora più grande. Grazie ragazzi, grazie altrettanto.
Thanks to Maria Giselle Fernandez, for her love and her support in the last year of my Ph.D. The writing of this manuscript has been much sweeter with her constant presence at my side. Thanks to her, I could trace the route of the next steps of my journey. Regardless of future events, she will always have a special place in my heart. Gracias de todo, mi pupi.
Finally, thanks to my always present superheroes. My mother Minù, my father Gioacchino, and my brothers, Giada and Yanick. These four magicians ♥, ♠, ♣, ♦ and their unconditional love have never stopped surprising me.
Because of all these people, now I am better scientist and a better person. Sincerely,
1
Abstract
Molecular tagging velocimetry (MTV) is an optic experimental technique widely employed for measuring the velocity field in fluid flows. The measuring principle is based on the tracking of molecules able to emit light in response to a laser excitation. By seeding the flow with this tracer, local velocity measurements can be carried out by following the displacement of the emitting molecules. While this technique has already been successfully applied in liquid and gas flows, the application to rarefied and confined gas flows is still a challenge due to the high molecular diffusion and the low emitted light from the tracer at low pressures. The interest in applying MTV in rarefied conditions derives from the absence of local experimental data that can allow a better understanding on the mechanisms of interaction between the gas molecules and the wall surface. Theoretical and numerical analysis predicted a non-zero velocity at the wall, which has been, up to now, only indirectly measured by means of global quantities, such as the mass flow rate in microchannel flows. In this work, an experimental analysis of the intensity and lifetime of the photoluminescence of the molecular tracers employed, i.e., acetone and diacetyl, is presented. This study revealed the importance of the triplet-triplet annihilation phenomenon in determining the observed phosphorescence decay. Moreover, this analysis allowed to estimate the best working conditions for applying MTV to rarefied gas flows. Thus, MTV has been applied to gas-tracer mixtures at low pressures in a millimetric rectangular channel producing the first gas flow visualizations in the slip flow regime and the first preliminary measurements of the slip velocity at the wall.
Keywords: Molecular tagging velocimetry, rarefied gas flows, slip velocity, acetone, diacetyl, phosphorescence, molecular diffusion, DSMC, triplet-triplet annihilation.
1
Résumé
Le marquage moléculaire est une technique expérimentale permettant d’effectuer de manière peu intrusive de la vélocimétrie au sein des écoulements. La mesure est basée sur le suivi de molécules capable d’émettre de la lumière suite à une excitation par une source laser. La mesure locale de vitesse est alors déduite de la visualisation du déplacement des molécules traceuses. Bien que la vélocimétrie par marquage moléculaire (MTV) ait déjà été utilisée avec succès pour des écoulements liquides ou gazeux, son application à des écoulements gazeux raréfiés internes reste encore un défi en raison de la diffusion moléculaire élevée et de la faiblesse de l’émission lumineuse à basse pression. Néanmoins, pouvoir appliquer la MTV en condition de gaz raréfié est particulièrement intéressant du fait du manque de données expérimentales locales nécessaires à une meilleure compréhension des mécanismes d’interaction moléculaire entre le gaz et une surface solide. Les analyses théoriques et numériques mettent en évidence une vitesse non nulle à paroi, qui, jusqu’à maintenant, a pu être quantifiée expérimentalement uniquement de manière indirecte, par des mesures de quantités globales telles que le débit massique à travers des microcanaux. Dans ce travail, une étude expérimentale a été menée sur l’intensité et le temps de vie de la photoluminescence des traceurs moléculaires utilisés, à savoir l’acétone et le diacétyle vapeurs. Cette étude a démontré l’importance du processus d’annihilation triplet-triplet sur l’émission phosphorescente expérimentalement observée. En outre, cette analyse a permis d’estimer les conditions expérimentales optimales pour l’application de la MTV aux gaz raréfiés. Ainsi, la MTV a été appliquée à des écoulements de mélanges gaz-traceur à basses pressions dans un canal millimétrique de section rectangulaire, fournissant ainsi les premiers résultats de vélocimétrie en régime d’écoulement légèrement raréfié.
Mots clés: Vélocimétrie par marquage moléculaire, écoulements gazeux raréfiés, acétone, diacétyle, phosphorescence, DSMC, annihilation triplet-triplet.
Table of Contents
Chapter 1: Introduction ... 1
1.1 MEMS technology ... 1
1.2 Microfluidic systems in MEMS ... 3
1.3 Scale effects at the microscale ... 7
1.4 Gas microflows ... 8
1.5 The objective of the work ... 9
1.6 Organization and contributions of the thesis ... 11
Chapter 2: Mathematical models for rarefied gas flows ... 16
2.1 Dilute gas ... 16
2.2 Fluctuations on the macroscopic properties ... 19
2.3 Intermolecular collisions ... 20
2.4 Gas-surface collisions ... 22
2.5 Rarefaction regimes ... 23
i. Continuum regime ... 24
ii. Slip flow regime ... 25
iii. Transitional regime ... 26
iv. Free molecular regime ... 29
2.6 Analytical solution of gas flows in microchannels ... 29
2.6.1 Discussion on hypotheses ... 31
i. Ideal and Newtonian gas ... 31
ii. Stationary flow ... 31
iii. Laminar flow ... 32
iv. One-directional flow... 32
v. Local incompressibility ... 34
vi. Isothermal flow ... 35
vii. Locally, fully developed flow ... 37
2.6.2 Analytical solution of slip flow in parallel plates ... 39
2.6.3 Analytical solution of slip flow in a rectangular channel ... 42
2.6.4 Compressible and rarefaction effects on pressure distribution ... 46
Chapter 3: Experimental techniques for rarefied gas flows ... 57
3.1 Pressure sensors ... 58
3.1.1 Diaphragm-based piezo-resistive pressure sensors ... 59
3.1.2 Diaphragm-based capacitive pressure sensors ... 60
3.1.3 Diaphragm-based optical pressure sensors ... 61
3.1.4 Diaphragm-based resonant pressure sensors ... 61
3.1.5 Thermal pressure sensors ... 62
3.2 Temperature sensors ... 63
3.2.1 Resistance temperature detectors (RTD) ... 64
3.2.2 Semiconducting sensors (SC) ... 64
3.2.3 Thin film thermocouples (TFTC) ... 64
3.3 Mass flow rate measurements ... 65
3.3.1 Liquid-droplet tracking technique ... 67
3.3.2 Constant pressure technique ... 69
3.3.3 Constant volume technique ... 71
3.4 Optical techniques in gas flows ... 74
3.4.1 Optical pressure measurements ... 77
i. Pressure-sensitive paints (PSP) ... 77
ii. Molecular tagging manometry (MTM) ... 80
3.4.2 Optical temperature measurements ... 83
i. Temperature-sensitive paints (TSP) ... 83
ii. Molecular tagging thermometry (MTT) ... 84
3.4.3 Local velocity measurements ... 87
i. Particle image velocimetry (PIV) ... 87
ii. Laser-Doppler anemometry (LDA) ... 91
iii. Molecular tagging velocimetry (MTV) ... 92
3.5 Conclusions ... 97
Chapter 4: Experimental techniques setup ... 105
4.1 Absorption and emission spectra of tracers ... 105
4.2 Laser system ... 107
4.2.1 Nd:YAG Quantel Twins laser ... 109
4.2.2 OPOlette laser ... 110
4.2.3 Optics for laser beam focusing ... 112
4.3 Acquisition system ... 117
4.3.1 Internal structure of the ICCD ... 118
i. External objectives ... 119
ii. The photocathode ... 122
iii. The MCP ... 124
iv. The phosphor plate ... 125
v. The internal optical collector ... 126
vi. The charged-couple device (CCD) ... 126
vii. Digitalization of the charges ... 127
4.3.2 ICCD sensitivity ... 127
4.3.3 The on-chip integration technique ... 130
4.3.4 Instrumental uncertainties of ICCD ... 132
i. Photocathode shot noise ... 133
ii. CCD dark noise ... 133
iii. Photocathode dark noise ... 134
iv. Readout noise ... 134
4.3.5 Magnification, focusing distance and depth of focus ... 136
4.3.6 Binning ... 137
4.3.7 Signal intensity with IRO gate and 𝑁𝑙 ... 139
4.4 Gas system ... 140
4.4.1 Experimental setup for photoluminescence analysis ... 141
4.4.2 Experimental setup for MTV and CV techniques at low pressures ... 144
4.4.3 Pressure sensors ... 156
4.5 Conclusions ... 157
Chapter 5: Experimental analysis on acetone and diacetyl phosphorescence ... 158
5.1 Motivation of this experimental analysis ... 158
5.1.1 Digital spatial resolution: the CCD and the optical system ... 159
5.1.2 Uncertainty on the tagged line position ... 159
5.2 Intramolecular processes in photoluminescence phenomena ... 161
5.2.1 Radiative and non-radiative de-excitations ... 163
5.2.2 The Beer-Lambert law ... 170
5.2.3 Singlet and triplet lifetime ... 171
5.2.4 Literature data on radiative and non-radiative rates ... 174
5.3.1 Digital spatial resolution: the CCD and the optical system ... 179
5.3.2 Signal transformation for different IRO gains ... 182
5.3.3 Average laser energy density ... 183
5.3.4 Acetone emission at 266 nm ... 185
5.3.5 Optimization of the phosphorescence intensity with the excitation wavelength ... 189
5.3.6 Phosphorescence emission of pure tracers at low pressure ... 193
5.3.7 Phosphorescence emission of acetone and diacetyl in helium mixture ... 193
5.3.8 Statistical analysis on Gaussian peak position ... 196
5.4 Quantification of phosphorescence lifetime and molecular diffusion ... 199
5.4.1 Image processing procedure ... 202
5.4.2 Experimental data on TL and 𝜎𝑥2 ... 204
5.4.3 The triplet-triplet annihilation (TTA) ... 209
5.4.4 Parameter identification of 𝑘𝑇𝑇𝐴 and 𝐷 ... 211
5.4.5 Numerical calculation of TL and 𝜎𝑥2 ... 213
5.4.6 Results of the parameter identification ... 215
5.5 Conclusions ... 217
Chapter 6: Application of MTV to gas flows in the slip regime ... 221
6.1 Feasibility analysis of MTV application to gas flows in the slip regime ... 221
6.1.1 Calculation of binary gas mixture properties ... 222
6.1.2 Generation of numerical experiments by DSMC simulations ... 223
6.1.3 Definition of the test case ... 224
6.1.4 Numerical experiment analysis ... 224
6.1.5 Advection-diffusion equation for the displacement profile ... 228
6.1.6 Velocity reconstruction method... 230
6.1.7 Evolution of the diffusion coefficient ... 232
6.1.8 Application of the reconstruction method to numerical experiments ... 236
6.1.9 Sensitivity of the reconstructed velocity to 𝐷12 ... 238
6.1.10 The time-correlation (TC) reconstruction method ... 240
6.1.11 Taylor dispersion and theoretical maximum velocity slip ... 242
6.2 Experimental flow conditions ... 244
6.2.1 Repeatability of the experimental conditions ... 247
6.2.2 Minor head losses ... 248
6.2.3 Dynamic-constant volume technique ... 249
6.2.4 Thermodynamic conditions along the channel ... 254
6.2.6 Velocity profile stability for MTV application ... 260
6.3 Molecular tagging velocimetry ... 262
6.3.1 Post-processing procedure ... 264
6.3.2 MTV application to argon-acetone flows in non-rarefied conditions... 278
6.3.3 MTV application to helium-acetone flows in the slip regime ... 286
6.4 Conclusions ... 292
Chapter 7: Conclusions and perspectives ... 297
Appendix A... 303
Appendix B ... 307
Appendix C... 313
Roman letters
𝐴 Area of the channel section [m2]
𝐴𝜃 Langmuir adsorption equation coefficient [-]
𝐴𝑛,𝑚 Fourier coefficients for 2D velocity profile [-]
𝑎 Channel aspect ratio [-]
𝑎𝑖 Fitting coefficients [-]
𝐵 Coefficient [-]
𝑏 Channel width [m]
𝐴𝑎𝑑𝑠, 𝐵𝑎𝑑𝑠 Calibration coefficients for PSMF [-]
𝐶1, 𝐶2 Slip velocity boundary condition coefficients [-]
𝐶𝑓 Friction coefficient [-]
𝐶𝐼𝐶𝐶𝐷 Gain conversion coefficient [-]
𝑐 Speed of light [m s-1]
𝒄̅ Mean gas velocity [m s-1]
𝒄 Molecular velocity vector [m s-1]
𝒄𝑟 Relative molecular velocity [m s-1]
𝑐̅ ′ Mean thermal speed [m s-1]
𝑐𝑖 Polynomial coefficient of pressure distribution [-]
𝑐𝐶 High-order slip boundary condition coefficient [-]
𝑐𝑠 Speed of sound [m/s]
𝑐𝑝 Specific heat at constant pressure [J kg-1 K-1]
𝑐𝑉 Specific heat at constant volume [J kg-1 K-1]
𝐷 Diffusion coefficient [m2 s-1]
𝐷𝑖𝑖 Self-diffusion coefficient [m2 s-1]
𝐷𝑖𝑗 Mutual-diffusion coefficient [m2 s-1]
𝐷𝑒𝑓𝑓 Effective diffusion coefficient [m2 s-1]
𝐷𝑙 Laser beam diameter (FWHM) [m]
𝐷ℎ Hydraulic diameter [m]
𝐷𝑜,1 Primary Nikkor objective aperture [m]
𝐷𝑜,2 Secondary Nikkor objective aperture [m]
𝐷𝑝 Diameter of gas circuit component [m]
𝑑 Molecular diameter [m]
𝑑𝑐𝑦𝑙 Cylinder diameter [m]
𝑑𝑜,1 Distance between the two objective lenses [m]
𝑑𝑜,2 Distance between the lens and the photocathode [m]
𝑑𝑝𝑖𝑝 Pipette diameter [m]
𝐸𝑝ℎ Photon energy [J]
𝐸𝑙 Average laser energy [J]
𝐸𝑆0 Energy level in the ground singlet state [J]
𝐸𝑆0−0 Lowest energy level in the ground singlet state [J]
∆𝐸𝑡ℎ𝑒𝑟𝑚𝑎𝑙 Thermal energy stored in roto-vibrational modes [J]
𝐹 Force [N]
𝐹𝑉 Volume force [N]
𝐹𝑆 Surface force [N]
𝑓 Lens focal length [m]
𝑓1 Primary Nikkor objective focal length [m]
𝑓2 Secondary Nikkor objective focal length [m]
𝑓/# f-number of a lens [-]
𝑓𝑙 Focal length of the focusing lens [m]
𝑓𝑤 Wall function for high-order slip boundary condition [-]
𝐺 IRO gain [-]
𝑔 Input signal to a linear system [-]
𝐻 Channel height [m]
𝐻𝑀𝑇𝑉 Channel height used for velocity reconstruction [m]
ℎ Plank constant [-]
𝐼0 Initial emission rate [ph s-1]
𝐼𝑖𝑛 Laser energy density [ph m-2]
𝐼𝑓 Fluorescence emission rate [ph s-1]
𝐼𝑝ℎ Phosphorescence emission rate [ph s-1]
𝑱 Diffusive flux [m-2 s-1]
𝐽𝑖𝑛 Laser irradiance [J m-2s-1]
𝐾𝑄 Quenching rate constant [s-1]
𝐾𝑐 Head losses due to sudden section contraction [-]
𝐾𝑒 Head losses due to sudden section expansion [-]
𝑘𝐵 Boltzmann constant [m2 kg s-2 K-1]
𝑘𝑓 Fluorescence emission rate constant [s-1]
𝑘𝑝ℎ,𝑡𝑜𝑡 Radiative and internal non-radiative processes rate constant [s-1]
𝑘𝑇𝑇𝐴 Triplet-triplet annihilation rate constant [m3 s-1]
𝑘𝐼𝑆𝐶 Intersystem crossing rate constant [s-1]
𝑘𝑟 Radiative de-excitation rate constant [s-1]
𝑘𝑛𝑟 Non-radiative de-excitation rate constant [s-1]
𝑘𝑛𝑟,𝑇1 Internal non-radiative rate constant in the triplet state [s
-1]
𝑘𝑣𝑟 Vibrational-relaxation rate constant [s-1]
𝑘𝑄 Quenching rate constant per quencher molecule density [m3 s-1]
𝑘𝜆 Mean free path coefficient [-]
𝐿 Channel length [m]
𝐿𝑜 Image on the focal plane of the objectives [m]
𝐿′𝑜 Image on the focal plane of the objectives [m]
𝐿𝑐 Characteristic length [m]
𝐿𝑥, 𝐿𝑦 Field of view dimensions [m]
𝐿𝑝 Length of gas circuit component [m]
Δ𝑙 Displacement [m]
ℓ Optical length of medium [m]
𝑀 Molar mass [kg mol-1]
𝑀2 M square of the laser beam [-]
𝑚 Molecular mass [kg]
𝑚𝑏 Mass of the empty bottle [kg]
𝑚𝑏,𝐻2𝑂 Mass of the bottle filled with water [kg]
𝑚𝑔 Mass of gas [kg]
𝑚̇ Mass flow rate [kg s-1]
𝑚𝑒 Magnification factor of the external optics [-]
𝑚𝐼𝐶𝐶𝐷 Total magnification factor of ICCD [-]
𝑚𝑖 Magnification factor of the internal optics [-]
𝑁 Number of molecules [-]
𝑁𝑆1 Number of singlet molecules [-]
𝑁𝑇1 Number of triplet molecules [-]
𝑁𝑐 Number of counts [-]
𝑁𝑐𝑜𝑙𝑙 Number of collisions [-]
𝑁𝑒𝑥 Number of excited molecules [-]
𝑁𝑖 Number of averaged images [-]
𝑁𝑙 Number of laser pulses per image [-]
𝑁𝑛,𝑚 Fourier coefficients for 2D velocity profile [-]
𝑁𝑝ℎ Number of photons [-]
𝑁𝑣 Number of vibrational modes [-]
𝑛 Molecular density [m-3]
𝑛𝑒𝑥 Molecular density of excited molecules [m-3]
𝑛𝑄 Molecular density of quenching species [m-3]
𝑛𝑆1 Molecular density of singlet molecules [m
-3]
𝑛𝑇1 Molecular density of triplet molecules [m-3]
𝑛𝑇1,𝑦 Number of triplet molecules per unit length [m
-1]
𝑃 Perimeter of the channel section [m]
𝑝 Pressure [Pa]
𝑝𝑖𝑛 Inlet pressure [Pa]
𝑝𝑜𝑢𝑡 Outlet pressure [Pa]
Δ𝑝 Inlet-outlet pressure difference [Pa]
Δ𝑝𝑐 Head losses due to sudden section contraction [Pa]
Δ𝑝𝑒 Head losses due to sudden section expansion [Pa]
Δ𝑝𝑑 Distributed head losses [Pa]
𝑝1, 𝑝2, 𝑝3, 𝑝4 Pressure from sensor 1, 2, 3, and 4 [Pa]
𝑝𝑐 Pressure at the central section along the channel length [Pa]
𝑝𝑐𝑟 Critical pressure [Pa]
〈𝑝𝑄〉 Probability of molecular quenching [-]
〈𝑝𝑣𝑟〉 Probability of vibrational-relaxation [-]
𝑄𝐶𝐶𝐷 Quantum efficiency of the CCD [-]
𝑄𝑒 Quantum efficiency of IRO photocathode [-]
𝑞𝑝 Heat power [W]
𝑅 Radius [m]
𝑅𝑠 Specific ideal gas constant [J kg-1 K-1]
𝑅𝑢𝑛𝑖𝑣 Universal ideal gas constant [J K-1 mol-1]
𝑟 Radial distance [m]
𝑟𝑤 Laser beam waist [m]
𝑆 Signal intensity [-]
𝑆0 Ground singlet state [-]
𝑆1 First excited singlet state [-]
𝑆2 Second excited singlet state [-]
𝑆𝑓 Total fluorescence light emitted [-]
𝑆𝑝ℎ Total phosphorescence light emitted [-]
𝑆𝑔𝑝 Gaussian peak intensity [-]
𝑆𝐼𝐶𝐶𝐷 ICCD sensitivity [-]
𝑆𝑥,𝑖 Displacement basis functions for velocity reconstruction [m]
𝑠𝑥 Displacement profile function [m]
𝑠𝑥,𝑗 Displacement data [m]
Δ𝑠𝑥 Displacement profile thickness [m]
Δ𝑠∞ Asymptotic displacement profile thickness [m]
𝑇 Temperature [K]
𝑇𝑐𝑟 Critical temperature [K]
𝑇1 Triplet state [-]
𝑡 Time [s]
𝑡𝐶𝐶𝐷 Exposure time of the CCD [s]
Δ𝑡 Time interval [s]
Δ𝑡𝑔𝑎𝑡𝑒 IRO gate [s]
𝑢, 𝑣, 𝑤 Velocity components [m s-1]
𝑈𝑖 Velocity basis functions for velocity reconstruction [m s-1]
𝒖 Gas velocity vector [m s-1]
𝑢̅ Mean velocity [m s-1]
𝑢𝑐𝑝 Centerline Poiseuille axial velocity [m s-1]
𝑢𝑠𝑙𝑖𝑝 Slip velocity [m s-1]
𝑢𝐷𝑆𝑀𝐶 Velocity profile computed by DSMC [m s-1]
𝑢2𝐷 Velocity distribution on a cross-section [m s-1]
𝑢𝑧 Velocity profile at position z along the channel width [m s-1]
𝑢̅𝐶𝑉 Average of the velocity profile measured by CV [m s-1]
𝑢̅𝑀𝑇𝑉 Average of the velocity profile measured by MTV [m s-1]
𝑢𝑠𝑙𝑖𝑝,𝐶𝑉 Slip velocity estimated by CV [m s-1]
𝑉 Volume [m3]
𝑉̇ Volume flow rate [m3 s-1]
𝑉𝑏 Bottle or balloon volume [m3]
𝑉𝑇1 Tank T1 volume [m3]
𝑉𝑇2 Tank T2 volume [m3]
𝑉𝐷 Downstream volume [m3]
𝑥, 𝑦, 𝑧 Spatial coordinates [m]
𝑦𝑡, 𝑦𝑏 Top and bottom wall position on the image [m]
𝑦𝑐 Position of the channel centerline on the image [m]
𝑥𝑑 Hydrodynamic development length [m]
Greek letters
𝛼 Angle [rad]
𝛼1 Half-angle of the primary objective aperture [rad]
𝛽𝑢1 Correction factor on slip velocity [-]
Γ𝑆 Spin multiplicity [-]
𝛾 Ratio of the specific heats [-]
𝛿 Molecular mean space [m]
𝛼𝑖, 𝛽̅𝑚, 𝛿̅𝑛 Eigenvalues [-]
𝜖 Height-to-length ratio / thermal fluctuations error [-]
𝜀 Error [-]
𝜀𝑣𝑘 Cumulative error on velocity reconstruction [-]
𝜀𝑟𝑘 Local relative error on velocity reconstruction [-]
𝜀𝑇𝐿, 𝜀𝜎𝑥2, 𝜀𝑠
𝑥, 𝜀2𝐷 Objective functions for optimization algorithms [-]
𝜁 Second viscosity coefficient [Pa s]
𝜂 Coefficient of IPL collisional model [-]
𝜂𝑝 Efficiency conversion of photodetector [-]
𝜂𝑜 Fraction of collected light by external optics [-]
𝜂𝐼𝐶𝐶𝐷 ICCD Efficiency conversion [-]
𝜗 Laser divergence half-angle [rad]
𝜃 Percentage of vapor saturation [-]
𝜅𝑜 High-order slip boundary condition coefficient [-]
𝚲 Matrix of displacement basis functions
𝜆 Mean free path [m]
𝜆𝑒 Wavelength of emitted photon [m]
𝜇 Dynamic viscosity [Pa s]
𝜇𝑒− Average value of emitted electrons [-]
𝜇𝑁 Average number of molecules [-]
𝜇𝑅𝑂𝑁 Average read out noise [-]
𝜇𝑟 Radial mean position of light distribution [m]
𝜈, 𝜈𝑟𝑎𝑡𝑒 Collisional frequency [s-1]
𝜈𝑖 Vibrational frequency [s-1]
𝜈𝑒 Frequency of emitted photon [s-1]
𝜈𝑒𝑥 Laser excitation frequency [s-1]
𝜙 Quantum yield [-]
𝜙0 Quantum yield without quenching [-]
𝜙𝑓 Fluorescence quantum yield [-]
𝜙𝑝ℎ Phosphorescence quantum yield [-]
𝜙𝐼𝑆𝐶 Intersystem crossing quantum yield [-]
𝜙̃ Compressibility coefficient in pressure distribution [-]
Π Inlet-outlet pressure ratio [-]
𝜌 Gas density [kg m-3]
𝜌𝐻2𝑂 Liquid water density [kg m
-3]
𝜎 Tangential accommodation coefficient [-]
𝜎𝑎𝑏𝑠 Absorption cross-section [m2]
𝜎𝑑𝑎𝑟𝑘 Standard deviation of CCD dark noise [-]
𝜎𝑒− Standard deviation of shot noise [-]
𝜎𝐸𝑙 Standard deviation of average laser energy [J]
𝜎𝐼𝐶𝐶𝐷 ICCD standard deviation on counts [-]
𝜎𝑄 Standard deviation of quantization error [-]
𝜎𝑠ℎ𝑜𝑡 Standard deviation of shot noise in counts [-]
𝜎𝑟 Standard deviation of axisymmetric distribution [m]
𝜎𝑇 Total collision cross section [m2]
𝜎𝑉𝑅 Standard deviation on reservoir volume [m
3]
𝜎𝑉𝑇1 Standard deviation on tank T1 volume [m
3]
𝜎𝑉𝑇2 Standard deviation on tank T2 volume [m3]
𝜎𝑥, 𝜎𝑦, 𝜎𝑧 Standard deviation in the direction x, y, and z [m]
𝜎̂2 FWHM of Lorentzian distribution [m]
𝜏0 Emission lifetime without quenching [s]
𝜏𝑓𝑙𝑢𝑖𝑑 Characteristic time of the fluid flow [s]
𝜏𝑓 Characteristic time of fluorescence emission [s]
𝜏𝑝ℎ Characteristic time of phosphorescence emission [s]
𝜏𝐼𝑆𝐶 Characteristic time of intersystem crossing [s]
𝜏𝑆1 Singlet lifetime [s]
𝜏𝑇1 Triplet lifetime [s]
𝜏𝑝−𝑃𝐼𝑉 Characteristic time of accelerating particle [s]
𝜏̅𝑤 Mean shear stress at the wall [Pa]
𝜒 Tracer molecular concentration [-]
𝜒̃ Momentum-flux integral [-]
Ψ𝑖 Base functions for velocity distribution [-]
Ω Solid angle of the primary objective [sr]
Ω𝑖 Coefficients for 2D velocity profile [-]
𝜔 Coefficient of IPL collisional model [-]
Non-dimensional number
𝑃𝑟 Prandtl number 𝐾𝑛 Knudsen number 𝑅𝑒 Reynolds number 𝑀𝑎 Mach numberSubscripts
𝐴𝑐 Acetone 𝐴𝑟 Argon 𝐷𝑖 Diacetyl 𝐻𝑒 Helium 𝑒𝑞 Equilibrium𝑛 Unit vector normal to the wall
𝑠 Unit vector tangential to the wall
𝑤 Wall
𝑐𝑟 Critical
𝑖𝑛 Channel inlet
𝑜𝑢𝑡 Channel outlet
𝑝𝑙𝑎𝑛𝑒, ns Parallel plates with no-slip boundary condition 𝑝𝑙𝑎𝑛𝑒, S1 Parallel plates with first-order boundary condition 𝑝𝑙𝑎𝑛𝑒, S2 Parallel plates with second-order boundary condition
𝑟𝑒𝑐𝑡, S1 Rectangular channel with first-order boundary condition 𝑟𝑒𝑐𝑡, S2 Rectangular channel with second-order boundary condition
Acronyms
AR Anti-reflective
BGK Bhatnagar-Gross-Krook-Burnett
BPP Beam product parameter
CCD Charge-coupled device
DDS Drug delivery systems
DOF Depth of focus
DRIE Deep reactive-ion etching
DSMC Direct Simulation Monte Carlo
EDM Electro discharge machining
FACS Fluorescent activated cell sorting
FOV Field of view
FP Fabry-Periot
FWHM Full width at half-maximum
HTV Hydroxyl tagging velocimetry
IC Integrated circuits
ICCD Intensified CCD
IRO Intensifier relay optics
LB Lattice Boltzmann or Langmuir-Blodgett
LDA Laser-doppler anemometry
LIF Laser-induced fluorescence
LIGA Lithographie Galvanoformung Abformung
LIP Laser-induced phosphorescence
LIPA Laser-induced photochemical anemometry
MCP Micro-channel plate
MEMS Micro-electro-mechanical systems
MT Molecular tagging
MTM Molecular tagging manometry
MTT Molecular tagging thermometry
MTV Molecular tagging velocimetry
NTV Nitric oxide tagging velocimetry
OTV Ozone tagging velocimetry
PHANTOMM Photoactivated non-intrusive tracing of molecular motion
PIV Particle image velocimetry
PMV Pattern matching velocimetry
PSMF Pressure sensitive molecular film
PSP Pressure sensitive paint
PTU Programmable timing unit
RBC Red blood cells
RELIEF Raman excitation plus laser-induced electronic fluorescence
RTD Resistance temperature detector
SC Semiconductor
SNR Signal-to-noise ratio
TCR Temperature coefficient of resistance
TFTC Thin-film thermocouple
TL Total light
TMAC Tangential accommodation coefficient
TSP Temperature sensitive paint
TTA Triplet-triplet annihilation
1
Chapter 1
Introduction
In this first chapter, a brief introduction on MEMS technology and on the development of microfabrication techniques is presented. A section is dedicated to microfluidic devices and their wide applications to scientific and commercial fields. At microscales, the physical behavior of microsystems is dominated by surface effects and new micro-effects appear. The concept of gas rarefaction is introduced, along with its macroscopic influences on the gas dynamics. The necessity of new experimental data for better understanding these microscale phenomena is pointed out. Finally, the objectives and contributions of this work are defined and inserted inside this context, and the organization of this document is described.
1.1
MEMS technology
During the second half of the XX century, the development of solid-state electronics kept improving the manufacturing techniques, which were able to produce electric components of submicrometric size. However, integrated circuits (IC) could not communicate with the external environment, for which integrated sensors and actuators were necessary. It is from this idea of providing “eyes” and “arms” to the IC that the concept of micro-electro-mechanical systems (MEMS) was born. MEMS are microdevices that integrate electrical components and mechanical components. However, the early micromachining techniques could only fabricate mechanical parts with dimensions around the sub-millimeter, i.e., with sizes definitely bigger than the electrical parts. In the 1980s, a new fabrication technique, named surface manufacturing, was proposed by Howe and Muller (1983), which could be used to fabricate micron-sized mechanical devices with complex geometries from polycrystalline silicon (poly-Si). As the development of new microfabrication techniques made the design of MEMS possible, the practical interest and the scientific inquiry on these systems quickly increased in the last decades. MEMS have received a lot of attention due to their appealing properties of low volume, low weight, low energy consumption, and system integration.
Their possible applications cover a very wide spectrum of fields. There are many examples of MEMS that found a commercial application and that are present in many of our daily life utilities. Great examples are the micro-accelerometers employed in the airbag systems in cars or in most nowadays smartphones. These microsensors are usually constituted of a comb-drive structure, which was first developed by Tang et al. (1992). Figure 1.1 shows a typical electrostatic comb-drive mechanism with typical dimensions on the order of 100 µm. The moving comb is sustained by a cantilever beam that allows it to move horizontally. The acceleration is measured from the variation of capacitance due to the motion of the moving fingers with respect to the static fingers. The same
2
microstructure and principle can be employed in micro-gyroscopes (Acar & Shkel, 2005, Pyatishev et al., 2017) and micro-actuators (Hirano et al., 1992).
(a) (b)
Figure 1.1. (a) Diagram of the typical comb-drive structure and typical dimensions; (b) actual electrostatic comb-drive. Figure from Karniadakis et al. (2006).
In these electrostatic actuators, the driving force is inversely proportional to the size of the gap between the static comb and the moving comb. Since the common lithography and etching systems on usual poly-Si do not have the required precision for making submicron gaps, Hirano et al. (1992) applied an alternative fabrication technique named oxidation machining, proposed by Furuhata et al. (1991). This new technique allowed to produce sub-micron gaps between the electrodes by means of thermal oxidation of the poly-Si, without the necessity of employing the limited etching capability.
The micromanufacturing techniques have seen in the past years a development and an adaptation to the increased demanding of miniaturization along with fabrication precision. Other microfabrication techniques are bulk silicon micromachining, LIGA (Lithographie Galvanoformung Abformung) and EDM (Electro Discharge Machining). Starting from the manufacturing techniques of the semiconductor industries based on silicon or glass materials, polymer/plastic-based microdevices were afterward introduced because cheaper and easier to be machined. The comb-drive accelerometer is also a good example of mixed domain system. The frequency response analysis of the system requires a correct calculation of the damping force on the comb oscillation, which is mainly due to the viscous forces of the air lying between the comb gaps. MEMS are multidisciplinary systems and, therefore,
3
scientific research from different fields need to interact in order to control and predict the behavior of these microdevices.
1.2
Microfluidic systems in MEMS
There is a group of MEMS where the sensing and the actuation are made through microfluidic systems. Microfluidic devices have an important role as they appear in a wide variety of application fields. Microchannels, microvalves, micropumps, micro-heat exchangers, micro-separators, micromixers, and micro-actuators are possible microfluidic elements that can be found in MEMS.
Figure 1.2 shows two different examples of micropumps: the first one is a peristaltic micropump and the second one is an example of the so-called Knudsen pump.
The peristaltic micropump functioning is based on gas compression produced by means of variations of the gas volume. A combination of microvalves and activated membranes can produce this effect. Jeong et al. (2005) fabricated a peristaltic micropump with polydimethylsiloxane (PDMS) elastomer on a glass substrate. The membrane is driven by microheaters that heat the gas from one side of the membrane. The heating of a cavity can provide a fast gas expansion able to drive the membrane in a controlled way. Since the volume of gas to be heated for activating the membranes is very small, the heating-cooling cycle can be very fast and can quickly follow an electrical trigger.
Figure 1.2b compares a dime with a 48-stage Knudsen micropump fabricated at the University of Michigan (Gupta
et al., 2012). The single silicon wafer pump is constituted by narrow channels with a height of 0.15 µm and
monolithically integrates several Pirani gauges (Chae et al., 2005) for the experimental analysis of the pump characteristics. In comparison with the peristaltic pump, the Knudsen pump does not require any moving part. The driving force of a Knudsen pump is based on the thermal transpiration effect: a thermal gradient imposed along the wall of the narrow channels constituting the micro-system generates a gas flow in the direction of increasing temperature. This phenomenon becomes relevant only when the gas is at specific rarefied conditions. Even though the mass flow rates generated by thermal transpiration is very small and on the orders of 10-13 kg/s, it has been experimentally demonstrated that a multi-stage Knudsen pump can create a pressure drop of 100 kPa.
4
(a) (b)
Figure 1.2. (a) A peristaltic micropump (Jeong et al., 2005) and (b) a Knudsen micropump (Gupta et al., 2012).
Microfluidic devices are very important for fluid transport and cells analysis in the biomedical field. Drug delivery systems (DDS) based on MEMS can move and control a specific amount of drug with high precision. MEMS technology provides medical instruments less invasive than the conventional ones, such as micro-endoscopes and endoscope capsules for the gastrointestinal tract (Munoz et al., 2014), and micro-needles array for controlled drug delivery. These technological advances reduce the pain and possible tissue damage on patients. Moreover, there are some areas of the body that are quite challenging sites for drug delivery. The intravenous administration of drugs for treating some neurodegenerative diseases, such as the Alzheimer and brain tumors, is a therapy made inefficient by the physical barrier separating the brain organ from the blood circulation. MEMS technology may overcome this problem by targeting these sites through localized drug delivery systems, but many challenges remain to be solved, e.g., biocompatibility and implantation problems (Lee et al., 2018).
Lab-on-a-chip devices for cells analysis represent another important example of microfluidic devices application in the biomedical field. Figure 1.3 shows two examples of cells sorting strategies: the micro magnetic activated cells sorting (µMACS) and the micro fluorescent activated cells sorting (µFACS). In µMACS, cells from a sample are labeled with paramagnetic microparticles and are guided in a channel by means of two buffer streams. The channel can have a diameter of 100 µm, with cells of 5-10 µm. A permanent magnet induces the labeled cells to migrate toward the collecting outlet. In µFACS, cells are labeled with fluorescent particles. An optic sensor opens a valve when the labeled cells are detected through the main stream in the channel. Since a residual amount of non-labeled cells always pass through the collecting outlet, a series of additional µFACS is necessary to make a complete separation of the cells of interest from the rest of the group cells.
5
(a) (b)
Figure 1.3. Schematization of the labeling cells sorting techniques: (a) µMACS and (b) µFACS. Figures from Telleman et al. (1998).
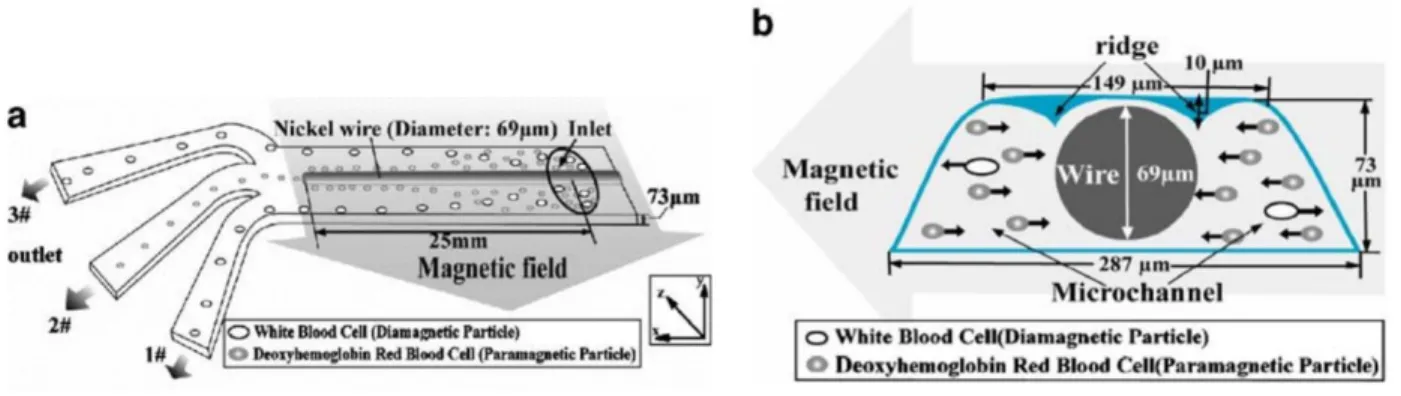
Qu et al. (2008) applied the same principle of µMACS but without any cells labeling. In this work, a glass microfluidic chip exploits the native magnetic properties of red blood cells (RBC) for making a continuous sorting. A nickel wire with a diameter of 69 µm is introduced in a trapezoidal channel with a 149-µm top width, a 287-µm bottom width, and a depth of 73 µm. By means of an external magnetic field, the nickel wire produces a magnetic gradient that attracts RBC, which paramagnetic properties derive from the deoxyhemoglobin, and rejects white blood cells, which are diamagnetic (Figure 1.4).
Figure 1.4. Schematic representation of the microfluidic chip for RBC sorting designed by Qu et al. (2008): (a) structure of the overall system; (b) section of the microchannel of the chip. Figures readapted from Qu et al. (2008).
In the aeronautical sector, microfluidic actuators are interesting devices for the active control of the flow separation on aerodynamic surfaces and of high-speed jet noise (Cattafesta et al., 2011). Synthetic pulsed microjets are an example of active microfluidic actuation that can be employed for boundary layer control (Lee et al., 2003). In these devices, a membrane, which can be activated electrodynamically or by means of a piezoelectric, oscillates for generating through a small channel or an orifice a zero-net mass flow with a non-zero average velocity (Figure
6
1.5a). In the literature, synthetic pulsed microjets have been fabricated with orifice diameters of about 150 µm (Coe et al., 1995). However, the real application of these microdevices for active flow control on civil transport airplanes is prevented by the strong noise induced by the membrane vibration (Jabbal et al., 2010) and by the considerable cost in terms of weight that the corresponding power transmission system would require (Batikh et
al., 2017). Synthetic pulsed microjets found, instead, a real application in the informatics industry, being already
commercialized as cooling devices (Synjet®) for electronic components.
Fluidic oscillators are passive actuators that can generate a sweeping jet when supplied with a pressurized fluid. The fact that compressed air is already available on an airplane makes this type of actuators interesting for aeronautical applications. The very interesting aspect of these systems is the absence of moving parts, which is a great advantage both from a fabrication and a reliability point of view. The sketch of the fluidic oscillator in Figure 1.5b is a good representation of the Coanda effect (Coanda, 1936), which is the main mechanism that generates an oscillatory jet at the device outlet. The Coanda effect takes the name from the Romanian aerodynamicist Henri Coanda and represents the tendency of a fluid flow to follow the boundaries of a wall in its vicinity. As shown in Figure 5b, this mechanism makes the central flow periodically oscillate between the two feedback paths, thus producing at the microfluidic outlet a sweeping jet with a specific oscillation frequency. Gregory et al. (2007) patented a microfluidic oscillator able to generate an oscillating jet with a width of 325 µm and at frequencies higher than 20 kHz. It is not guaranteed that by further reducing the size of the device the Coanda effect is still present and exploitable for producing a sweeping jet.
Figure 1.5. (a) Schematic of a pulsed microjet (Mallinson et al., 2003) and (b) of a fluidic oscillator (Raman & Raghu, 2004).
In the spatial industry, micro-propulsion on micro-spacecrafts is useful for attitude control, gravitational compensation, and orbit adjustments. In the work of Janson et al. (1999), a 1-cm micro-thruster for nanosatellites was fabricated by bonding three micromachined layers, as shown in Figure 1.6a. In particular, the nozzle (Figure
7
1.6b) has a throat diameter of 100 µm, and it was fabricated by laser-machining in a Foturan® substrate, a common photosensitive glass-ceramic employed in MEMS technology (Williams et al., 2010).
(a) (b)
Figure 1.6. (a) Single components of a micro-thruster and assembled version; (b) micro-nozzle used in the micro-thruster in (a). Figures from Janson et al. (1999).
Micro-gas chromatographs are another example of lab-on-a-chip that finds important applications in the aerospace and chemical industries. Chemical instrumentations with low volume and low weight for in-situ measurements in astrobiology are important, given the reduced payload requirements in space applications. Moreover, volatile organic compounds (VOCs), such as formaldehyde, are possible health hazards in working and closed environments. VOCs have high saturation vapor pressures and can be released by furniture and building materials through evaporation or sublimation at ambient temperature. Portable gas analyzers are, therefore, important for testing air quality in these environments.
1.3
Scale effects at the microscale
As the development of the microfabrication processes made microdevices design possible, the scientific research focused its resources in controlling and better understanding the physical behavior of microdevices. Micro-systems behave quite differently from their corresponding macro versions. As the device becomes smaller, the inertial forces decrease, and surface forces tend to gain importance with respect to volume forces. By considering a system with a characteristic length scale 𝐿𝑐, the surface forces 𝐹𝑠 scale to the square of 𝐿𝑐, whereas the volume forces 𝐹𝑉
scale to the third power of 𝐿𝑐, so that the surface-to-volume forces ratio
𝐹𝑠 𝐹𝑉 ∝𝐿𝑐 2 𝐿𝑐3 = 1 𝐿𝑐 (1.1)
8 tends to increase as the device shrinks down.
The micromotor of Fan et al. (1988) is one of the very first examples of micromachines. A scanning-electronic-microscopy (SEM) of the electrostatically-driven motor is shown in Figure 1.7, where its real dimensions are put in evidence by a piece of human hair positioned in front of it. First experiments on this micromotor showed that the motion of the central rotor was prevented by the friction forces with the substrate. They noticed that the friction depends on the area of the contact surface, in contrast with the common friction law employed at macroscale for which the friction force is only proportional to the normal force exerting at the contact surface. This is an example of how surface effects dominate the mechanics in microdevices and a demonstration of how mathematical models that well represent physical processes at macroscales may not be valid at microscales.
Figure 1.7. Micromotor fabricated by Fan et al. (1988), compared with a piece of human hair.
In microfluidic devices, the large surface-to-volume forces ratio makes the viscous effects dominate the inertial ones, resulting in flows at low Reynolds numbers. In the same manner, as the size of the fluid volume becomes smaller, the thermal inertia reduces and the heat fluxes, proportional to the surface of heat exchange, gain importance. As a consequence of the modification of the balance between surface and volume contributions, the dynamical response of the fluid system becomes faster, as demonstrated, for instance, by the thermally-driven membrane actuation of the peristaltic micropump discussed in the previous section (Figure 1.2a).
1.4
Gas microflows
In gas systems, the number and the intensity of the intermolecular interactions are small when compared to liquid systems. In gas microflows, the flow dynamics can take place on characteristic lengths that are comparable to those of the molecular dynamics. In this situation, the dynamics at microscopic level has a direct influence on the
9
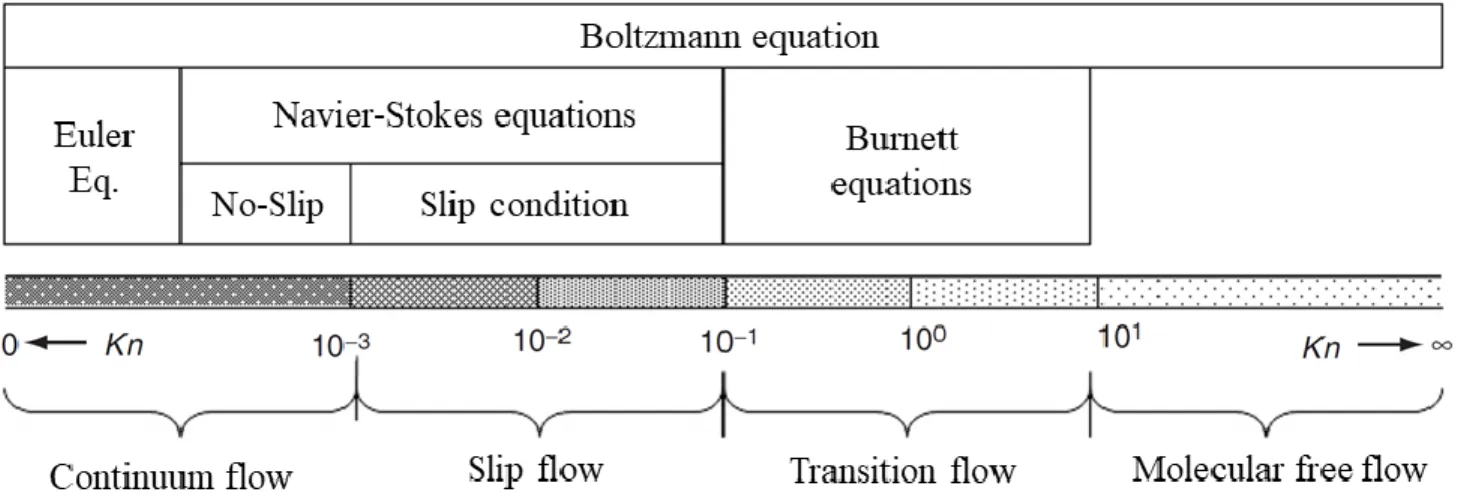
macroscopic-thermodynamic properties of the gas flow. This micro-effect is called rarefaction, and it is a consequence of the relatively-low number of intermolecular collisions inside the control volume. The Knudsen number, 𝐾𝑛 = 𝜆 𝐿⁄ , where 𝜆 is the mean free path of the molecules and 𝐿𝑐 𝑐 is the characteristic size of the system,
identifies the degree of gas rarefaction. Most of the microfluidic devices work in the slip flow regime, with 𝐾𝑛 in the range [10-3; 10-1], which is considered as characterized by slightly rarefied gas conditions. This regime can be reached either in a microfluidic device, where 𝐿𝑐 is low, or in a bigger system at low pressure, which results in a
high mean free path 𝜆. In this rarefaction regime, the classical continuum representation of the flow is still acceptable for fluid particles that are far enough from the system’s solid boundaries, i.e. at a distance larger than the well-known Knudsen layer thickness, which is considered to be on the order of 𝜆. For those systems that involve wall-gas interactions, e.g., in micro channels or in channels at low average pressure, the number of collisions between the wall surfaces and the gas molecules gains importance with respect to intermolecular collisions, thus producing a thermodynamic non-equilibrium state of the gas in the vicinity of the wall. At a macroscopic level, this produces a velocity slip and a temperature jump at the wall (Colin, 2005), i.e., non-negligible discontinuities of the kinematic and thermodynamic parameters between fluid and surface. These rarefaction effects strongly influence the heat and mass transfers. Therefore, a correct modeling of the thermodynamic disequilibrium at the wall is crucial for an accurate prediction of the mass flow rates and heat fluxes within the microdevice. Experimental observations and analysis of the rarefaction effects are needed for the validation and the accuracy quantification of the numerous theoretical and numerical analysis already existing in the literature.
With the increasing interest of the scientific community towards the physics at microscales, the experimental techniques for analyzing such types of microsystems has been developing accordingly. In microfluidic devices, very low mass flow rates require high-precision and sensitive instrumentation. The control of the microenvironment, e.g., in terms of surface roughness, working fluid composition, or temperature and pressure distributions, is of significant importance for a correct analysis of the microflow. It is common that pressure and temperature sensors are monolithically integrated during the fabrication of the microfluidic chip, e.g., the Pirani gauges of the Knudsen pump of Figure 1.2b. Nevertheless, in order to reduce the intrusiveness of the measurements, many experimental techniques adopted for microfluidic analysis are based on optical methods and electrochemical methods (Wu & Gu, 2011).
1.5
The objective of the work
In this context, this work aims to the application of an optical velocimetry technique, the molecular tagging velocimetry (MTV), to rarefied gas flows in a channel with a rectangular section. The final goal is to provide local measurements of the slip velocity at the wall that characterizes gas flows in the slip regime.
10
MTV is an optical, low-intrusive technique that can provide local measurements of the velocity field in fluid flows. By exploiting the laser-induced emission of a suitable molecular tracer previously added to the main flow, the velocity field is measured by tracking the displacement of the emitting molecules.
As explained in the previous section, the rarefaction regime can be achieved either by increasing the mean free path 𝜆, reducing the gas pressure, or by reducing the smaller dimension of the system, which corresponds, in our problem, to the height 𝐻 of the channel. Since the laser beam diameter can hardly be smaller than about 30 μm for technological reasons, the height of the channel is constrained to be not smaller than about 1 mm, in order to keep a reasonable spatial resolution. Consequently, Knudsen numbers corresponding to the targeted slip flow regime can only be reached by decreasing the average pressure of the gas-tracer mixture. Further details on this constraint and the implementation of MTV are provided in Chapter 5.
Previous works have already made a lot of progress in the direction of applying MTV in rarefied conditions. Samouda et al. (2015) have demonstrated that MTV can provide good results in a millimetric rectangular channel for a non-rarefied gas flow at atmospheric pressure and ambient temperature. However, they noticed that a deduction of the velocity profile by assuming it was simply homothetic of the displacement profile resulted in an artificial velocity slip at the wall, which was totally unexpected for the employed Knudsen numbers. Subsequently, Frezzotti et al. (2015) explained that this unexpected phenomenon is a consequence of a combined effect of advection and molecular diffusion of the tracer in the background gas flow that generates a non-zero molecular displacement at the wall. Moreover, the same authors proposed a numerical method based on a simple advection-diffusion equation that was able to correctly reconstruct the velocity profile from the displacement of the tagged line. By means of the Direct Simulation Monte Carlo (DSMC) method, it was possible to numerically verify the existence of a displacement slip at the wall caused by the advection-diffusion mechanism and not linked to a velocity slip at the wall. A reconstruction method of the velocity profile from the displacement profile was developed and validated with numerical experiments. Si Hadj Mohand et al. (2017) successfully applied this reconstruction method on MTV data in a millimetric channel and correctly extracted the velocity profile at atmospheric and sub-atmospheric pressures down to a minimum average pressure of 42 kPa. At this pressure level in a 1-mm deep channel, the flow is still in a non-rarefied regime.
Even though a lot of progress has been done towards the final objective, the application to gas flows in rarefied conditions has been prevented up to now by certain difficulties.
Firstly, the existence of a suitable molecular tracer that could generate a durable and intense light signal in rarefied conditions and that could make the velocity measurement possible was not evident. The increasing molecular diffusion and the smaller number of tracer molecules at low pressures let the light signal quickly vanish before any tracer displacement could be measured. A research aimed to solve this scientific barrier is at the center of the
11
first part of this work. Data on photoluminescence found in literature could not provide enough information to reveal if a specific molecular tracer combined with our experimental facilities could be successfully employed for our specific application. For this reason, an experimental campaign aimed at the investigation of the photoluminescence properties at low pressures of the molecular tracers of interest has been carried out.
Secondly, an experimental apparatus capable of generating a desired gas flow rate at low pressures in the channel and, at the same time, adapted to the experimental requirements for applying MTV needed to be designed. The application of MTV requires a stable flow rate with stable thermodynamic conditions when the measurements of the tracer displacement is made. The experimental setup should also guarantee a leakage-free environment and a compatibility with the chemical properties of the molecular tracer employed. Moreover, it should envisage the possibility of integrating a second measurement technique applicable to the tested flow conditions, which is necessary for the verification and the validation of the velocity measurements provided by MTV.
Thus, this work provides an experimental study on photoluminescence of acetone and diacetyl vapors that demonstrates the presence of an exploitable light signal at low pressures under certain operation conditions. After removing this scientific barrier, a novel experimental setup has been designed and built. This experimental setup allows for the application of MTV to gas mixture flows at low pressures and integrates the “dynamic” constant-volume technique, which is capable of providing a measurement of the mass flow rate in the tested channel. Finally, MTV is applied to gas flows in the slip regime and the first ever flow visualizations of the molecular displacement in channel flows at pressures on the order of 1 kPa are presented. Moreover, by means of an improved version of the reconstruction method previously proposed by Frezzotti et al. (2015), the first MTV measurements of the slip velocity at the wall are reported.
1.6
Organization and contributions of the thesis
This document has been structured in 7 chapters.
In Chapter 2, the concepts of rarefaction and thermodynamic non-equilibrium are discussed in more details. The rarefaction regimes are defined and the available mathematical models for each of them are reviewed. Particular attention is devoted to the models and the experimental data available in the literature related to the slip flow regime. The analytical solution for a steady, viscous, locally-incompressible, and locally fully-developed gas flow in a channel with rectangular cross-section is discussed in terms of mass flow rate, velocity profile, and pressure distribution along the channel. These mathematical tools will be used for the characterization of the experimental flow conditions inside the tested channel.
Chapter 3 presents the currently available experimental techniques for analyzing rarefied gas flows. The techniques are sorted by quantity to be measured: mass flow rate, pressure, temperature, and velocity. Firstly, a review on
12
pressure and temperature microsensors that are integrated in the microdevices is presented. Mass flow rate measurements can be carried out by means of either commercially available microsensors or specific experimental techniques. The performances of both the flow rate measurement techniques are discussed for application in gas microflows. Finally, a section is dedicated to the presentation of the available opto-chemical techniques for pressure, temperature, and velocity field measurements. Here, the general principle of MTV is described, and the different types of implementation are discussed. The literature about this technique is reviewed even for its application to liquid flows, for the sake of completeness.
In Chapter 4, the experimental facilities employed in this work are presented. The characteristics of the laser system, of the CCD camera, and of the gas circuit elements are discussed in detail. Two experimental setups are presented. The first one is devoted to the analysis of the photoluminescence lifetime of acetone and diacetyl vapors. These experiments are carried out in a chamber test with the vapor in a quiescent state. A second experimental setup has been built for the application of MTV to gas flows at low pressures.
Chapter 5 is dedicated to the experimental analysis of the photoluminescence properties of acetone and diacetyl vapors. In the first part of this chapter, the experimental data are analyzed from a qualitative point of view in the perspective of applying MTV to gas flows at low pressures. In the second part, a quantitative analysis of the same experimental data on acetone and diacetyl photoluminescence is presented. The big amount of data gathered shed light on the most important intramolecular phenomena to be taken into account for a correct description of the laser-induced emission. A mathematical model capable of describing our experimental observations is proposed. A parameter identification algorithm based on this same model is employed for a quantitative characterization of the photoluminescence (intramolecular) and kinetic (intermolecular) properties of acetone and diacetyl vapors, that is the triplet-triplet annihilation rate and the self-diffusion coefficient as a function of pressure.
Chapter 6 presents the experimental results obtained by MTV. The reconstruction method is described and applied to numerical experiments produced by DSMC. The experimental conditions of interest for the application of MTV are defined based on the experimental results of Chapter 5. The experimental gas flow conditions that can be generated by the new experimental setup are thoroughly analyzed. The “dynamic” volume technique is applied to measure the mass flow rate and is combined to theoretical solutions to provide an estimation of the thermodynamic properties and of the average velocity of the gas flow investigated by MTV. The post-processing procedure that is systematically applied to each image provided by MTV is explained in detail. Finally, MTV is applied to gas flows in non-rarefied conditions and, afterwards, to gas flows in the slip regime. Velocity measurements carried out by means of a novel time-correlation reconstruction method are presented and discussed.
13
In the last chapter, the experimental and numerical results provided by this work are summarized and discussed. The goals achieved are compared to the objectives that have been initially defined, and the next steps for further improving MTV measurements in rarefied gas flows are identified.
To summarize, the contributions given by this work are:
- experimental data on photoluminescence of acetone and diacetyl vapors at low pressures and comparative discussion with experimental data found in the literature;
- the mathematical representation of photoluminescence data for the parameter identification of the triplet-triplet annihilation rate and the self-diffusion coefficient of acetone and diacetyl;
- a novel experimental setup for the simultaneous application of MTV and constant volume technique to gas flows at low pressures;
- the development of new image fitting algorithms and of a time-correlation reconstruction method; - experimental results of flow visualization of molecular displacement in gas flows in the slip regime and
experimental evidences of the theoretically predicted molecular slip at the wall; - MTV measurements of velocity profile characterized by slip velocity at the wall. References
Acar, C., & Shkel, A. M. (2005). Structurally decoupled micromachined gyroscopes with post-release capacitance enhancement. Journal of Micromechanics and Microengineering, 15(5), 1092.
Batikh, A., Baldas, L., & Colin, S. (2017, February). Application of active flow control on aircrafts-state of the art. In International Workshop on Aircraft System Technologies (Vol. 2017).
Cattafesta III, L. N., & Sheplak, M. (2011). Actuators for active flow control. Annual Review of Fluid
Mechanics, 43, 247-272.
Chae, J., Stark, B. H., & Najafi, K. (2005). A micromachined Pirani gauge with dual heat sinks. IEEE
Transactions on Advanced Packaging, 28(4), 619-625.
Coanda, H. (1936). Lifting Device Coanda Effect. US Patent, 3261, 162.
Coe, D. J., Allen, M. G., Smith, B. L., & Glezer, A. (1995, June). Addressable micromachined jet arrays. In Solid-State Sensors and Actuators, 1995 and Eurosensors IX.. Transducers' 95. The 8th International
Conference on (Vol. 2, pp. 329-332). IEEE.
Colin, S. (2004, January). Rarefaction and compressibility effects on steady or transient gas flows in
microchannels. In ASME 2004 2nd International Conference on Microchannels and Minichannels (pp. 13-24). American Society of Mechanical Engineers.
14
Fan, L. S., Tai, Y. C., & Muller, R. S. (1988, December). IC-processed electrostatic micro-motors. In Electron
Devices Meeting, 1988. IEDM'88. Technical Digest., International (pp. 666-669). IEEE.
Frezzotti, A., Mohand, H. S. H., Barrot, C., & Colin, S. (2015). Role of diffusion on molecular tagging velocimetry technique for rarefied gas flow analysis. Microfluidics and Nanofluidics, 19(6), 1335-1348.
Furuhata, T., Hirano, T., Gabriel, K. J., & Fujita, H. (1991, January). Sub-micron gaps without sub-micron etching. In Micro Electro Mechanical Systems, 1991, MEMS'91, Proceedings. An Investigation of Micro
Structures, Sensors, Actuators, Machines and Robots. IEEE (pp. 57-62). IEEE.
Gregory, J. W., Sullivan, J. P., Raman, G., & Raghu, S. (2007). Characterization of the microfluidic oscillator. AIAA journal, 45(3), 568-576.
Gupta, N. K., An, S., & Gianchandani, Y. B. (2012). A Si-micromachined 48-stage Knudsen pump for on-chip vacuum. Journal of Micromechanics and Microengineering, 22(10), 105026.
Hirano, T., Furuhata, T., Gabriel, K. J., & Fujita, H. (1992). Design, fabrication, and operation of submicron gap comb-drive microactuators. Journal of Microelectromechanical systems, 1(1), 52-59.
Howe, R. T., & Muller, R. S. (1983). Polycrystalline silicon micromechanical beams. Journal of the
Electrochemical Society, 130(6), 1420-1423.
Lee, H. J., Choi, N., Yoon, E. S., & Cho, I. J. (2018). MEMS devices for drug delivery. Advanced drug delivery
reviews, 128, 132-147.
Mallinson, S. G., Kwok, C. Y., & Reizes, J. A. (2003). Numerical simulation of micro-fabricated zero mass-flux jet actuators. Sensors and Actuators A: Physical, 105(3), 229-236.
Mohand, H. S. H., Frezzotti, A., Brandner, J. J., Barrot, C., & Colin, S. (2017). Molecular tagging velocimetry by direct phosphorescence in gas microflows: correction of Taylor dispersion. Experimental Thermal and Fluid
Science, 83, 177-190.
Munoz, F., Alici, G., & Li, W. (2014). A review of drug delivery systems for capsule endoscopy. Advanced drug
delivery reviews, 71, 77-85.
Karniadakis, G., Beskok, A., & Aluru, N. (2006). Microflows and nanoflows: fundamentals and simulation (Vol. 29). Springer Science & Business Media.
Jabbal, M., Liddle, S. C., & Crowther, W. J. (2010). Active flow control systems architectures for civil transport aircraft. Journal of Aircraft, 47(6), 1966-1981.