In Vitro Ketamine CYP3A Mediated Metabolism Study using Mammalian Liver S9
Fractions, cDNA Expressed Enzymes and Liquid Chromatography Tandem Mass Spectrometry
Raphaël Santamaria, Floriane Pailleux and Francis Beaudry*
Groupe de Recherche en Pharmacologie Animal du Québec (GREPAQ), Département de biomédecine vétérinaire, Faculté de Médecine Vétérinaire, Université de Montréal, Saint-Hyacinthe, Québec, Canada
*Corresponding author:
Francis Beaudry, Ph.D.
Assistant Professor in analytical pharmacology Département de Biomédecine Vétérinaire Faculté de Médecine Vétérinaire
Université de Montréal 3200 Sicotte Saint-Hyacinthe, QC Canada J2S 2M2 Email: francis.beaudry@umontreal.ca Tel (514) 343-6111 ext. 8647
Keywords: Ketamine, Cytochrome P450, CYP3A, Drug Metabolism, Drug-Drug Interactions, Mass Spectrometry, Bioanalysis, Anesthesia
Abstract
Ketamine is widely used in medicine in combination with several benzodiazepines including midazolam. The objectives of this study were to develop a novel HPLC-MS/SRM method capable of quantifying ketamine and norketamine using an isotopic dilution strategy in biological matrices and study the formation of norketamine, the principal metabolite of ketamine with and without the presence of midazolam, a well-known CYP3A substrate. The chromatographic separation was achieved using a Thermo Betasil Phenyl 100 x 2 mm column combined with an isocratic mobile phase composed of acetonitrile, methanol, water and formic acid (60:20:20:0.4) at a flow rate of 300 µL/min. The mass spectrometer was operating in selected reaction monitoring mode and the analytical range was set at 0.05–50 µM. The precision (%CV) and accuracy (%NOM) observed were ranging from 3.9–7.8 and 95.9.2–111.1% respectively. The initial rate of formation of norketamine was determined using various ketamine concentration and Km values of 18.4 µM, 13.8 µM and 30.8 µM for rat, dog and human liver S9 fractions were observed respectively. The metabolic stability of ketamine on liver S9 fractions was significantly higher in human (T1/2 = 159.4 min) compared with rat (T1/2 = 12.6 min) and dog (T1/2 = 7.3 min) liver S9 fractions. Moreover significantly lower IC50 and Ki values observed in human compared with rat and dog liver S9 fractions. Experiments with cDNA expressed CYP3A enzymes showed the formation of norketamine is mediated by CYP3A but results suggest an important contribution from others isoenzymes, most likely CYP2C particularly in rat.
Introduction
Ketamine is a N-methyl-D-aspartate (NMDA) antagonist blocking glutamatergic functions, widely used in veterinary medicine in combination with xylazine [Stokes et al., 2009; Veilleux-Lemieux et al. 2012; St-Germain Lavoie et al. 2013] and several benzodiazepines [Hall, 2012; Maruf et al., 2010; Cartwright and Pingel, 1984]. Ketamine is used in concomitance with midazolam for analgesia/sedation of adult and pediatric patients [Wood, 2013; Barkan et al., 2013]. An exhaustive characterization of ketamine metabolism would provide the basis to foster a better understanding of possible drug-drug interactions in mammalians in order to prevent treatment failure or adverse effects resulting from possible alterations in drug metabolism when co-administered with other drugs. The impairment of drug metabolism resulting from enzymatic competition and inhibition has severe clinical implications as a result of an increased bioavailability and hampered clearance [Armstrong et al., 2009]. Recent in vitro metabolism studies revealed that ketamine is extensively metabolized to norketamine, dehydronorketamine, and 3-hydroxylated norketamine [Mössner et al. 2011; Kwan and Thormann, 2011]. These studies identified the cytochrome P450 (CYP) enzymes involved in the phase 1 metabolism of ketamine, principally CYP3A, and to a notably lesser extent CYP2C, CYP2B and CYP2D. Interestingly, historical data has shown that common metabolism by CYP3A enzymes have resulted in numerous clinically significant drug-drug interactions [Ogu and Maxa, 2000]. Thus, to explore possible drug-drug interactions, a comprehensive ketamine metabolism study in liver S9 fractions and cDNA-expressed CYP3A enzymes is required. The liver S9 fraction contains both microsomal and cytosolic fractions enabling the study of phase I and phase II drug metabolism. Liver S9 fraction is widely used as a simple and rapid in vitro method to examine drug metabolism. cDNA-expressed CYP3A enzymes are readily available and will allow to study the
very specific metabolic pathway associated with the transformation of ketamine to norketamine, the main metabolite observed in vitro and in vivo [Desta et al., 2012; Capponi et al., 2009].
Midazolam is a sedative drug with anxiolytic and amnestic properties with observed short-acting effects. It is widely used as a premedication in children [Barkan et al., 2013]. Midazolam is primarily metabolized in the liver by the CYP3A (CYP3A4 in human) to its pharmacologic active metabolite, α-hydroxymidazolam [Shimizu et al., 2007]. Moreover, α-hydroxymidazolam potency is comparable with the parent drug and contributes to the overall effect of midazolam. Midazolam is the preferred phenotyping CYP3A4 probe substrate used for in vitro and in vivo studies [Halama et al., 2013; Mooiman et al., 2013]. Co-administration of ketamine and midazolam to animals or humans could lead to competitive inhibition of CYP3A and result in an increase of systemic concentrations. Thus, it may produce significant adverse effects. It is therefore important to assess the potential of metabolic interactions particularly, interaction with CYP3A.
There are some analytical methods available in the literature for the measurement of ketamine and its metabolites in several biological matrices including hair, urine and plasma [Lin et al., 2013; Parkin et al., 2013; Moaddel et al., 2010]. Most of these published methods are used for forensic toxicology studies and they were not adapted, nor validated for metabolism studies. The method selectivity, precision and accuracy are critical in determining metabolic kinetic parameters. The first objective of the current study was to develop a HPLC-MS/SRM method quantifying ketamine and norketamine in liver S9 fraction suspensions using an isotopic dilution strategy. The second objective was to determine the relative substrate affinity for the CYP3A and the metabolic stability of ketamine in rat, dog and human liver S9 fractions. A third objective was to estimate the inhibitory effect of midazolam on ketamine CYP3A metabolism and compare
with the preferred CYP3A inhibitor ketoconazole [Bourrié et al., 1996]. Finally, a forth objective was to confirm inhibition results using cDNA-expressed CYP3A enzymes.
Materials and Methods
Chemicals and Reagents
Ketamine, d4-ketamine, norketamine, d4-norketamine and midazolam were obtained in solution from Cerilliant (Round Rock, TX). Ketoconazole (CYP3A inhibitor) was obtained from Sigma-Aldrich (St Louis, MO, USA). Other chemicals, including acetonitrile, formic acid, methanol, sodium phosphate dibasic and sodium phosphate monobasic were purchased from Fisher Scientific (Ottawa, ON, Canada). Mammalian liver S9 fractions, cDNA-expressed CYP3A enzymes (SupersomesTM) and NADPH-regenerating system solutions were obtained from BD Biosciences (Woburn, MA, USA). S9 fractions and SupersomesTM were tested for activities with standard testing procedure prior usage.
Quantitative Analytical Methods
The concentrations of ketamine and norketamine were determined using an HPLC-MS/SRM assay. Briefly, 50 µL of matrix samples (i.e. 0.5 mg/mL liver S9 fraction suspension) were mixed with 250 µL of deuterated internal standard solution (1 µM of d4-ketamine and d4-norketamine in acetonitrile) in a 1.5 mL centrifuge tube. The samples were then vortexed vigorously and were allowed to rest for 10 min at room temperature prior to centrifugation. Samples were centrifuged at 12,000 g for 10 min and 200 µL of the supernatant was transferred into an injection vial. Two µL of samples were injected using a Perkin Elmer Series 200 HPLC (Shelton, CT) onto a Thermo Hypersil Phenyl 100 x 2 mm column (5µm) with flow rate of 300 µL/min. The mobile phase consisted of a mixture of acetonitrile, methanol, water and formic acid at a ratio of 60:20:20:0.4,
respectively. The AB SCIEX API 2000 QTRAP® mass spectrometer (Concord, Ontario, Canada) was interfaced with the HPLC system using a pneumatic assisted electrospray ion source. The nitrogen gas 1 was set to 25 PSI, the nitrogen gas 2 was set to 45 PSI and heated at 400˚C. The electrospray electrode was set to 5000V. The declustering potential (DP) was set to 25V and the collision energy (CE) was set to 30V. The selected reaction monitoring (SRM) transitions were set to m/z 238.1 → 125.0, 242.1 → 129.0, 224.1 → 125.0 and 228.1 → 129.0 for ketamine, d4-ketamine, norketamine and d4-norketamine respectively. The dwell time was set to 100 msec and the pause time at 5 msec. The analytical range used was ranging from 0.05 to 50 µM. Standard and quality control samples were prepared in liver S9 enzyme suspensions but NADPH-regeneration solution A and B were added after the precipitation with acetonitrile to avoid the degradation of ketamine.
Liver S9 Fraction Incubation
The incubations were performed as previously described [Lavoie et al., 2013] and were performed minimally in triplicate. The incubations were performed in a microcentrifuge tube and contained various concentrations ranging from 1 to 100 µM of ketamine, 0.5 mg/mL of S9 fraction proteins diluted in 0.1 M phosphate buffer, pH 7.4. Liver S9 enzyme suspensions (total volume of 1 mL) were preincubated with 50 µL of NADPH-regenerating solution A (BD Biosciences Cat. No. 451220), 10 µL of solution B (BD Biosciences Cat. No. 451200), in 0.1 M phosphate buffer (pH 7.4) at 37°C for 5 min prior fortification with ketamine. Immediately after fortification of ketamine into the liver S9 fraction suspension containing the NADPH-regeneration system, the sampling point for t = 0 was taken, and further sampling points were taken at 5, 15, 30, 45 and 60 min for metabolic stability experiments. For the determination of Km and Vmax, the concentration of norketamine was determined after 10 min incubation. Fifty µL of
samples were taken and mixed with 250 µL of the deuterated internal standard solution (1 µM of d4-ketamine and d4-norketamine in acetonitrile) in a 1.5 mL centrifuge tube. Samples were centrifuged at 12,000 g for 10 min and 200 µL of the supernatant was transferred into an injection vial for HPLC-MS/SRM analysis.
Similarly, incubation of ketamine in liver S9 fractions at 30 µM with the presence of logarithmic concentrations of midazolam or ketoconazole was performed to determine IC50 value. Liver S9 enzyme suspensions were preincubated with the NADPH regeneration system and midazolam or ketoconazole at various concentrations (0.01 µM to 1000 µM) for 5 min at 37˚C prior fortification with 30 µM of ketamine. Sampling points at 10 min were taken and 50 µL of samples were mixed with 250 µL of the deuterated internal standard solution (1 µM of d4-ketamine and d4-nord4-ketamine in acetonitrile) in a 1.5 mL centrifuge tube. Samples were centrifuged at 12,000 g for 10 min and 200 µL of the supernatant was transferred into an injection vial for HPLC-MS/SRM analysis.
cDNA Expressed CYP3A Incubation
Incubation of ketamine in cDNA expressed CYP3A at 30 µM with the presence of logarithmic concentrations of midazolam or ketoconazole was used to determine IC50 values. cDNA expressed CYP3A enzyme suspensions (20 pmol/mL in 0.1 M phosphate buffer, pH 7.4) were preincubated with the NADPH regeneration system and midazolam or ketoconazole at various concentrations (0.01 µM to 1000 µM) for 5 min at 37˚C prior fortification with 30 µM of ketamine. Sampling points at 10 min were taken and 50 µL of samples were mixed with 250 µL of the deuterated internal standard solution (1 µM of d4-ketamine and d4-norketamine in
acetonitrile) in a 1.5 mL centrifuge tube. Samples were centrifuged at 12,000 g for 10 min and 200 µL of the supernatant were transferred into an injection vial for HPLC-MS/SRM analysis.
Data analysis and regression
All non-linear regression analyses were performed with PRISM (6.0c) GraphPad software (La Jolla, CA) using the non-linear curve-fitting module with an estimation of the goodness of fit. The Michaelis-Menten equation describes the rates of irreversible enzymatic reactions that are generally observed for CYP mediated metabolic reactions. Michaelis-Menten parameters can be estimated by various linearization methods. However, non-linear regression analysis was performed using the Michaelis-Menten equation [Michaelis and Menten, 1913].
𝑣! =!!"# [!] !!! [!] (1)
Were the initial velocity (vi) was determined using equation 2.
𝑣! = ![!]!" = [!"#$%&'()!%]!" !"# !" !"# (2)
The initial rate (vi) was calculated based on the concentration norketamine measured after 10 minutes incubation of ketamine in liver S9 enzyme or SupersomesTM suspensions. Following sample analysis, the analyte/deuterated internal standard peak area ratio was used to determine ketamine and norketamine concentrations at various time points to determine the metabolic stability. All depletion data were fitted to the monoexponential decay model described in equation (3) where C(t) are substrate concentration at time t and C0 is the initial concentration.
𝐶(𝑡) = 𝐶!𝑒!!" (3)
𝑇!/! =!"(!)! (4)
Additionally, the enzyme-mediated clearance (CLuint) that would occur without physiological limitations including protein binding or hepatic blood flow was determined using equation (5).
𝐶𝐿𝑢!"# =!!"# !! (5)
IC50 values for the inhibition of the formation of norketamine, the principal hepatic metabolite of ketamine were determined by nonlinear regression analysis using the following equation (6).
𝑉! = 𝑉! !"#+ ( !! !"#!!! !"#
!!!"(!"# ! !!"#$%!") ) (6)
Results and Discussion
Tandem Mass Spectrometry
Precursor ion and product ion mass spectra for ketamine, norketamine and deuterated analog internal standards were obtained in positive ion mode. The precursor ion spectra of ketamine and norketamine showed an intense signal for the protonated molecular ion ([M+H]+) at m/z 238 and m/z 224, respectively (Fig. 1A and Fig 1B). Precursor ions detected for ketamine and d4-norketamine were m/z 242 and m/z 228 respectively (data not shown). The product ion spectrum of ketamine has predominant fragment ions at m/z 125, m/z 163 and m/z 179 (Fig. 1C). The product ion spectrum of norketamine has predominant fragment ions at m/z 125 and m/z 179 (Fig. 1D). The deuterated analog internal standards showed an intense fragment ion at m/z 129 compatible with the introduction of deuterium atoms on the benzene ring (data not shown). The mass transition in SRM mode was set for best sensitivity and selectivity at m/z 238 → 125, 242
respectively. As illustrated in Fig. 1C and Fig. 1D, the product ion spectra were compatible with the molecular structures. The limit of detection, defined as being the quantity of analyte required to obtain 3-5 times the signal-to-noise ratio response, was established at 5 pg injected on column for both analytes using the SCIEX API 2000 QTRAP® equipped with a Turbo IonSprayTM source.
Calibration Curve Analysis
A linear regression (weighted 1/concentration) produced the best fit for the concentration– detector relationship. The regression model used was determined using the sum of the squares of the deviations [Beaudry, 1999]. By convention, the regression line is considered to properly fit the calibration set when the sum of squares of the deviations is minimized. The calculated coefficients of correlation (r) were better then 0.998 for an analytical range set from 0.05 to 50 µM in liver S9 enzyme suspensions.
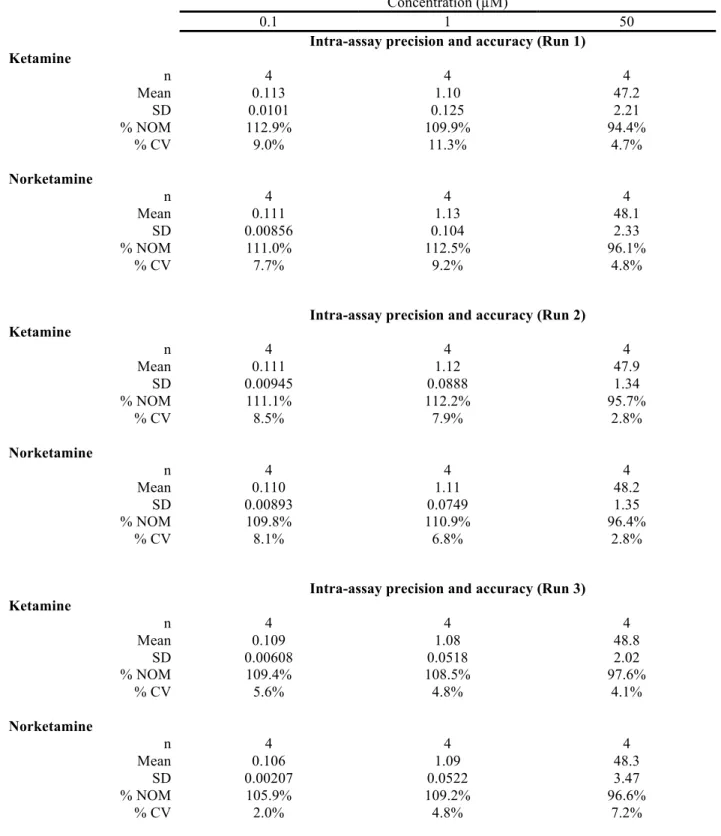
Precision and Accuracy
The reproducibility of the method was evaluated by analyzing twelve replicates of liver S9 enzyme suspension samples fortified with ketamine and norketamine at the nominal concentration of 0.1, 1 and 50 µM. The precision and accuracy results are displayed in Table 1. The results obtained demonstrate that acceptable precision and accuracy results were achieved and were compatible with generally accepted criteria in bioanalysis (CDER and CVM, 2001). A representative chromatogram of LOQ samples is shown in Fig. 2. As illustrated in Fig 2., extracted blank liver S9 fraction did not show any interference from endogenous substances at the mass transition monitored for ketamine and norketamine. Moreover, the signal-to-noise ratio of the LOQ sample was above 10:1 with a significant number of points to adequately determine peak area allowing the quantification these two analytes with acceptable figure of merits for a
metabolism study. This analytical method was also successfully adapted for analysis in rat plasma.
Determination of the apparent Michaelis constant Km and Vmax
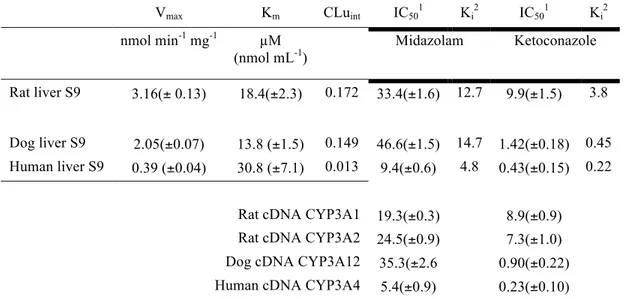
The effect of substrate concentration on the initial rate (Vi) of an enzyme-catalyzed reaction is a fundamental concept in enzyme kinetics. The Michaelis constant Km of an enzyme represents the substrate concentration at which the reaction occurs at half of the maximum rate. Km is an indicator of the affinity that an enzyme has for a particular substrate, and hence the stability of the enzyme-substrate complex. Low Km value may suggest that enzyme has a greater affinity for substrate and vice-versa. To adequately determine the value of the apparent Michaelis-Menten constant Km as well as the maximum rate achieved by the system (Vmax), the data were fitted with the Michaelis-Menten equation (1). The initial rate (Vi) was calculated using the equation (2) and concentrations of norketamine were determined after 10 min ketamine incubation in liver S9 fraction suspensions by HPLC-MS/SRM. Figure 3 shows results coherent with a kinetics following a Michaelis-Menten enzymatic reaction for all three species. The derived results from the regression analyses suggest Km values of 18.4 (± 2.3) µM, 13.8 (± 1.5) µM and 30.8 (± 7.1) µM for rat, dog and human liver S9 fractions respectively. It has been previously determined that the formation of norketamine is mainly mediated by CYP3A but other CYP enzymes are involved into the metabolism of ketamine [Mössner et al. 2011; Kwan and Thormann, 2011]. There is a two-fold difference between the apparent Km values observed in animal liver S9 fractions compared with human liver S9 fractions. This is interesting since Km is an indicator of the stability of the enzyme-substrate complex. A lower Km may indicate that the substrate might be less susceptible to competitive inhibition in animal species compared with human. This is interesting since hepatic drug clearance depend on hepatic blood flow rate but also on the
extraction coefficient. The extraction coefficient will be altered in the context of competitive inhibition and will significantly impact drug exposition. These early results may suggest that CYP3A mediated ketamine metabolism will be less susceptible to competitive inhibition in rat and dog compared to human.
Ketamine metabolic stability evaluations in mammalian liver S9 fractions
Metabolism is a key element of drug clearance and it directly influences the systemic drug exposure. Ketamine metabolic stability at 5 µM ([S] < Km) was evaluated in rat, dog and human liver S9 fractions. The data presented in Fig. 4 were fitted with a mono-exponential decay model as described in equation (3) and the coefficients of determination (R2) were comprised between 0.88 and 0.99 for each fitted data series, suggesting that ketamine first-order kinetics was observed and the condition of the model was met [Masimirembwa et al., 2001]. The in vitro T1/2 derived were 12.6 (± 0.4) min, 7.3 (± 1.0) min and 159.4 (± 29.8) min in rat, dog and human liver S9 fractions respectively. There is an important discrepancy between the metabolic fate observed in human liver S9 fractions compared to rat and dog liver S9 fractions. If the in vitro difference observed translate in vivo, drug exposition will therefore be considerably different between species. Presently the pharmacokinetic data available from the literature are difficult to compare since dose, formulation, route of administration and regiment are inconsistent. Thus, we are unable to make a thoughtful comparison with our in vitro results. However, in all species, total clearance observed is relatively high but the terminal half-life is longer in human compared to rodents [Clements et al., 1982; Veilleux-Lemieux et al. 2013]. During the elimination phase, the plasma concentration is specifically linked with the elimination of ketamine from the body and the elimination is then considered independent of the amount of drug remaining. Consequently, the difference in terminal half-life observed in vivo is compatible with our in vitro results despite
their dissimilarity. The derived intrinsic clearance (CLuint) data presented in Table 2 suggest that the extent of ketamine CYP3A metabolism is reduced extensively in human liver S9 fractions compared to rat and dog liver S9 fractions suggesting that ketamine exposition in human could be significantly higher using an equivalent dose, formulation and route of administration. However, there are various elements affecting drug elimination other then liver phase 1 metabolism.
Evaluation of the effect of midazolam and ketoconazole on ketamine CYP3A mediated metabolism
Ketamine-midazolam is amongst the most frequently used anesthetic mixtures used in veterinary and human medicine. Interestingly, children patients receiving intravenous ketamine with midazolam for sedation show more pronounced adverse effects with patients younger than 10 years [Wathen et al., 2000]. Dosing infants and children is impeded by a general lack of knowledge about drug bioavailability and disposition in this specific population particularly when concomitant drugs are used as anesthetic mixtures. In a previous study [Lavoie et al., 2013], we demonstrated that CYP3A xylazine metabolism was hampered by ketamine and ketoconazole in rat liver microsomes. The ketamine-xylazine combination is also commonly used and the impairment of drug metabolism resulting from enzymatic competitive inhibition may have severe clinical implications as a result of an increased bioavailability and hampered clearance [Lavoie et al., 2013; Veilleux-Lemieux et al., 2012]. In vitro metabolism studies revealed that the principal hepatic metabolite of ketamine was norketamine and the formation was principally catalyzed by CYP3A [Mössner et al. 2011; Kwan and Thormann, 2011]. Hence, midazolam is a well-characterized CYP3A substrate used for in vitro and in vivo metabolism studies [Halama et al., 2013; Mooiman et al., 2013]. One objective was to verify if midazolam could affect ketamine metabolism in rat, dog and human S9 liver fractions. As displayed in Figure 5 A, C and E, the determinations of midazolam IC50 suggest that indeed, midazolam can inhibit the formation of
norketamine, the main metabolite of ketamine. Moreover, as shown in Table 2, the calculated inhibition constant (Ki) suggest that midazolam inhibition was notably more important in human liver S9 fractions compared with rat and dog liver S9 fractions. This observation was also compatible with data obtained for cDNA expressed CYP3A enzymes as illustrated in Fig. 6 A, C and E. Also, the Fig. 5 A, C and E revealed that midazolam can completely inhibit the formation of norketamine at concentrations beyond IC50. However, as shown in Fig. 5 B, D and F, ketoconazole, a well established CYP3A inhibitor, did not completely inhibit the formation of norketamine even at concentrations considerably higher then IC50. These results are compatible with a previous ketamine metabolism study performed with canine, equine and human liver microsomes [Mössner et al. 2011]. Additional experiments were conducted using cDNA expressed CYP3A enzymes and results shown in Fig.6 demonstrate that midazolam and ketoconazole were able to completely inhibit the formation of norketamine. This is an interesting result suggesting that the formation of norketamine in liver S9 fractions is not only mediated by CYP3A. Midazolam metabolism is primarily mediated by CYP3A, but a non-negligible CYP2C contribution was shown in recent studies [van Waterschoot et al. 2008]. Remarkably, the relative concentrations of individual P450 enzymes are different between rat and human favoring CYP2C in rat. This may explain why ketoconazole did not completely inhibit the formation of norketamine, particularly in rat liver S9 fractions were the rate of norketamine formation was still very high but midazolam was able to inhibit completely the formation of norketamine. Besides, derived Ki values suggest that ketoconazole is a much stronger inhibitor of CYP3A metabolism compared to midazolam, particularly in human liver S9 fractions and cDNA express human CYP3A4.
Mutual competitive inhibition caused by co-administration of drugs, may contribute to improve bioavailability in certain cases and this is one major reason the concomitance administration of ketamine and midazolam is an effective method for sedation and analgesia. A recent study demonstrated that combined ketamine-midazolam provided better results then midazolam alone for sedation of young children [Moreira et al., 2013]. But, children patients younger then 10 years receiving intravenous ketamine along with midazolam display more pronounced adverse effects [Wathen et al., 2000]. Drug-drug interactions have become an important issue in health care and concomitant drug administration is widely recognized to be a major cause. It is just in the last decade that evidences of major pharmacokinetic interactions between drugs were shown to be associated to hepatic CYP enzymatic metabolism interactions and more specifically, resulting from competitive inhibition. Drug-drug interactions may have severe consequences particularly anesthetized patients due to hemodynamic effects of anesthetic drugs and reduced renal clearance. Anaesthetic protocols in veterinary and human medicine often use multiple drugs to obtain the desired level of sedation and anesthesia. It is therefore important to investigate potential metabolism interactions since only limited data are available in specific patient subpopulations and animals. Genetic polymorphism of CYP3A and CYP2C may also contribute to aggravate drug-drug interactions in subpopulations and very little data on animal genetic polymorphism exist. Our results clearly demonstrate interactions between ketamine and midazolam metabolism. It is important to denote that our results show that midazolam has significantly more inhibitory effects on ketamine metabolism in human liver S9 fractions. This may explain the reason the administration of ketamine and midazolam in adult patient is considered very safe but more adverse effects were observed in young children.
Conclusion
A novel high-performance liquid chromatographic-mass spectrometry SRM method was developed to quantify ketamine and norketamine. The novel method meets all requirements of specificity, sensitivity, linearity, precision and accuracy generally accepted in bioanalytical chemistry (CDER and CVM, 2001). In vitro metabolism studies were performed in rat, dog and human liver S9 fractions and cDNA expressed CYP3A enzymes. The data presented in this manuscript revealed that ketamine has a low affinity for CYP3A particularly in human liver S9 fractions. The metabolic stability of ketamine on liver S9 fractions was significantly higher in human liver S9 fractions compared with rat and dog liver S9 fractions. This result may suggest that concomitant administration of ketamine with other drugs in human appear to be more susceptible to drug-drug interactions. This is confirmed with significantly lower IC50 and Ki values observed in human compared with rat and dog liver S9 fractions. Further experiments with ketamine, midazolam and ketoconazole strongly supported that the metabolism of ketamine to its main metabolite norketamine is mediated by CYP3A in rat, dog and human liver S9 fractions. Although, results also suggest the contribution of other isoforms, most likely CYP2C. The involvement of CYP3A and CYP2C in ketamine metabolism suggest that further pharmacokinetic studies in subpopulations would be required to assure a more define, predictable potency and a better control of side effects particularly in the context of concomitant administration of ketamine. Dose adjustments might be required when using ketamine with other analgesic, anesthetic and/or sedative drugs to avoid potential undesired drug-drug interactions.
Acknowledgments
This project was funded by the National Sciences and Engineering Research Council of Canada (F. Beaudry discovery grant no. 386637-2010). R. Santamaria received a scholarship from the National Sciences and Engineering Research Council of Canada (NSERC-USRA Program). F. Pailleux received a scholarship from the Coopération et Mobilité Internationales Rhône-Alpes (CMIRA Explora’doc 2011 and 2013).
References
Armstrong SC, Wynn GH, Sandson NB. Pharmacokinetic drug interactions of synthetic opiate analgesics. Psychosomatics. 2009;50(2):169-176.
Barkan S, Breitbart R, Brenner-Zada G, Feldon M, Assa A, Toledano M, Berkovitch S, Shavit I, Kozer E. A double-blind, randomised, placebo-controlled trial of oral midazolam plus oral ketamine for sedation of children during laceration repair. Emergency Medicine Journal. 2013. doi:10.1136/emermed-2012-202189.
Beaudry F. Statistical evaluation of linearity and non linearity of LC/MS/MS quantitation analysis. Pharmaceutical Science. 1999;1(4): 2437.
Bourrié M, Meunier V, Berger Y, Fabre G. Cytochrome P450 isoform inhibitors as a tool for the investigation of metabolic reactions catalyzed by human liver microsomes. Journal of Pharmacology and Experimental Therapeutics. 1996;277:321-332.
Capponi L, Schmitz A, Thormann W, Theurillat R, Mevissen M. In vitro evaluation of differences in phase 1 metabolism of ketamine and other analgesics among humans, horses, and dogs. American Journal of Veterinary Research. 2009;70(6):777-786
Cartwright PD and Pingel SM. Midazolam and diazepam in ketamine anaesthesia. Anaesthesia. 1984;39:439-442.
CDER and CVM. Guidance for Industry. Bioanalytical Method Validation. Center for Drug Evaluation and Research and Center for Veterinary Medicine, May 2001. Available from: http://www.fda.gov/cder/ guidance/ 4252fnl.pdf .
Clements JA, Nimmo WS, Grant IS. Bioavailability, pharmacokinetics, and analgesic activity of ketamine in humans. Jounal of Pharmaceutical Science. 1982;71(5):539-542.
Desta Z, Moaddel R, Ogburn ET, Xu C, Ramamoorthy A, Venkata SL, Sanghvi M, Goldberg ME, Torjman MC, Wainer IW. Stereoselective and regiospecific hydroxylation of ketamine and norketamine. Xenobiotica. 2012;42(11):1076-1087.
Halama B, Hohmann N, Burhenne J, Weiss J, Mikus G, Haefeli WE. A nanogram dose of the CYP3A probe substrate midazolam to evaluate drug interactions. Clinical Pharmacology and Therapeutics. 2013;93(6):564-571.
Hall RW. Anesthesia and analgesia in the NICU. Clinics in Perinatology. 2012;39(1):239-254. Kwan HY and Thormann W. Enantioselective capillary electrophoresis for the assessment of CYP3A4-mediated ketamine demethylation and inhibition in vitro. Electrophoresis. 2011;32(19):2738-2745.
Lavoie DS, Pailleux F, Vachon P, Beaudry F. Characterization of xylazine metabolism in rat liver microsomes using liquid chromatography-hybrid triple quadrupole-linear ion trap-mass
Lin HR, Choi KI, Lin TC, Hu A. Simultaneous quantification of amphetamine, opiates, ketamine and relative metabolites in urine for confirmatory analysis by liquid chromatography tandem mass spectrometry. Journal of Chromatography B. 2013;929:133-141.
Moaddel R, Venkata SL, Tanga MJ, Bupp JE, Green CE, Iyer L, Furimsky A, Goldberg ME, Torjman MC, Wainer IW. A parallel chiral-achiral liquid chromatographic method for the determination of the stereoisomers of ketamine and ketamine metabolites in the plasma and urine of patients with complex regional pain syndrome. Talanta. 2010;82(5):1892-1904
Maruf AA, Hossain MD, Ahmed M, Samsad IA. Procedural sedation in children for magnetic resonance imaging--comparison between ketamine diazepam combination with midazolam fentanyl combination. Mymensingh Medical Journal. 2010;19(1):60-65.
Masimirembwa CM, Thompson R and Andersson TB. In vitro high throughput screening of compounds for favorable metabolic properties in drug discovery. Combinatorial Chemistry and High Throughput Screening 2001; 4: 245-263.
Michaelis L and Menten ML. Die Kinetik der Invertinwir‐ kung. Biochemische Zeitschrift 1913; 49:334-336.
Mooiman KD, Maas-Bakker RF, Rosing H, Beijnen JH, Schellens JH, Meijerman I. Development and validation of a LC-MS/MS method for the in vitro analysis of
1-hydroxymidazolam in human liver microsomes: application for determining CYP3A4 inhibition in complex matrix mixtures. Biomedical Chromatography. 2013;27(9):1107-1116.
Moreira TA, Costa PS, Costa LR, Jesus-França CM, Antunes DE, Gomes HS, Neto OA.
Combined oral midazolam-ketamine better than midazolam alone for sedation of young children: a randomized controlled trial. International journal of paediatric dentistry. 2013;23(3):207-215. Mössner LD, Schmitz A, Theurillat R, Thormann W, Mevissen M. Inhibition of cytochrome P450 enzymes involved in ketamine metabolism by use of liver microsomes and specific cytochrome P450 enzymes from horses, dogs, and humans. American Journal of Veterinary Research. 2011;72(11):1505-1513.
Ogu CC, Maxa JL. Drug interactions due to cytochrome P450. Baylor University Medical Center Proceedings. 2000;13(4):421-423.
Parkin MC, Longmoore AM, Turfus SC, Braithwaite RA, Cowan DA, Elliott S, Kicman AT. Detection of ketamine and its metabolites in human hair using an integrated nanoflow liquid chromatography column and electrospray emitter fritted with a single porous 10 µm bead. Journal of Chromatography A. 2013;1277:1-6.
Shimizu M, Uno T, Tamura HO, Kanazawa H, Murakami I, Sugawara K, Tateishi T. A developed determination of midazolam and 1'-hydroxymidazolam in plasma by liquid chromatography-mass spectrometry: application of human pharmacokinetic study for measurement of CYP3A activity. Journal of Chromatography B. 2007;847(2):275-281.
Stokes EL, Flecknell PA, Richardson CA. Reported analgesic and anaesthetic administration to rodents undergoing experimental surgical procedures. Laboratory Animal. 2009;43(2):149-154.
van Waterschoot RA, van Herwaarden AE, Lagas JS, Sparidans RW, Wagenaar E, van der Kruijssen CM, Goldstein JA, Zeldin DC, Beijnen JH, Schinkel AH. Midazolam metabolism in cytochrome P450 3A knockout mice can be attributed to up-regulated CYP2C enzymes. Molecular Pharmacology. 2008;73(3):1029-1036.
Veilleux-Lemieux D, Beaudry F, Hélie P and Vachon P, Effects of endotoxemia on the pharmacodynamics and pharmacokinetics of ketamine and xylazine anesthesia in Sprague– Dawley rats. Veterinary Medicine: Research and Reports. 2012:3;99-109.
Wood M. The use of intravenous midazolam and ketamine in paediatric dental sedation. SAAD Digest. 2013;29:18-30.
Wathen JE, Roback MG, Mackenzie T, Bothner JP. Does midazolam alter the clinical effects of intravenous ketamine sedation in children? A double-blind, randomized, controlled, emergency department trial. Annals of emergency medicine journal. 2000;36(6):579-588.
Table 1. Determination of the precision and accuracy for the analysis of ketamine and norketamine in S9 liver fractions1 by HPLC-MS/MRM
Concentration (µM)
0.1 1 50
Intra-assay precision and accuracy (Run 1) Ketamine n 4 4 4 Mean 0.113 1.10 47.2 SD 0.0101 0.125 2.21 % NOM 112.9% 109.9% 94.4% % CV 9.0% 11.3% 4.7% Norketamine n 4 4 4 Mean 0.111 1.13 48.1 SD 0.00856 0.104 2.33 % NOM 111.0% 112.5% 96.1% % CV 7.7% 9.2% 4.8%
Intra-assay precision and accuracy (Run 2) Ketamine n 4 4 4 Mean 0.111 1.12 47.9 SD 0.00945 0.0888 1.34 % NOM 111.1% 112.2% 95.7% % CV 8.5% 7.9% 2.8% Norketamine n 4 4 4 Mean 0.110 1.11 48.2 SD 0.00893 0.0749 1.35 % NOM 109.8% 110.9% 96.4% % CV 8.1% 6.8% 2.8%
Intra-assay precision and accuracy (Run 3) Ketamine n 4 4 4 Mean 0.109 1.08 48.8 SD 0.00608 0.0518 2.02 % NOM 109.4% 108.5% 97.6% % CV 5.6% 4.8% 4.1% Norketamine n 4 4 4 Mean 0.106 1.09 48.3 SD 0.00207 0.0522 3.47 % NOM 105.9% 109.2% 96.6% % CV 2.0% 4.8% 7.2%
1 Precision and accuracy evaluations were performed using rat S9 fraction supernatant.
Inter-assay precision and accuracy Ketamine n 12 12 12 Mean 0.111 1.10 48.0 SD 0.00803 0.0859 1.85 % NOM 111.1 % 110.2 % 95.9 % % CV 7.2 % 7.8 % 3.9 % Norketamine n 12 12 12 Mean 0.109 1.11 48.2 SD 0.00694 0.0735 2.30 % NOM 108.9 % 110.9 % 96.4 % % CV 6.4 % 6.6 % 4.8 %
Table 2. Kinetic parameters associated with the formation norketamine in liver S9 fractions and cDNA express CYP3A enzymes.
Vmax Km CLuint IC501 Ki2 IC501 Ki2 nmol min-1 mg-1 µM
(nmol mL-1) Midazolam Ketoconazole Rat liver S9 3.16(± 0.13) 18.4(±2.3) 0.172 33.4(±1.6) 12.7 9.9(±1.5) 3.8 Dog liver S9 2.05(±0.07) 13.8 (±1.5) 0.149 46.6(±1.5) 14.7 1.42(±0.18) 0.45 Human liver S9 0.39 (±0.04) 30.8 (±7.1) 0.013 9.4(±0.6) 4.8 0.43(±0.15) 0.22
Rat cDNA CYP3A1 19.3(±0.3) 8.9(±0.9) Rat cDNA CYP3A2 24.5(±0.9) 7.3(±1.0) Dog cDNA CYP3A12 35.3(±2.6 0.90(±0.22) Human cDNA CYP3A4 5.4(±0.9) 0.23(±0.10)
1 The substrate concentration was 30µM
2 Determination of Ki was based in this formula: 𝐾
! =!!!"!"[!] !!
Figure legends
Figure 1. Precursor (MS) and product ion spectra (MS2) of ketamine (A and C) and norketamine (B and D).
Figure 2. HPLC-MS/SRM analysis of ketamine and norketamine in liver S9 fractions. Overlay SRM extracted ion chromatograms of a reference (ref), a blank sample (black) and an extracted liver S9 fraction LOQ samples (blue) for ketamine (A) and norketamine (B).
Figure 3. Determination of Michaelis constant Km and maximum velocity Vmax using non-linear regression fitting. Each point represents the mean (±SD) of triplicate experiments.
Figure 4. Depletion profile of ketamine in rat, dog and human liver S9 fractions rat at 5 µM. Data presented on a linear scale and each point represents the mean (±SD) of triplicate experiments. Figure 5. Determination of the inhibitory concentration 50% (IC50) of midazolam and ketoconazole on the formation of norketamine in rat (A and B), dog (C and D) and human (E and F) liver S9 fractions. Each point represents mean (±SD) of triplicate experiments.
Figure 6. Determination of the inhibitory concentration 50% (IC50) of midazolam and ketoconazole on the formation of norketamine in cDNA express rat CYP3A1 and CYPA 3A2 (A and B), dog CYP 3A12 (C and D) and human CYP3A4 (E and F). Each point represents mean (±SD) of triplicate experiments.