British Journal of Nutrition (1985), 54, 79-86
79
Further studies in rats on the influence of previous iron intake on
the estimation
of bioavailability of Fe
BY S U S A N J. F A I R W E A T H E R - T A I T , T I N A E. S W I N D E L L A N D A. J. A. W R I G H T
AFRC Food Research Institute, Colney Lane, Norwich NR4 7UA (Received 31 December 1984 - Accepted 28 February 198.5)
1. Iron retention from 3 g wholewheat flour was measured in male Wistar rats previously given one high-Fe or control diet meal 12,24, 36,48 or 60 h before the test meal (Expt 1). The control diet was given at all other times. The procedure was then repeated in rats given one high- or low-Fe meal 12, 24, 36 or 48 h before the test meal (Expt 2).
2. There was a significant difference between groups given a high- or medium-Fe meal at 12,24,36 h (P < 0.001) and 48 h (P < 0.05) but not at 60 h. In the second experiment, there was a significant difference between groups given a high- or low-Fe meal at 12, 24 or 36 h but no difference when given the two diets 48 h before the test meal. The high-Fe meal depressed and the low-Fe meal enhanced subsequent 68Fe retention: the effects were greatest at 12 h and diminished as the time interval between the high- or low-Fe meal and the test meal increased. The estimated mean time for the absorptive capacity of the mucosal cells to return to equilibrium was 54.0 (SEM
3. Male Wistar rats were given high-, control or low-Fe diets for either 3 d or 28 d before an in vivo investigation in which the luminal loss of 59Fe-labelled ferric citrate from duodenal and ileal loops was measured, and the proportional distribution between the carcass and the washed loop measured (Expt 3).
4. The luminal loss of 59Fe-labelled ferric citrate was significantly affected by the previous diets (P < 0.001). Rats given a low-Fe diet absorbed more than those given a high-Fe diet but the period of time on the diet
(3 or 28 d) had no effect on luminal loss. Significantly more 68Fe was lost from duodenal than from ileal loops in all groups.
7.6) h.
Iron retention by rats from a test meal is altered by previous feeding with a high- or low-Fe diet: there is an exponential relation between the retention of Fe and the Fe concentration of the diet consumed during the 3 d before the test meal (Fairweather-Tait & Wright, 1984). In fact, one meal alone has a profound effect on Fe retention, which suggests that the short-term regulation of Fe absorption is mediated through the mucosal cells rather than by changes in body Fe status. In order to understand the extent to which the mucosal cells are involved in regulating absorption, the time and rate at which Fe retention in rats returned to the values on the control diet after feeding a high- or low-Fe meal were measured. The uptake of 59Fe from 59Fe-labelled ferric citrate was measured in duodenal and ileal loops from rats previously fed high-, control or low-Fe diets for 3 or 28 d.
MATERIALS A N D METHODS
Animals and diets
Male Wistar rats were used in all experiments. They were housed individually in Expts 1 and 2, and in pairs in Expt 3, in stainless steel and plastic cages with wire bottoms, given a control semi-synthetic diet and trained to meal-feed before the start of each experiment. The composition of the control diet has been described previously (Fairweather-Tait & Wright, 1984); it contained a moderate level of Fe. The high-Fe diet was prepared by adding extra ferrous sulphate and the low-Fe diet by omitting it totally from the mineral mix.
80
S U S A N
J.
F A I R W E A T H E R - T A I T
A N D O T H E R SWhole-body and gamma counting
The use of the NE 8 112 (Nuclear Enterprises, Edinburgh) small-animal whole-body counter (WBC) has been described previously (Fairweather-Tait & Wright, 1984).
The 59Fe content of the dried gut, mucosal solutions and washings were measured in a Philips PW 4580 automatic gamma counter and counted with a 75 mm x 75 mm sodium iodide crystal, centre 1180 keV, width 440 keV, gauge 25 mm with a counting efficiency of
14%.
Atomic absorption spectroscopy ( A A S )
Diets and biological standards (National Bureau of Standards, Office of Standard Reference Materials, Washington, USA) were analysed for total Fe by ashing in silica crucibles at 480" for 48 h, taking the ash up in warm concentrated hydrochloric acid and diluting to an appropriate volume with distilled water. The Fe content of the resultant solution was measured by AAS using a PU9000 AAS (Pye Unicam, Cambridge) with background correction.
Intestinal loop preparation
The incubation medium for the intestinal loops contained 16 mM-Hepes (Sigma Chemical
Co., Poole, Dorset) together with 125 mM-sodium chloride, 3.5 mM-potassium chloride,
I mM-calcium chloride, 10 mwmagnesium sulphate and 10 mM-D-glucose. The pH was adjusted to 7.4 before use, using 0.1 M-sodium hydroxide. Ferric citrate was prepared using 0.1 M-ferric chloride in 0.1 M-HCI, equilibrating this with 59Fe (FeCl,; Amersham International, Amersham, Bucks) then adding citrate ions as 1.0 M-trisodium citrate so that the ratio, Fe :&rate ions, was 1 : 10, The ferric citrate was diluted with the incubation medium, the resulting ferric citrate concentration being 0.5 mM and 1 pCi 59Fe/ml.
The rats were anaesthetized with sodium pentobarbital (Sagatal; May & Baker Ltd, Dagenham) at 60 mg/kg body-weight. The abdomen was opened and loops of duodenum or ileum prepared, care being taken to ensure an intact blood supply. Duodenal loops were prepared by ligating the intestine 20 mm from the pylorus and 70 mm distally, and ileal loops by ligating the intestine 50 mm and 100 mm proximally from the ileocaecal valve. Before the second ligature was tied off, the loops were filled with approximately 0.5 ml of the test ferric citrate solution by injection from a pre-weighed syringe. The loops were replaced in the abdominal cavity, the incision covered with moist cotton wool and the ambient temperature maintained at approximately 37" under a warming lamp. At 30 min after injection of the solution the loops were excised, the intestinal fluid collected by drainage and the loops rinsed with 20 ml ice-cold incubation medium. The animals were then killed by cervical dislocation.
In order to obtain a measure of mucosal 59Fe content, the loop was placed in a preweighed vial and dried overnight in an oven at 85". It was then counted for radioactivity in the gamma counter for 20 min. All the washings, intestinal fluid and mucosal solutions were counted separately for 20 min. Carcass 59Fe content was measured by counting in the WBC for 1.5 min using appropriate standards to calibrate and correlate the two counters.
Expt 1
Male Wistar weanling rats were allocated to eight groups of fifteen to twenty animals, given the control semi-synthetic diet and trained to meal-feed for 2 weeks. From this time onwards meals were given at 12-h intervals (1 1 .OO and 23.00 hours). Animals in each group were given one 10 g meal of high-Fe (566 mg Fe/kg) or control (36 mg Fe/kg) diet followed, after an interval of 12,24,36,48 or 60 h, by a test meal (TM) of 3 g wholewheat flour (40 mg Fe/kg), extrinsically-labelled with 0.5 pCi "Fe (FeCl,; Amersham International). The 12-hourly meals between the high-Fe or control diet meal and the TM consisted of 10 g control diet. An outline of the experimental design is shown in Table 1.
EfSect
of
iron intakeon Fe
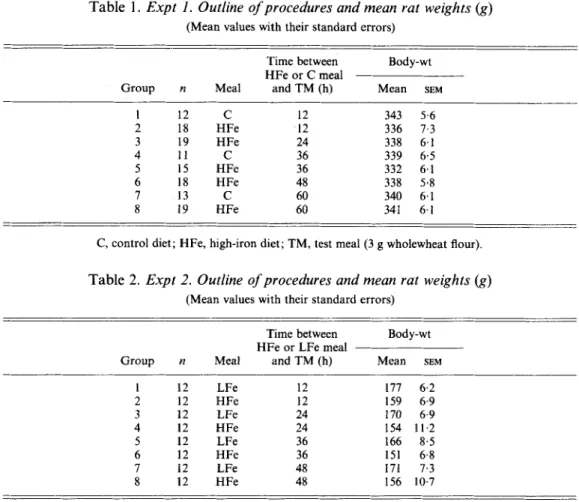
bioavailability 81 Table 1. Expt 1. Outline of procedures and mean rat weights (g)(Mean values with their standard errors)
Time between Body-wt HFe or C meal
Group n Meal and TM (h) Mean SEM
1 12
c
12 343 5.6 2 18 HFe 12 336 7.3 3 19 HFe 24 338 6.1 4 11c
36 339 6.5 5 15 HFe 36 332 6.1 6 18 HFe 48 338 5.8 I 13c
60 340 6.1 8 19 HFe 60 341 6.1C, control diet; HFe, high-iron diet; TM, test meal (3 g wholewheat flour).
Table 2. Expt 2. Outline of procedures and mean rat weights (g) (Mean values with their standard errors)
Time between Body-wt HFe or LFe meal
Group a Meal and TM (h) Mean SEM
1 12 LFe 12 Ill 6.2 2 12 HFe 12 159 6.9 3 12 LFe 24 170 6.9 4 12 HFe 24 154 11.2 5 12 LFe 36 166 8.5 6 12 HFe 36 151 6.8 7 12 LFe 48 171 7.3 8 12 HFe 48 156 10.7
HFe, high-iron diet; LFe, low-Fe diet; TM, test meal (3 g wholewheat flour).
The amount of Fe retained from the TM was measured by counting the animals in the WBC immediately after consuming the meal and again 7 d later and adjusting for radioactive decay; the difference was assumed to be unabsorbed Fe. Any animal that did not consume at least three-quarters of the high-Fe diet, control diet or TM was excluded from the experiment.
Expt 2
This followed a similar regimen to Expt 1, as shown in Table 2, except that the rats were given 10 g low-Fe diet instead of the control diet 12, 24, 36 or 48 h before the TM. In this experiment, meals were given at 08.00 and 20.00 hours.
Expt 3
Fifty male weanling rats were divided into five groups of ten and given different diets as follows: group L28, low-Fe diet for 28d; group H28, high-Fe diet for 28d; group C , control diet throughout; group L3, control diet until 3 d before the intestinal loop investigation when they received the same low-Fe diet as group L28 ; group H3, control diet until 3 d before the intestinal loop investigation when they received the same high-Fe diet as group H28.
82
SUSAN
J. F A I R W E A T H E R - T A I T
A N D O T H E R S 60 .-
z
-
P
.-
I E! 4 0 . W U 20.
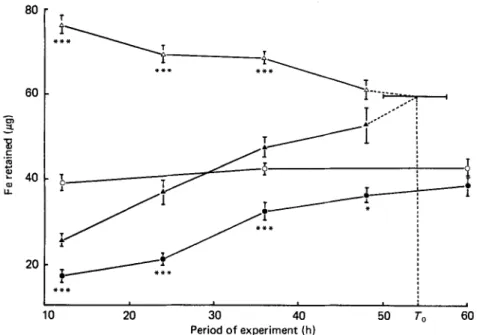
10 20 30 40 50 To 60 Period of experiment (h)Fig. 1. Expts 1 and 2. The amount of iron retained (ug) from a test meal (3 g wholewheat flour) by rats (340g body-weight) given a high-Fe ( 0 ) or medium-Fe ( 0 ) meal 12, 24, 36,48 or 60h before the test meal (Expt I), and by rats (160 g body-weight) given a high-Fe (A) or low-Fe (A) meal 12, 24, 36 or 48 h before the test meal (Expt 2). Points are mean values with their standard errors represented by vertical bars. The estimated time for the mucosal cells to return to equilibrium is shown as &. Mean values significantly different: *P c 0.05, ***P < 0.001.
that they consumed food for 1 h in any 24 h period. Food intakes were measured throughout the experiment. The rats were all fasted for exactly 24 h before the intestinal loop investigation. In each group five rats were used for duodenal loops and five for ileal loops.
Statistical analysis
The Fe retention values from Expt 1 were analysed by Student’s t tests, comparing the HFe groups at each time-period with the overall mean of the control groups (Snedecor & Cochran, 1973). Results from Expt 2 were subjected to multiple linear regression analysis using BMDP P1R (University of California, 1981), with independent variables time and rat weight, grouping variable diet and dependent variable Fe retention. The time to reach equilibrium (To) was calculated by linear regression of the two sets of data, and the precision of the estimate of time to reach equilibrium was calculated from the analysis of variance. Unpaired t tests were performed between the two groups at each time-period.
The duodenal and ileal results from Expt 3 (luminal loss of Fe) were examined separately by two-way analysis of variance with time and diet as the independent variables. Having established that time did not affect luminal Fe loss, the distribution between carcass and gut of SBFe-labelled ferric citrate from the loop was compared by two-way analysis of variance (in terms of proportion in carcass), with diet and site of loop (duodenum or ileum) as the independent variables.
R E S U L T S
Expt 1
Analysis of the diets for Fe (mg Fe/kg) by AAS gave the following results: high-Fe diet
Efect of iron intake
on Fe bioavailability
83
Table 3. Expt 3. Mean body-weights (g) and f o o d intakes
(gig
of rats(Mean values with their standard errors)
Body-wt Food intake
Group Mean SEM Mean SEM
L28 195& 5.2 13.4' 0.48
H28 218b 6.2 16.3b 1.18
C 220b 9.2 14.8& 0.63
L3 221b 7.4 1 5.4b 0.78
H3 2 3 F 7.9 16.3b 0.94
L28, low-iron diet for 28 d; H28, high-Fe diet for 28 d; C, control diet for 28 d; L3, low-Fe diet for 3 d; a*b,c Values within the same column with different superscript letters were significantly different (P < 0.05). H3, high-Fe diet for 3 d.
The amount of Fe retained from the TM (3 g wholewheat flour) at varying times after a high-Fe or control-diet meal is shown in Fig. 1. There was no difference in Fe retention 12, 36 or 60 h after a meal of the control diet. Therefore results from these three groups were combined and an overall mean computed. Results from the groups given a high-Fe meal 12,24,36,48 or 60 h before the TM were compared with the overall mean and a highly significant difference
(P
< 0.001) found at 12, 24 and 36 h. The difference at 48 h was less marked but still significantly different(P
< 0.05), but there was no difference between animals given the high-Fe and control meals at 60 h before the TM.The mean rat weights just before being given the high-Fe and control diets were 337 (SEM 2.8) g and 340 (SEM 3.4) g respectively.
Expt 2
The amount of Fe retained from the TM of 3 g wholewheat flour at varying times after a high- or low-Fe meal is shown in Fig. 1. The difference between groups for Fe retention from the TM was significantly different ( P
c
0.001) at 12, 24 and 36 h but there was no significant difference 48 h after the meal. The estimated time to return to equilibrium (To) was 54.0 (SEM 7.6) h, at which point the estimated retention of Fe was 59.5 pg.Rat weight had no effect on Fe retention within the range observed in this experiment: the mean weight (g) of the high-Fe groups was 155 (SEM 4.4) and the low-Fe groups 171 (SEM 3.6).
Expt 3
Mean body-weights and food intakes for the different groups are shown in Table 3. Rats in group L28 (low-Fe diet for 28 d) yeighed significantly less than those in the other four groups. They also consumed less food than groups H28, L3 and H3. Rats in group H3 were significantly heavier than all the other animals but consumed similar amounts of food to all animals except those in group L28.
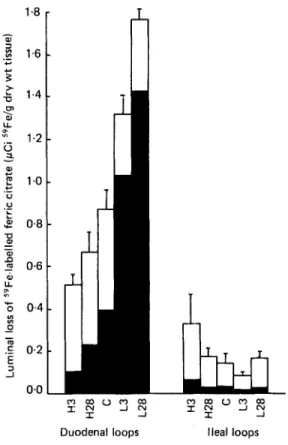
The luminal loss of 59Fe-labelled ferric citrate is shown in Fig. 2. Values are expressed on a dry-weight basis and the distribution between carcass and mucosa is shown for both duodenal and ileal loops. Analysis of variance showed no significant effect of length of time on the diet (3 or 28 d) on luminal loss from duodenal or ileal loops, but the diet (high-Fe, control or low-Fe) significantly affected subsequent loss of 5gFe from the lumen of the duodenum ( P < 0.001). Diet also had a significant effect on the distribution of the 59Fe-labelled ferric citrate taken up from the lumen ( P < 0.001), and whether the loop was duodenal or ileal had a significant effect on the proportional distribution of 5gFe
(P
< 0.001).84
S U S A N
J. F A I R W E A T H E R - T A I T
A N D O T H E R S Y I I I 3+
> 1.4-
m U.
P .- 1.2-
1 0, @ c c 0 0 F 1.0-
._ .- L&
0.8-
P-
- m n s 0.6-
d, '% 0.4-
U P "7 In - gf
-
m ,E 0.2.
J 0.0Duodenal loops Ileal loops
Fig. 2. Expt 3. Luminal loss of 5BFe-labelled ferric citrate from duodenal or ileal loops @Ci "Fe/g dry wt tissue) in rats given a high-Fe (H), control (C) or low-Fe (L) diet during the 3 d (H3, L3) or 28 d (H28, L28) before the in vivo investigation. The proportional distribution of 58Fe between carcass
(m)
and mucosal tissue (0) is also shown. Values are means of five animals per group with their standard errors represented by vertical bars.It is clear from Fig. 2 that considerably more 59Fe was taken up from the lumen using duodenal loops compared with ileal loops and that, in general, a greater proportion of the 59Fe taken up from the lumen was transported to the carcass from duodenal than from ileal
loops.
D I S C U S S I O N
There appears to be a fairly well-defined relation in rats and mice between previous Fe intake and Fe retention from a TM, whereby the amount of Fe influences subsequent Fe retention (Hegenauer et al. 1977; Fairweather-Tait & Wright, 1984). Fig. 1 clearly demonstrates that the time interval between a high-Fe, control or low-Fe meal and the TM is also important. Results from Expt 1 show a statistically significant difference in Fe retention from the TM in rats given a high-Fe or control diet meal 48 h before the TM, but no difference at 60 h. Regression analysis of Expt 2 indicates that the time for the mucosal cells to return to equilibrium (ie. where the two lines would intersect) was 54 (SEM 7.6) h which approximates to mucosal cell turnover time in rats (Lipkin, 1981).
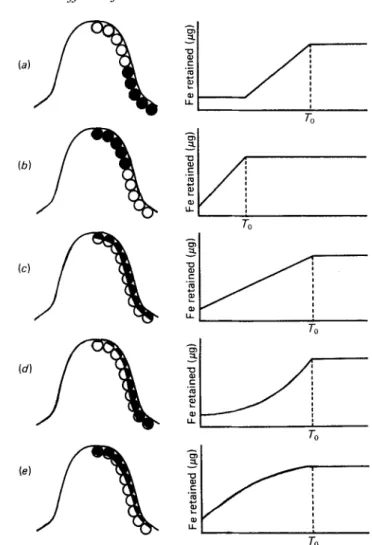
Assuming that short-term control of Fe absorption lies with the mucosal cells, there are five possible models to explain the results of Expt 1 and these are illustrated in Fig. 3. The length of time and rate at which the mucosal cells return to equilibrium when subjected
Efect
ofiron intake on Fe bioavailability
85Fig. 3. Five possible models to explain the way in which mucosal cells subjected to a high-iron meal regulate subsequent Fe absorption. Diagrammatic representations of a villus and its mucosal cells are shown. The capacity for Fe transport is indicated as follows: (O), unchanged;
(a),
partially reduced;(a),
greatly reduced. The time for the cells to return to equilibrium is shown as F (for details, see p. 84).to a high-Fe meal should give some indication of the underlying mechanism: (a) If only immature cells are influenced by the Fe then the time-period for the intestine to return to equilibrium should approximate to the life-span of the epithelial cells but, because the immature cells will not be shed until they reach the tips of the villi, there will be an initial lag before returning to equilibrium. During this time-period the level of Fe uptake from a TM will be constant until the affected cells start to be lost and are replaced by unaffected cells. (b) If only the mature cells are affected To will be greatly reduced. Neither of these
models appear to fit the findings of Expt 1. Models c, d and e assume that all the cells are influenced by the high-Fe meal but to differing extents. In model c, all cells are equally affected whereas, in model d, the immature cells, and in model e the mature cells, are more strongly influenced. These three models give a similar To which would approximate to that
found in Expt 1 but the shapes of the curves would differ. Further experiments are in progress to try to define the most appropriate model to explain the observed effect of a high-Fe meal on subsequent Fe retention from a TM.
86
S U S A N
J. F A I R W E A T H E R - T A I T
A N D O T H E R SSeveral recent papers have presented evidence that transferrin and ferritin are the regulators of intestinal uptake and transfer of Fe. Huebers et al. (1983) suggest that apotransferrin is secreted from mucosal cells into the intestinal lumen where it is saturated with Fe and reabsorbed as the intact complex. Fe is then released from transferrin in the mucosal cell and eventually transferred to the blood stream, whilst the apotransferrin returns to the brush border to be recycled. Johnson et al. (1983) found transferrin in similar amounts in all regions of the small intestine and showed that it was unaffected by Fe-loading but doubled in response to deficiency. Mucosal ferritin, however, was found in greater amounts in the duodenum, increased in Fe-loaded and decreased in Fe-deficient animals. Using intestinal loops they showed that Fe absorption decreased with distance from the pylorus, but there was no effect on mucosal Fe content in the loops. The duodenal Fe absorption increased in response to Fe deficiency and decreased in response to overload; deficiency and overload having been induced by venesection and Fe-dextran injections respectively. The results from Expt 3 are consistent with the findings of Johnson et al. (1983), luminal losses from duodenal loops being greater than ileal losses in every case. The high-Fe diet appeared to suppress the total Fe transported whilst the low-Fe diet enhanced it.
An important finding in Expt 3 is that the promoting or inhibiting effect of a low- or high-Fe diet on Fe absorption by duodenal loops is not any greater when the animals have been fed on the diet for 28 d compared with 3 d. A period of 3 d, therefore, must be sufficient for the mucosal cells to adjust and stabilize at their new baseline level for absorption. This is in agreement with the results from Expts 1 and 2 which indicate that dietary effects last from up to 48-60 h, implying that this time-period on a changed diet is the minimum necessary to ensure that the mucosal cells are fully adapted to the new diet. Results from Expts 1 and 2 indicate that all the mucosal cells are affected to some extent, and Expt 3 shows that the diet effect appears to be mediated by the mucosal cells of the duodenum, luminal losses of 58Fe being much greater from duodenal than from ileal loops. Further work is required to determine whether these effects result from a change in the number of mucosal Fe receptors or in the affinity of the receptors for Fe, a change in the rate of handling of Fe by the mucosal cells, or a combination of these mechanisms.
The authors would like to thank Dr I. T. Johnson for helpful discussion, Mrs J. Cooke for assistance with the animals and diets, Miss R. Girdlestone for atomic absorption spectroscopy, and Dr J. Franklin for statistical advice. T.E.S. is supported by an AFRC research studentship.
R E F E R E N C E S
Fairweather-Tait, S. J. & Wright, A. J. A. (1984). British Journal of Nutrition 51, 185-191.
Hegenauer, J., Ripley, L. & Saltman, P. (1977). In Proteins of Iron Metabolism, pp. 403410 [E. B. Brown, P. Huebers, H. A., Huebers, E., Csiba, E., Rummel, W. & Finch, C. A. (1983). Blood 61, 283-290.
Johnson, G., Jacobs, P. & Purves, L. R. (1983). Journal of Clinical Investigation 71, 1467-1476.
Lipkin, M. (1981). In Physiology of the Gastro-intestinal Tract, p. 147 [L. R. Johnson, editor]. New York: Raven Snedecor, G. W. & Cochran, W. G. (1973). Statistical Methods, 6th ed., p. 59. Ames, Iowa: Iowa State University University of California (1981). In BMDP Statistical Software [w. J. Dixon, editor]. London: University of
Aisen, J. Fielding and R. R. Crichton, editors]. New York: Grune and Stratton.
Press. Press.
California Press.