Université de Montréal
IMPACT OF THE PULVINAR ON THE VENTRAL
PATHWAY OF THE CAT VISUAL CORTEX
par Bruno Oliveira Ferreira de Souza
École d’Optométrie
Thèse présentée
en vue de l’obtention du grade de PhD en Sciences de la Vision
option neurosciences de la vision et psychophysique
Février, 2019
Résumé
Les signaux provenant de la rétine sont relayés dans le corps géniculé latéral où ils sont envoyés au cortex visuel primaire. L’information passe ensuite à travers plusieurs aires visuelles où la complexité du traitement augmente progressivement. Des données tant anatomiques que fonctionnelles ont démontré l’existence de deux voies principales qui traitent différentes propriétés de l’information visuelle : les voies dorsale et ventrale. Les aires corticales composant la voie dorsale sont impliquées principalement dans le traitement du mouvement tandis que les aires de la voie ventrale sont impliquées dans le traitement de la forme et de la couleur. Cette vision classique de l’organisation fonctionnelle du cortex est toutefois remise en question par l’existence de connections réciproques entre les aires corticales visuelles et le pulvinar, un noyau thalamique. En effet, ces connections permettent la création d’une voie trans-thalamique parallèle aux connections cortico-corticales à travers la hiérarchie visuelle.
Le but principal de la présente thèse consiste en deux volets : le premier est d’obtenir une meilleure compréhension du traitement des incréments et décréments de la lumière dans une aire de la voie ventrale du chat (aire 21a); le second est de caractériser la nature des inputs thalamo-corticaux du noyau latéral postérieur (LP) à l’aire 21a chez le chat.
Dans l’étude #1, nous avons investigué le profil spatiotemporel des réponses des neurones de l’aire 21a aux incréments (blancs) et décréments (noirs) de lumière en utilisant l’analyse de corrélation inverse d’un stimulus de bruit épars. Les neurones de l’aire 21a ont répondu plus fortement aux stimuli noirs, en montrant des champs récepteurs avec des sous-champs noirs plus larges. Cependant, aucune différence n’a été trouvée en ce qui concerne les dynamiques temporelles des réponses aux blancs et aux noirs. En comparaison avec le cortex visuel primaire, la préférence aux stimuli noirs dans l’aire 21a s’est avérée fortement augmentée. Ces données indiquent que les asymétries entre les réponses aux blancs et aux noirs sont transmises et amplifiées à travers la voie ventrale.
Dans l’étude #2, nous avons investigué l’impact de l’inactivation pharmacologique réversible du noyau LP sur la fonction de réponse au contraste (CRF) des neurones de l’aire 21a et du cortex visuel primaire (aire 17). L’inactivation a eu différents effets dans les deux aires
corticales. Alors que, dans l’aire 17, l’inactivation du LP a causé une légère réduction du gain de la réponse, une forte augmentation a été observée dans l’aire 21a. Ainsi, nos résultats suggèrent que le LP exerce une influence modulatrice dans le traitement cortical à travers la voie ventrale avec un impact plus important dans des aires extrastriées de plus haut niveau. Nos résultats ont permis d’avoir une meilleure compréhension des propriétés fonctionnelles de la voie ventrale du chat et de contribuer à enrichir les connaissances actuelles sur le rôle du pulvinar dans le traitement cortico-thalamo-cortical de l’information visuelle.
Mots-clés : aire 21a, cortex visuel primaire, corrélation reverse, noyau latéral postérieur, réponse au contraste, électrophysiologie, inactivation thalamique.
Abstract
Signals from the retina are relayed to the lateral geniculate nucleus from which they are sent to the primary visual cortex. At the cortical level, the information is transferred across several visual areas in which the complexity of the processing increases progressively. Anatomical and functional evidence demonstrate the existence of two main pathways in visual cortex processing distinct features of the visual information: the dorsal and ventral streams. Cortical areas composing the dorsal stream are implicated mostly in motion processing while those comprising the ventral stream are involved in the processing of form and colour. This classic view of the cortical functional organization is challenged by the existence of reciprocal connections of visual cortical areas with the thalamic nucleus named pulvinar. These connections allow the creation of a trans-thalamic pathway that parallels the cortico-cortical communications across the visual hierarchy.
The main goal of the present thesis is twofold: first, to obtain a better comprehension of the processing of light increments and decrements in an area of the cat ventral stream (area 21a); second, to characterize the nature of the thalamo-cortical inputs from the cat lateral posterior nucleus (LP) to area 21a.
In study #1, we investigated the spatiotemporal response profile of neurons from area 21a to light increments (brights) and decrements (darks) using a reverse correlation analysis of a sparse noise stimulus. Our findings showed that 21a neurons exhibited stronger responses to darks with receptive fields exhibiting larger dark subfields. However, no differences were found between the temporal dynamics of brights and darks. In comparison with the primary visual cortex, the dark preference in area 21a was found to be strongly enhanced, supporting the notion that the asymmetries between brights and darks are transmitted and amplified along the ventral stream. In study #2, we investigated the impact of the reversible pharmacological inactivation of the LP nucleus on the contrast response function (CRF) of neurons from area 21a and the primary visual cortex (area 17). The thalamic inactivation yielded distinct effects on both cortical areas. While in area 17 the LP inactivation caused a slight decrease in the response gain, in area 21a a strong increase was observed. Thus, our findings suggest that the LP exerts a modulatory influence on
the cortical processing along the ventral stream with stronger impact on higher order extrastriate areas.
Taken together, our findings allowed a better comprehension of the functional properties of the cat ventral stream and contributed to the current knowledge on the role of the pulvinar on the cortico-thalamo-cortical processing of visual information.
Keywords: area 21a, primary visual cortex, reverse correlation, lateral posterior nucleus, contrast response, electrophysiology, thalamic inactivation.
Table of contents
Résumé ... i
Abstract ... iii
Table of contents ... v
List of Tables ... vii
List of Figures ... viii
Abbreviations ... xi
Acknowledgements ... xiv
Introduction ... 1
1 The organization of the visual system ... 2
2 Visual cortex ... 5
2.1 The primary visual cortex ... 6
2.2 The neuron receptive field ... 7
2.2.1 The reverse correlation method ... 10
2.3 The response to contrast... 14
3 The cortical hierarchy ... 17
3.1 The dorsal visual stream ... 20
3.2 The ventral visual stream ... 21
3.2.1 The cat area 21a ... 22
3.3 Perception and action ... 24
4 The visual thalamus ... 25
4.1 Drivers and modulators ... 26
4.2 First and higher order thalamic nuclei ... 29
4.2.1 Higher order nuclei and the transthalamic pathway ... 30
4.3 The pulvinar ... 32
4.3.1 The primate pulvinar ... 33
5 Objectives and hypotheses ... 41
5.1 Article 1: Spatiotemporal processing of brights and darks in cat area 21a ... 41
5.2 Article 2: The impact of the pulvinar inactivation on the contrast response function of cat areas 17 and 21a. ... 41
6 Article # 1 ... 43
7 Article # 2 ... 74
8 Discussion ... 144
8.1 Results summary ... 145
8.1.1 Processing of brights and darks in area 21a ... 145
8.1.2 Impact of pulvinar inactivation on the CRF of neurons from area 17 and 21a .. 146
8.2 Methodological considerations ... 148
8.2.1 The animal model ... 148
8.2.2 Electrophysiological recordings of cortical neurons ensembles ... 150
8.2.3 Reversible thalamic inactivation ... 152
8.3 Functional implications ... 154
8.3.1 The processing of light increments and decrements in the cat ventral stream.... 154
8.3.2 The role of pulvinar in the ventral stream ... 158
8.4 Future investigations ... 162
8.4.1 The origin of the response profile of 21a neurons to brights and darks ... 162
8.4.2 Further characterization of 21a neuronal properties ... 163
8.4.3 The role of LP on the cortical oscillations in the cat ventral stream ... 164
9 Conclusion ... 165
10 References ... i
List of Tables
Table S1. Effect of LPl inactivation on the CRF parameters of neurons from area 17.……..141 Table S2. Percentage of variation (%Var) of CRF parameters of neurons from area 17 during LPl inactivation.………...………141 Table S3. Percentage of variation (%Var) of CRF parameters of neurons from area 17 during LPl inactivation as a function of the cortical laminar position and neuronal physiological properties………..142 Table S4. Effect of LPl and LPm inactivation on the CRF parameters of neurons from area 21a …………..………....142 Table S5. Percentage of variation (%Var) of CRF parameters of neurons from area 21a during LPl and LPm inactivation as a function of the spike waveform classification - regular (RS) and fast-spiking (FS) cells- and laminar position – superior (Sup) vs deep layers………...143
List of Figures
INTRODUCTIONFigure 1. Representation of the cat LGN and the main retinal inputs (X,Y and W) projecting to the magnocellular (A, A1 and Cm) and parvocellular layers (Cp) ... 4 Figure 2. Hubel and Wiesel’s view of the receptive field of a V1 simple cell. ... 7 Figure 3. Representation of the centre surround organization of the receptive fields of ON-center (A) and OFF-ON-center (B) ganglion cells showing the modulation of the neuronal activity (vertical traces) depending on the position of the visual stimulus (light spot). ... 8 Figure 4. Examples of receptive fields (top) and orientation tuning curves (bottom) from simple cells of the ferret primary visual cortex ... 10 Figure 5. Diagram representing the reverse correlation algorithm. ... 11 Figure 6. The Naka-Rushton function and three examples of changes in the contrast response profile ………16 Figure 7. Hierarchy of the cat visual system. ... 18 Figure 8. Diagram of the visual streams of the primate visual cortex ... 19 Figure 9. Organization of orientation (top) and direction (bottom) of areas 18 and 21a revealed by optical imaging of intrinsic signals. ... 24 Figure 10. Functional and morphological features of drivers and modulator thalamic inputs. 28 Figure 11. Representation of the primate pulvinar with its main subdivisions ... 35 Figure 12. Hypothetical scheme of the nature of cortico-thalamo-cortical connections (d: drivers; m: modulators) involving the LP-pulvinar and the cortical areas 17 and 21a. ... 42 ARTICLE #1
Figure 1. Spatiotemporal profile of responses to bright (red) and dark (blue) stimuli………..53 Figure 2. Histogram of ON/OFF ratio (log(SNRbright/SNRdark))….………..54 Figure 3. Analysis of spatial parameters extracted from RF maps………55 Figure 4. Correlation matrix between spatial parameters (SOI, normalized distance, and SSI) and ON/OFF ratio (log(SNRbright/SNRdark))………..57 Figure 5. Temporal analysis of 21a neurons’ responses to brights and darks………...58 Figure 6. Spike waveform classification………..………....60
Figure 7. Schematic representation of two putative mechanisms giving rise to the response
profile in area 21a and PMLS cortex……….65
ARTICLE #2 Figure 1. Hypothetical scheme of the nature of pulvino-cortical inputs to the primary visual cortex and an extrastriate area……….79
Figure 2. Effects of the reversible inactivation of LPl on the contrast response function (CRF) of three neurons from area 17……….92
Figure 3. Impact of LPl inactivation on the CRF parameters Rmax and baseline of neurons from area 17………94
Figure 4. Comparison the percentage of variation (%Var) of the CRF parameters Rmax and baseline of neurons from area 17………95
Figure 5. Comparison the percentage of variation (%Var) of Rmax and slope of neurons from area 17 in function of their physiological properties and cortical laminar position……….………..96
Figure 6. Effects of the reversible inactivation of LP on the contrast response function (CRF) of four neurons from area 21a……….…99
Figure 7. Impact of LP inactivation on the CRF parameters Rmax and baseline of neurons from area 21a………....100
Figure 8. Comparison the percentage of variation (%Var) of Rmax and baseline between area 17 and 21a during LP inactivation………103
Figure 9. Modelling the transthalamic pathway………..…………...105
Figure 10. Scheme of the nature of pulvino-cortical connections with the primary visual cortex and an extrastriate area based on our findings………...111
Figure S1. Validation of GABA injection in LP nucleus……..………..136
Figure S2. Spike waveform classification………....137
Figure S3. Settings of the transthalamic pathway ………138
Figure S4. Reciprocal connections provide a symmetrical solution when the net effect of GABA in the LP is inhibitory………...139
Figure S5. Workflow of exclusion criteria used in the study………140
Abbreviations
1D, 2D, 3D: One, two, three dimensions AchE: Acethylcholinesterase
AEV: Anterior ectosylvian area
ALLS: Anterior lateral suprasylvian cortex
AMPA: α-amino-3-hydroxy-5-methyl-4-isoxazolepropionic acid BA: Bright subfield area
BARS: Bayesian adaptive regression splines Cb: Center of mass of bright subfield
Cd: Center of mass of dark subfield CI: Confidence interval
Cm: Magnocellular layers Cp: Parvocellular layers.
CRF: Contrast response function Ctr: Control
DA: Dark subfield area DC: Direct current
dLGN: Dorsal part of the lateral geniculate nucleus ECG: Electrocardiogram
EPSP: Excitatory postsynaptic potential FFN: Feedforward network
FS: Fast spiking
GABA: Gamma-Aminobutyric Acid GABAa: Ionotropic GABA receptor GABAb: Metabotropic GABA receptor GUI: Graphical user interface
Inj: Injection
LGN: Lateral geniculate nucleus LP: Lateral posterior nucleus LPl: Lateral part of LP
LPm: Medial part of LP MT: Middle temporal area
NMDA: N-Methyl-D-aspartic acid OA: Overlapped area
PCA: Principal component analysis PI: Inferior pulvinar
PIp, PIm, PIcm, PIcl: Posterior, medial, central medial and central lateral parts of PI. PLLS: Posterior lateral suprasylvian cortex
PLvl: Ventrolateral part of the lateral pulvinar PMLS: Posteromedial lateral suprasylvian cortex PSTH: Peri-stimulus time histogram
RDK: Random dots kinematogram Rec: Recovery
RF: Receptive field RS: Regular spiking
SEM: Standard error of the mean SNR: Signal to noise ratio SOI: Subfield overlap index SSI: subfield size index.
TEO: Posterior part of the inferotemporal cortex TMS: Transcranial magnetic stimulation
UN: Unclassified
V1, V2, …: cortical visual areas (primary, secondary...) VLS: Ventral lateral suprasylvian area
Ao meu mentor, compadre e amigo, Professor Dr Fabrício Bezerra de Sá
Acknowledgements
First, I would like to express my gratitude to my supervisor, Dr Christian Casanova, who, despite his heavy schedule, found the time to discuss and to give me valuable guidance in my research endeavours. I would like to thank my co-supervisor, Dr Frédéric Lesage for his support and availability which was of great help, mainly in the first years of my PhD.
I would like to present my special thanks to my PPPPPG partner #1, M Thomas, who always participated actively in my research projects, motivated me to push my limits and to see through the BS factor. It was an honor to work with you, my friend. A special thanks to my friend and PPPPPG partner #2, Samuel. You always encouraged me and taught me to see the bright side in every dark moment during my research. Thank you both, my PPPPPG partners. I am still confident that we are in the right track regarding our Cervidae brain-debugging project. Thank you, Geneviève, for your valuable support. Without your help, it would be impossible to carry out all the projects that I worked on.
Thanks to my friend, Jimmy, for having my back during the long hours of cat experiments and virtual battles.
I extend my sincere thanks to Reza, Azadeh, Alexandre Castonguay and Marianne Groleau for being so kind and always generous with their time to help me during my first moments in the lab.
My special thanks to Fred. Unfortunately, we did not work together, but I enjoyed having another Arduino enthusiast to talk to. Your dedication to science greatly inspired me.
Thanks to all my friends from the other labs: Bruno, Mira, Jun, Rafael and Jesse. A special thanks to Robyn and Thomas, that always took the lead to organize our extra-curricular activities. Nothing would have happened without you.
My sincere thanks to Jeroen and Julie for the great moments that we spent together in and outside the lab.
I also extend my sincere gratitude to the following former and present members of the school staff: Mme Guitouni, Mme Bélanger, Mme Oriol, M Fethy, Mme Ginette Parent, Sabine
Demosthènes, Mme Chantal, Mme Nicole and François for their support and assistance during my PhD.
A special thanks to my friend Umit. You always applied the same scientific rigor in the analysis of the most mundane subjects. It was great to work with you.
Thanks to my lab colleagues Nelson, Olivia and Visou. My special thanks to Nelson. Thank you for the significant help with my project and for the several interesting discussions. Thanks to Olivia for the huge help with the corrections of my thesis. Thanks to Visou for the help with my cat experiments. It was a valuable experience to work with you guys.
My sincere thanks to my Sabine who had the patience and wisdom to deal with the several nervous breakdowns from a PhD student at his final years. Thanks to Mme Laurie and M Pierre for the encouragement.
And finally, but not least, I am deeply grateful to my mother, Edna, for the emotional and moral support given to me my whole life.
Introduction
The visible light constitutes a small fraction of the electromagnetic spectrum. The survival of most life forms on earth depends directly or indirectly on their interactions with light. For instance, plants use light to generate energy through photosynthesis, while animals use vision, along with other sensorial systems, to probe their surroundings.
The eye is the sensory organ of the visual system. The eye’s anatomy and function intrigued scientists for centuries. Since then, several aspects of the eye’s development, anatomy and functions were unraveled (Gehring, 2014). Nonetheless, a perfect understanding of how the eye works is not sufficient to explain how vision works. Indeed, the eye presents only the first steps in order to understand the phenomenon of vision. The visual information generated in the back of the eye (i.e. the retina) is carried across the optic nerve to the brain. In the brain, networks of neurons are responsible for the transformation of the visual signal originated in the eye to create the visual perception in order to guide behaviour (Kandel et al., 2000). To date, several aspects of the structure and function of these neuronal networks remain unknown. Nonetheless, the study of the visual system allowed not only a better comprehension of the several mechanisms underlying visual perception, but also contributed to the understanding of neuronal mechanisms involved in distinct processes of brain function.
In this thesis, I will present the results from our research which focuses on different aspects of the cortical processing of visual information in cats. More specifically, one study explores the functional properties of an extrastriate cortical area (area 21a). In a second study, we investigated the implications of the inactivation of the Pulvinar (a thalamic nucleus involved in visual processing) on the activity of area 21a and the primary visual cortex (area 17).
1 The organization of the visual system
In this section, I will explore the current knowledge on the structure and function of the visual system in mammals. I will briefly address the organization of subcortical key structures that compose the retino-geniculo-cortical pathway, before focusing on the structure and function of the visual cortex. Since the cat constituted the animal model used in my research, several aspects of the visual system of this species will be addressed in more detail. However, the visual system of other species will be addressed for comparison purposes.
The retina lies on the fundus of the ocular globe and represents the first stage of the visual system where the information is transformed from light (photons) to electro-chemical signals that are conveyed to the cortex via the thalamus. Often regarded as an extension of the central nervous system, the retina is organized in strata consisting of different neuronal types and glial cells. In the outermost layer of the retina are located the light-sensitive cells (photoreceptors) responsible for transforming the light in electric impulses. In the absence of light, the photoreceptors are maintained in a depolarized state and once the light reaches its outer segments, the photoreceptor hyperpolarizes initiating the transmission of the visual information. The signal is then modulated throughout the synapses with different neuronal types and finally reaches the ganglion cell layers from which the information is sent to the thalamus through the optic nerve (Kandel et al., 2000).
Signals originating from the retina are heterogenous in nature. Based on electrophysiological recordings of ganglion cells, optic nerve fibres and thalamic neurons, three distinct types of functional routes were identified: X, Y and W pathways. These pathways are classified based on their physiological properties that are linked to different morphological types of ganglion cells, the beta, alpha and gamma cells, respectively. Neurons from the X pathway are characterized by exhibiting a burst response followed by a tonic response to high spatial frequencies at low temporal frequencies. In contrast, the Y cells exhibit mainly a burst response to stimuli with low spatial frequencies at high temporal frequencies (Enroth-Cugell and Robson, 1966; Ferster, 1990). The X and Y pathways process fairly distinct features of the visual scene. X cells are responsible for the processing of fine details, such as shape and colour while Y cells are good movement detectors. Furthermore, recordings of the optical nerve showed that the
temporal dynamics of X and Y cells differ, in which Y fibres transmit the action potentials faster than X fibers (Ferster, 1990). In other words, the Y pathway provides the cortex with a fast information about sudden changes in the visual scene (i.e. if something moved), while later the X pathway informs the visual cortex about the details of the visual scene (i.e. what moved). The less investigated W pathway is characterized by cells whose responses are frequently described as “sluggish” and exhibiting features that are in between the X and Y (Payne and Peters 2002). The signals from the retina are conveyed to the cortex via the thalamus. Axons from the optic nerve make synapses with two main subcortical structures, the superior colliculus and the dorsal part of the lateral geniculate nucleus (dLGN). The superior colliculus, located in the mesencephalon, is largely connected with subcortical structures and is associated with oculomotor control, while the dLGN represents the main thalamic relay transmitting the visual information to the primary visual cortex (Laties and Sprague, 1966; Matteau et al., 2003; Meikle and Sprague, 1964; Niimi and Sprague, 1970).
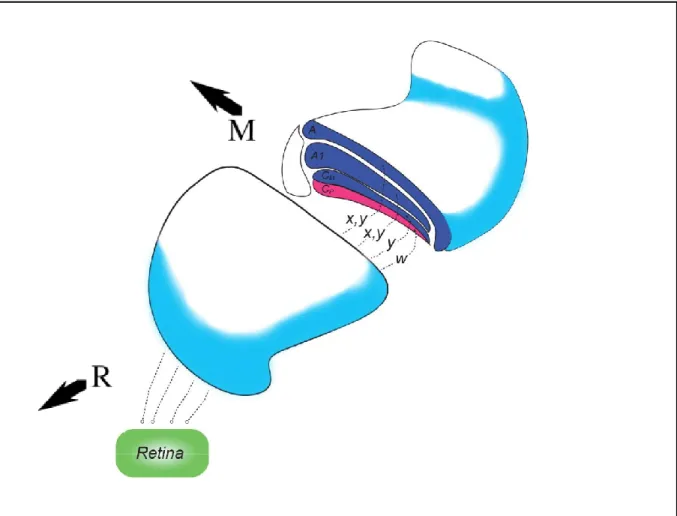
The cat dLGN is located dorso-laterally in the thalamus and has a sigmoid shape antero posteriorly. The nucleus is organized in layers divided in two main regions based on the size of the cell bodies: magnocellular and parvocellular. The magnocellular region covers the dorsal part of the dLGN and is constituted of three distinct layers: A, A1 and Cm. The parvocellular region is located ventrally to the Cm layer and is also comprised of three layers: C1, C2 and C3. These are more compact and their boundaries less distinguishable than the magnocellular layers and are often considered as one layer (Cp). The retinal input to each layer is alternated between the nasal part of the contralateral and the temporal part of the ipsilateral retina. This anatomical segmentation parallels the functional segregation of the distinct pathways originated at the retina. The layers A and A1 receive X and Y signals while layer Cm receives Y signals only. The W pathway makes synapses mostly with the parvocellular layers. A similar organization pattern is observed in the macaque monkey where the Magno, Parvo and Koniocellular fibres from the retina arrive at their respective layers in dLGN (Payne and Peters 2002, Figure 1).
Figure 1. Representation of the cat LGN and the main retinal inputs (X,Y and W) projecting to the magnocellular (A, A1 and Cm) and parvocellular layers (Cp). Adapted from Payne and Peters (2002). R: rostral; M: medial.
Another level of organization found in the dLGN is its retinotopy. In brief, a retinotopic organization is achieved when neighbouring ganglion cells in the retina project to neighbouring neurons in the dLGN creating a topographic map of the visual space. Indeed, the two-dimension representation of the visual space from each retina is distributed in the 3D volume of both dLGN where the elevation is represented in the antero-posterior axis and the azimuth is represented in the latero-lateral axis (Naito, 1986; Sanderson, 1971).
The dLGN consists of two main cellular types: relay neurons and interneurons. Differences between these neurons lie mainly on their connectivity pattern and on the nature of these connections (e.g., neurotransmitters and receptor types). Regarding the connectivity of dLGN neuronal types, the relay neurons are the only ones establishing synapses with the visual cortex, and therefore, are responsible for conveying the message to the cortex. The interneurons are
mostly connected with the relay neurons and with themselves. The relay neurons are excitatory in nature using glutamate as a neurotransmitter. On the other hand, the interneurons are inhibitory and use the neurotransmitter GABA. Although, the dLGN is often seen as a simple relay of the retinal signals to the cortex, the activity of relay neurons is modulated by the local circuitry of interneurons as well as by feedback cortical projections. Therefore, this view remains an oversimplification of the dLGN function. It is noteworthy to mention that other thalamic nuclei are equally directly or indirectly involved in the processing of the visual information. For instance, the pulvinar represents an important thalamic nucleus involved in the cortical visual processing (Sherman, 2017). The main structural and functional characteristics of this nucleus will be addressed in section 4.3.
Although the information originating from the retina is modulated at the dLGN, the output remains segregated (i.e. X and Y pathways) until it reaches the primary visual cortex. This underlies a common feature of the sensorial system in which distinct signals are conveyed to the brain in a parallel fashion. Then, at the cortical level, the signals are extensively converged and passed to higher levels of processing in order to construct the full perceptual visual experience (Nassi and Callaway, 2009).
In the next section, I will explore the organization and function of the visual cortex with an emphasis on the different neuronal properties that arise at the primary visual cortex as well as the main features of extrastriate areas and their connectivity.
2 Visual cortex
The neocortex is the latest structure to be developed in brain evolution. For most vertebrates, the cortex is composed of distinct functional areas in which different neuronal types are organized in layers. In addition, the visual cortex is classically viewed as organized in an hierarchical manner, where the complexity of information increases from one area to another, culminating with the perceptual visual experience. The primary visual cortex represents the first level of processing of visual signals coming from the thalamus, and its basic structure and neuronal properties will be addressed.
2.1 The primary visual cortex
The primary visual cortex of the cat is composed of two areas: areas 17 and 18 (Payne and Peters 2002). At a first glance, it seems odd that two distinct areas share the first stage of cortical processing of visual information instead of one single area, as the primate V1. That is mainly due to the fact that both areas are targeted by the main afferents originating from the dLGN. The thalamic input into those areas differ significantly. Area 17 receives mostly signals from the X and Y pathways, while area 18 is mostly innervated by Y fibres (Humphrey et al., 1985; Stone and Dreher, 1973). All dLGN fibres arrive to layer 4 of the primary visual cortex (Freund et al., 1985). The local neuronal circuitry, along with long-range synapses from other cortical areas, transforms the signal originating from thalamus, which is passed along the cortical hierarchy and also to subcortical visual structures (Hubel and Wiesel 1962; Updyke 1977).
The convergence of thalamic inputs into neurons in the primary visual cortex gives rise to new properties that are absent in the lower levels of the visual system. Classical experiments performed in cats and monkeys by Hubel and Wiesel in the 1960’s demonstrated that neurons from the primary visual cortex fire when a bar is presented only at specific orientations, while neurons from the dLGN do not express selectivity for any orientation of the stimulus (Hubel and Wiesel 1962; Hubel and Wiesel 1968). These studies demonstrated that the signals from the dLGN are integrated at cortical level conferring a new feature (orientation selectivity) that lacks at precedent stages of the visual processing (Figure 2). The study of these neuronal properties, in addition to the knowledge of the cortical connectivity, allowed scientists to better comprehend the mechanisms underlying the cortical processing of visual information.
Figure 2. Hubel and Wiesel’s view of the receptive field of a V1 simple cell. On the left, the representation of the spatial profile of the neuron’s receptive field showing a ON region (crosses) flanked by two OFF regions (triangles). On the right, diagram showing the origin of the simple cell’s receptive field by the integration of signals from different dLGN neurons. Adapted from Hubel and Wiesel (1962).
2.2 The neuron receptive field
The concept of receptive field (RF) was first used in vision in the late 1930s by Hartline (1938) to describe the area in the retinal surface that, when illuminated, elicits a neuronal response. Since then, the concept was applied to all areas of the visual system and it has been updated in order to cope with the increasing complexities of neurons across cortical areas (David et al., 2006; DeAngelis et al., 1993a; Jones et al., 1987; Livingstone et al., 2001).
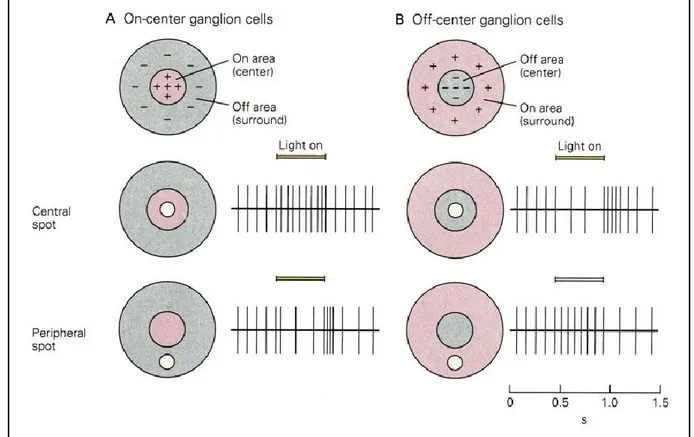
Receptive fields of retinal ganglion cells and dLGN neurons are organized in two concentric regions responding to opposite stimuli. For example, some ganglion cells respond to a light spot directed at the centre of its RF (ON-center), but when the light is positioned at the surround region, the neuron’s firing rate is significantly reduced. On the other hand, OFF-center neurons are inhibited by a light spot on its centre and stimulated when the light is positioned at the surround area (Figure 3). This type of RF organization is known as the centre surround (Kuffler, 1953) and this spatial organization represents the building blocks for the construction of more complex RFs found in the visual cortex (Hubel and Wiesel, 1968).
Figure 3. Representation of the centre surround organization of the receptive fields of ON-center (A) and OFF-center (B) ganglion cells showing the modulation of the neuronal activity (vertical traces) depending on the position of the visual stimulus (light spot). From Kandel, Schwartz, and Jessell (2000).
As in the X/Y pathways introduced in section 1, light increments (ON) and decrements (OFF) are equally processed in parallel throughout the early visual system (Hartline, 1938; Kuffler, 1953). In addition, an asymmetry in the processing of ON and OFF channels is observed early in the visual system. For instance, in the retina, neurons encode OFF signals faster than ON (Burkhardt, 2011; Burkhardt et al., 1998; Copenhagen et al., 1983; Nichols et al., 2013). Those differences are preserved in the LGN and in neurons from layer IV of the primary visual cortex (Jin et al., 2011, 2008; Komban et al., 2014). Additionally, evidence suggests that the differences between ON and OFF pathways are preserved throughout the visual cortex (Chubb and Nam, 2000; Komban et al., 2011, 2014; Motoyoshi et al., 2007).
In the primary visual cortex, neurons respond differently to ON and OFF signals. Two main cell types can be identified based on the spatial arrangement of ON/OFF responses: simple and complex cells. Simple cells are characterized by having RFs with ON and OFF subregions located next to the other. For instance, when a light bar was positioned over a ON region, the
neurons discharged, but when the bar was extended to the adjacent OFF region the response was reduced, showing that the concomitant stimulation of opposite regions cancel each other. On the other hand, complex cells exhibit a distinct RF organization in which ON and OFF subregions are superimposed. In this case, once a light bar is drifted across the RF, the neuron exhibits a sustained response independent of the position of the stimulus (Hubel and Wiesel 1962). The RF structure from neurons of the primary visual cortex is directly linked with basic properties of those neurons. For instance, simple cell RFs are elongated and oriented at a particular angle. Interestingly, when a light bar is drifted across the RF, the neuron maximal discharge is obtained when the bar is positioned at the RF’s orientation, giving rise to an orientation selectivity tuning (Figure 4). Furthermore, the size and the number of ON and OFF RFs’ subregions is associated with the neuron’s spatial frequency selectivity (Jones and Palmer, 1987). Since the early work from Hubel and Wiesel (1962), different approaches were used to study the neuronal properties of the primary visual cortex. For instance, drifting sinusoidal gratings were extensively used to characterize the RF properties from cells of the primary visual cortex. Due to the nature of the stimulation, the response to the gratings can be easily assessed by Fourier transformation. Indeed, previous studies showed that neurons from the cat primary visual cortex can be classified based on the linearity of the response to drifting gratings (De Valois et al., 1982; Movshon et al., 1978a; Skottun et al., 1991). For instance, linear responses correspond to neurons that are highly modulated by the stimulus, whereas neurons with non-linear profiles are poorly modulated. These response profiles are associated with the RF structure-based classification in simple (high modulation) and complex (low modulation) cells previously proposed by Hubel and Wiesel (Skottun et al., 1991) and are used in the classification of neurons from the primary visual cortex. In addition, the Fourier decomposition of the responses to gratings were previously used to create a 2D spectral structure of simple cells receptive fields (Jones et al., 1987). The method used in the study allowed the researchers to investigate the assumption that the spatial frequency and orientation selectivity were the result of two separate processes. Interestingly, they have found that was not the case, suggesting that the spatial frequency and orientation are interdependent.
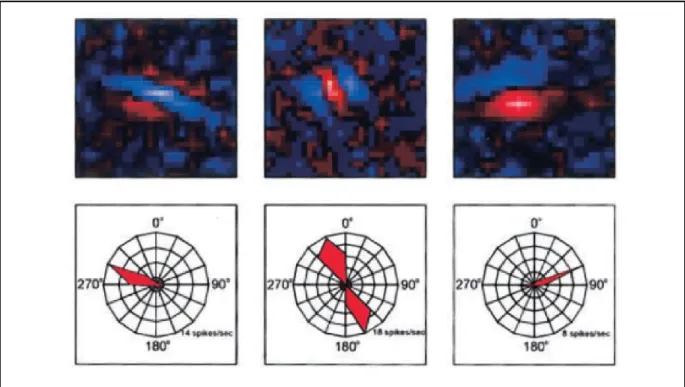
Figure 4. Examples of receptive fields (top) and orientation tuning curves (bottom) from simple cells of the ferret primary visual cortex. From Usrey, Sceniak, and Chapman (2003).
2.2.1 The reverse correlation method
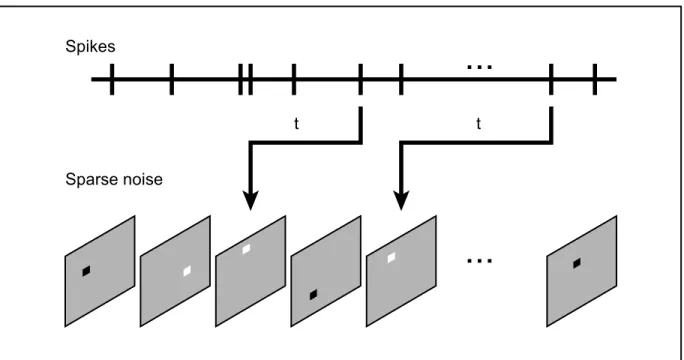
As introduced above, several properties of visual neurons were characterized by the analysis of the average neuronal response to distinct visual stimuli, such as drifting light bars or sinusoidal gratings. Despite this, most of these approaches do not fully take into account the 3D structure of the receptive field: the 2D spatial domain and the time domain (DeAngelis, Ohzawa, and Freeman 1995). In order to address this issue, different methods have been used to provide a more comprehensive description of the receptive field features of neurons in the visual cortex. For instance, the sparse noise reverse correlation technique has been successfully used in the characterization of neurons from the primary visual cortex (J. P. Jones and Palmer 1987, Figure 5). This method was used in a set of experiments for this thesis in order to characterize the RF profile of neurons from a higher cortical area of the cat (study #1).
The reverse correlation method consists in the cross correlation of a neuron’s action potentials (spikes) with stimuli previously presented in a predetermined time window (Jones and Palmer, 1987). In this method, the correlation of the spikes with the preceding visual stimuli gives an approximation of a neuron’s RF (Eggermont et al., 1983). This procedure is undertaken as a
function of time, which creates an estimate of the spatiotemporal (3D) RF structure (DeAngelis, Ohzawa, and Freeman 1993a).
A variety of visual stimuli has been used to assess the RF structure using the reverse correlation method (Borghuis et al., 2003; DeAngelis et al., 1993a; Nishimoto et al., 2006; Pack et al., 2006; Ringach et al., 1997). For instance, in our study #1, the spatiotemporal RF of 21a neurons was obtained using a sparse noise stimulus. The stimulus consisted on a pseudo-random sequence of small white and black squares briefly presented over a gray screen (Figure 5). This visual stimulus tends to have a small effective energy (Reid et al., 1997). Thus, there is a minimum stimulus size and duration of presentation in order to reliably elicit a spike (DeAngelis et al., 1993a; Reid et al., 1997). Another aspect of the sparse noise reverse correlation that should be taken into consideration is the number of stimuli presented. This method is sensitive to the absolute number of spikes generated by the dark and bright stimuli and a considerable number of repetitions (20 to 50 presentations) is necessary to generate reliable spatiotemporal RF maps (DeAngelis et al., 1993a; Jones and Palmer, 1987; Reid et al., 1997).
Figure 5. Diagram representing the reverse correlation algorithm. The spikes are correlated with the preceding visual stimulus (sparse noise) at different time delays (t). Inspired by (Yeh et al., 2009a).
Simple cells from the cat primary visual cortex were extensively studied using the method of reverse correlation. Jones and Palmer described several types of simple cells with subfields
...
...
Spikes Sparse noise t texhibiting different sizes, shapes, relative position and strength (Jones and Palmer, 1987). Due to limitations on their equipment, the RF’s temporal profile was not characterized at the time. About five years later, DeAngelis, Ohzawa and Freeman were able to overcome this technical barrier as they conducted a thorough investigation of the RF properties from simple cells in the spatiotemporal dimensions (DeAngelis et al., 1993a, 1993b). The RFs of simple cells from the cat primary visual cortex were analysed in the space-time joint domain by creating X-T plots where one dimension represents the axis perpendicular to the RF orientation and the other represents time. For simplicity, the spatial dimension corresponding to the RF orientation was not considered. The analysis of the X-T plots revealed two main types of simple cells: space-time separable and inseparable. Space-space-time separable receptive fields suggest that spatial and temporal features are processed independently. In other words, the 2D spatiotemporal profile (X-T profile) can be estimated as the product of two 1D profiles (i.e., spatial and temporal functions). In contrary, RFs that are space-time inseparable exhibit X-T profiles with oblique subfields showing that the spatial location of these regions changes over time. This indicates that the spatiotemporal profile cannot be explained by the product of two 1D independent functions (DeAngelis, Ohzawa, and Freeman 1993a).
Previous studies have demonstrated that simple cells integrate their inputs linearly both in space (DeAngelis et al., 1993b; DeValois et al., 1979; Movshon et al., 1978a) and time (DeAngelis et al., 1993a, 1993b). Given that, several response properties of simple cells, such as spatial, temporal and velocity tunings, can be estimated from the Fourier decomposition of their first-order spatiotemporal RF structure (DeAngelis et al., 1993a, 1993b). In contrast, complex cells are known to integrate the input signals in a nonlinear fashion (Movshon et al., 1978b). Thus, one cannot accurately predict the neuronal properties of complex cells based on the Fourier decomposition of their first-order RF structure, as performed in simple cells (DeAngelis et al., 1993b; Szulborski and Palmer, 1990). Instead, higher-order responses are used to investigate the RF of complex cells (Ohzawa et al., 1990; Szulborski and Palmer, 1990). For instance, Szulborski and Palmer (1990) characterized the spatial profile of complex cells from the cat area 17 using a modified method of sparse noise reverse correlation where two stimuli were presented at a time. In this case, the second-order spatial RF structure was created by assessing the
responses of complex cells as a function of the relative position and polarity of the light bars on the screen (Szulborski and Palmer, 1990).
Different visual stimuli were used with reverse correlation and other similar approaches have been used in order to investigate different properties from RFs of neurons across the visual system (Borghuis et al., 2003; Churan et al., 2012; Pack et al., 2006). For instance, a common stimulus used in the reverse correlation is the dense noise (i.e., white noise). The stimulus consists of a sequence of images formed by pixels with opposite polarities randomly distributed in space and time and it is mainly used to assess linear RFs (Reid et al., 1997; Ringach and Shapley, 2004; Sakai et al., 1988) but it is also applied to non-linear systems under specific circumstances (Chichilnisky, 2001). More recently, Nishimoto et al. (2006) developed a different reverse correlation method using the white noise stimulus in which a spectral analysis of the cross correlation is performed with sections of the visual stimulus (local spectra reverse correlation). The main advantage of this method is that the spatial frequency tunings and orientation can be obtained from both simple and complex cells and the fact that the spectral analysis is performed in small regions of the stimulus spatial heterogeneity can be identified in and between the RF subfields (Nishimoto et al., 2006). Sinusoidal gratings are equally used with the reverse correlation technique in which a random sequence of gratings at different orientations and spatial frequencies is presented. This method is useful to assess the neurons’ optimal responses to those parameters and, when the linearity assumption is respected, the neuron’s spatial frequency tuning can be obtained from the Fourier decomposition of the RF spatial profile (Nishimoto et al., 2005; Ringach and Shapley, 2004; Ringach et al., 1997). Recent studies have explored the usage of more sophisticated visual stimuli in the investigation of the RF structure (Livingstone et al., 2001; Pack et al., 2006; Talebi and Baker, 2012). For instance, Richert et al. (2013) created a reverse correlation method in order to investigate the RFs of neurons from the primate extrastriate area MT, a higher order cortical area associated with motion processing. Their stimulus consisted of a grid in which small dots drift independently of each other. The reverse correlation reveals a high resolution receptive field map that provides information about the direction selectivity of each subregion. Interestingly, the method revealed MT neurons with heterogenous preferred directions providing insight on the complexity of the neuronal processing of these higher order cortical areas. Naturalistic visual
stimuli have been increasingly used in vision research (Sekuler and Bennett, 2001; Simoncelli and Olshausen, 2001). David et al. (2006) used natural images to assess the RF of the primate area V4, an extrastriate area specialized in processing shape and colour. They were able to characterize the spatial and orientation tuning of neurons from area V4 based on the Fourier analysis of RFs. Furthermore, based on the spectral structure of the responses to natural images, the researchers could predict the neuronal tunings for classical stimuli such as sinusoidal gratings. Similarly, reverse correlation analysis of neuronal responses from cat area 18 to natural images, dense and sparse noise revealed that the former, along with sparse noise, had the most predictive power regarding the neuronal frequency tunings (Talebi and Baker, 2012). More recently, the same group used natural images to characterize the spatiotemporal structure of RFs of neurons from the cat area 18 (Talebi and Baker, 2016). Interestingly, they identified different RF types based on their responses to the naturalistic visual stimuli that challenges the classical classification of simple and complex cells in the early visual cortex.
Thus, the concept of receptive field initially proposed by Hartline (1938) was greatly expanded throughout the last decades. The advances in the technology and the development of sophisticated analytical methods contributed to the understanding that the receptive field is a dynamic structure that is modulated by the visual input in both the spatial and temporal domains. Furthermore, the comprehension of the spatiotemporal structure of the receptive field is important in order to understand the mechanisms underlying the cortical processing of visual information.
2.3 The response to contrast
In the natural environment, the level of luminance of the visual scene is highly variable, with areas with low (shadows) and high (highlights) luminance, rapidly changing as the eye scans the surroundings. Even though individual photoreceptors in the retina are primarily sensitive to variations in luminance levels, this does not provide much useful information about the environment. Instead, the differences of luminance across the visual scene relative to the average luminance level (i.e. contrast) is found to be more relevant in the visual system. Indeed, the contrast coding arises early in the retina where bipolar (Burkhardt, 2011) and ganglion cells RFs (Kuffler, 1953) are sensitive to local differences in luminance levels.
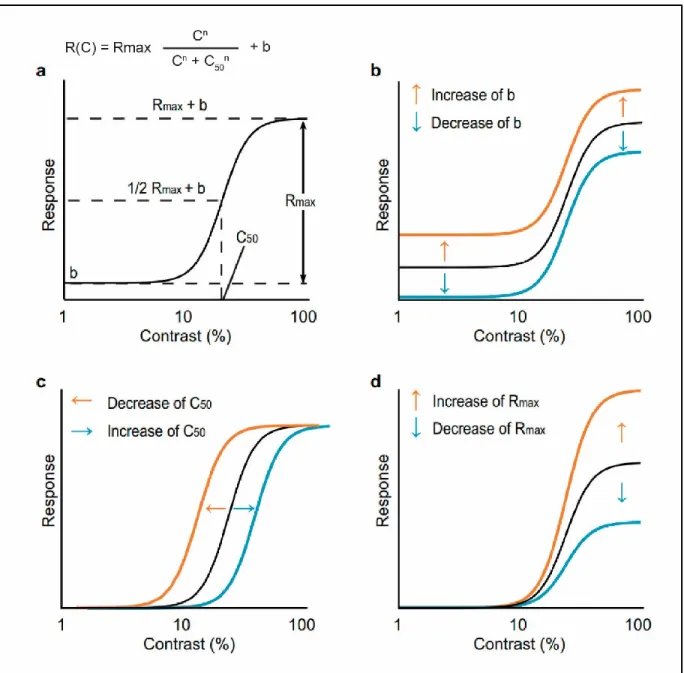
In general, visual neurons in the cortex increase their firing rate monotonically with increasing contrast. However, neurons respond weakly to lower contrasts while it reaches a plateau at high contrast levels giving the neuron’s response a sigmoidal profile. This nonlinear response pattern is named the contrast response function (CRF) and it was observed across several visual areas in different species such as cats, primates and humans (Albrecht and Hamilton, 1982; Gardner et al., 2005; Ohzawa et al., 1982; Sclar et al., 1990). The shape of the CRF is better characterized by a hyperbolic function first used by Naka and Rushton (1966) in retinal recordings (Albrecht and Hamilton, 1982). The Naka-Rushton equation is shown in Figure 6A and described in detail in the methods section in article #2 of the thesis.
To date, it is widely accepted that visual neurons from different cortical areas respond similarly to contrast. This seemingly ubiquitous response profile across the visual hierarchy makes the CRF a useful tool to investigate the visual function. Indeed, several studies used the CRF in a plethora of methodological approaches from single-unit recordings to psychophysical measurements (Albrecht and Hamilton, 1982; Boynton, 2005; Duong and Freeman, 2008; Gardner et al., 2005; May and Solomon, 2015; Soma et al., 2013). Furthermore, since the response to contrast arises early in the retina and is preserved throughout the visual hierarchy (Burkhardt et al., 1998; Ohzawa et al., 1982; Tardif et al., 1996; Zhao et al., 2001), one could say that the CRF represents a “raw” measurement of the mechanisms underlying a neuron’s processing of visual information. Additionally, changes in the shape and position of a neuron’s CRF gives us clues on how the information is transformed throughout the cortical circuitry (Soma et al., 2013). For instance, a change in a neuron’s sensitivity to contrast can be translated into a left or rightwards shift of the CRF (contrast gain control, Figure 6 C), changes in the spontaneous activity is translated as a baseline control (Figure 6B), while a change of a neuron’s
firing rate in function of the contrast level would be identified as a change on the CRF shape (response gain control, Figure 6 D).
Figure 6. The Naka-Rushton function and three examples of changes in the contrast response profile. A) Naka-Rushton function and graphical representation of its variables (the factor “n” representing the curve slope is not depicted in the graph), B-D) Examples of changes in the contrast response function characterized by changes in the Naka-Rushton variables. B) Baseline control (b). C) Contrast gain control (C50). D) Response gain control (Rmax). From Soma et al. (2013).
3 The cortical hierarchy
As briefly introduced in the previous section, the visual cortex is known to be organized in a hierarchical manner, in which the processing of visual information becomes progressively complex when the signal passes from lower to higher levels in the cortical hierarchy. For decades, this concept was investigated by several research groups and a body of evidence shows that the visual cortex exhibits a hierarchical organization based on anatomical as well as on functional properties (Felleman and Van Essen, 1991; Jay Hegdé and Daniel J. Felleman, 2007; Kaas and Collins, 2001).
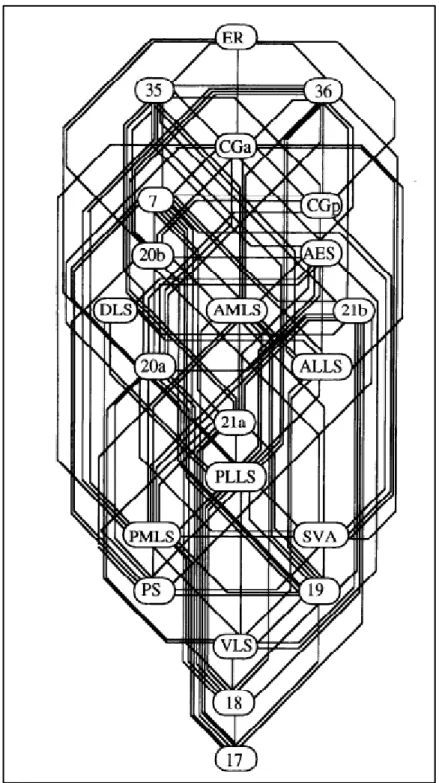
From an anatomical standpoint, the visual hierarchy is defined by the connectivity patterns between cortical areas. These patterns are characterized by the laminar position of feedforward and feedback connections between cortical areas. In general, feedforward connections originate from the supragranular layers from a lower level area reaching the granular layer (layer IV) of the next area. Then, feedback projections from the infragranular layers of the higher-level area attain the supragranular layers of the lower level area. For instance, V1, the first level of the cortical hierarchy, receives inputs from the dLGN at the granular layer IV. Supragranular layers of V1 send feedforward inputs to V2 (higher cortical area) while the infragranular layers receive feedback inputs from V2 supragranular layers. Based on these parameters, Felleman and Van Essen (1991) mapped the hierarchical structure of the primate visual cortex with 32 cortical areas placed in 10 hierarchical levels. Later, Scannel et al. (1995) applied the methods used by Felleman and Van Essen (1991) to trace the hierarchical structure of the cat visual cortex. They have identified 22 visual cortical areas occupying 14 levels in the cat visual hierarchy (Figure 7).
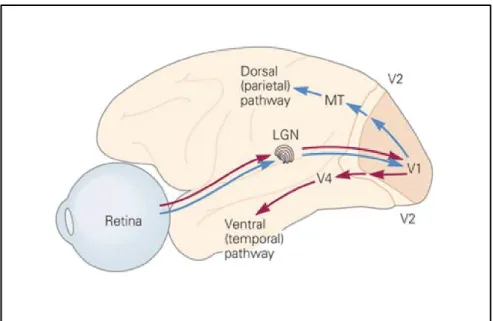
Although there is a consensus on the anatomical hierarchical organization of the visual cortex, there is no evidence that the visual processing follows strictly the same anatomical hierarchy. Indeed, previous studies have demonstrated that the cortical processing of visual information, although exhibiting some degree of hierarchy, is not undertaken in an orderly hierarchical sequence (Jay Hegdé and Daniel J. Felleman, 2007). Instead, a body of evidence indicates that distinct aspects of the visual scene (e.g., colour, form and motion) are processed in parallel pathways involving different cortical areas at different hierarchical levels (Grill-Spector and Malach, 2004). The studies of Mishkin et al (1983) were of most importance for the establishment of the functional organizational framework of the visual cortex. In their lesion studies in monkeys, they observed that focal lesions on the parietal cortex caused significant impairment during a spatial task, while lesions on the temporal cortex compromised the recognition of objects. They proposed that the visual processing is divided into two main parallel pathways: the dorsal and ventral streams (Mishkin, Ungerleider, and Macko 1983; Goodale and Milner 1992, Figure 8). The dorsal stream, also known as the “where” pathway, is implicated in spatial location, while the ventral stream, associated with object recognition, is known as the “what” pathway (Grill-Spector and Malach, 2004; Mishkin et al., 1983).
Figure 8. Diagram of the visual streams of the primate visual cortex. The gateway higher order areas from the dorsal (MT) and ventral (V4) pathways are depicted. From Kandel, Schwartz, and Jessell (2000).
3.1 The dorsal visual stream
The dorsal stream is composed of visual areas located at the occipital-parietal cortex. As mentioned above, studies in primates revealed that lesions in the dorsal stream cause specific impairments related to visuospatial behaviour (Mishkin et al., 1983; Ungerleider and Haxby, 1994). In addition, several reports of lesions in visual areas in the human brain described impairments in different visually guided behaviours such as object reaching and spatial localization (de Haan and Cowey, 2011; Kravitz et al., 2011).
One particular feature of the visual processing that the dorsal stream is known to be implicated in motion perception. In the primate brain, the area MT represents the gateway of the dorsal stream and previous studies indicated that it is directly implicated in movement perception. For instance, lesions to this area causes akinetopsia, the inability to perceive motion, in humans and non-human primates (Blanke et al., 2002). Neurons from area MT receive inputs from the primary visual cortex through areas V2 and V3. MT neurons have large RFs and are highly selective to stimulus direction, which may be explained by the fact that this area receives inputs from V1 direction selective neurons. However, the similarities between MT and V1 ends there. In contrast with the primary visual cortex, MT neurons are capable of processing more complex visual stimuli such as pattern and global motions (Ajina et al., 2015; Pack et al., 2001; Smith et al., 2005; Wang and Movshon, 2015).
In cats, a body of evidence based on anatomical and functional properties indicate that the extrastriate visual cortex is equally organized in dorsal and ventral streams (Lomber, 2001; Lomber et al., 1996; Payne, 1993). Among the areas composing the dorsal stream, the area PMLS is the most studied. Previous studies identified this area as a homolog of the primate area MT and it is considered to be the gateway area of the cat dorsal stream (Burke et al., 1998; Lomber, 2001; Payne, 1993). PMLS receives its main input from supragranular layers of cortical areas 17 and 18 as well as from area 19 (Symonds and Rosenquist, 1984b, 1984a) and PMLS neurons exhibit similar properties with their primate counterpart. For instance, PMLS neurons are highly direction selective and exhibit large RFs (Piché, Thomas, and Casanova 2013; Toyama et al. 1994; Vajda, Lankheet, and van de Grind 2005; Y. Wang et al. 1995). Additionally, previous studies have demonstrated that PMLS neurons respond to complex
stimuli such as global motion and moving texture patterns (Brosseau-Lachaine et al., 2001; Li et al., 2000a; Merabet et al., 2000; Villeneuve et al., 2006).
3.2 The ventral visual stream
The ventral stream is located along the occipito-temporal cortex. In the primate visual hierarchy, it begins with the area V4 and extends to higher order areas such as area TE. The processing of visual information increases in complexity across the ventral stream hierarchy. The ventral stream is implicated in the processing of different visual features, from the physical properties of objects (e.g. colour, shape, size, orientation and texture) to the more complex computing such as face and body recognition (Kravitz et al., 2011; Mishkin et al., 1983; Taylor and Downing, 2011). In addition, the ventral stream establishes connections with the hippocampus and amygdala which are implicated in visual memory (e.g. recalling a familiar visual object) and perception of emotions (de Haan and Cowey, 2011).
In the primate visual cortex, the area V4 represents the first step on the ventral stream processing. It receives its main input from V1 and V2 and it is in the area V4 that several visual features associated with physical properties of objects are encoded. For instance, evidence has clarified the role of area V4 in the processing of complex shapes (Kobatake and Tanaka, 1994; Orban, 2008; Pasupathy and Connor, 1999). The group of Van Essen assessed the responsiveness of V4 neurons to a type of complex stimuli named non-cartesian gratings, consisting of hyperbolic and polar sinusoidal gratings. They observed that V4 neurons are more responsive to hyperbolic and polar gratings compared to classic cartesian gratings (Gallant et al., 1993). Later, they have identified subgroups of neurons that are selective to specific types of non-cartesian gratings and that cells with similar preferences are anatomically clustered (Gallant et al., 1996). These results show that the processing of the visual information in area V4 is more complex than what was previously described in earlier areas of the cortical hierarchy. The area V4 was also found to be involved in texture perception. Arcizet et al. (2008) used a database of different natural images in which several texture patterns at different illumination conditions were presented to awake monkeys. In their study, most of V4 neurons recorded were selective to natural texture patterns and the texture preference was not influenced by the
illumination angle. This “illumination invariance” of texture perception is important in object recognition where the illumination conditions of the visual scene are constantly changing. Previous studies conducted by Connor and colleagues investigated the responses of V4 neurons to contours (e.g. angles and curvatures), which are considered as a primitive type of shape (Pasupathy and Connor, 1999, 2001, 2002; Yau et al., 2013). They have demonstrated that most V4 neurons responded preferentially to the contour stimuli compared to bars and gratings. In addition, many V4 neurons were selective to a specific contour position and orientation. When combining different curves into more complex shapes, Pasupathy and Connor (2001) demonstrated that V4 neurons are selective to specific curves in relation to the centre of the shape. Later, they calculated that V4 could encode complex shapes at a populational level based on the neuronal processing of individual contours and boundaries (Pasupathy and Connor, 2002).
3.2.1 The cat area 21a
Among the different extrastriate areas of the cat visual cortex encompassed in the ventral stream, the area 21a was the most explored. The area 21a is considered as the gateway of the ventral stream in this species and it is known to be a homolog of the primate area V4 (Payne, 1993). The area 21a is located at the posterior bank of the lateral suprasylvian cortex and it makes boundaries medially and caudally with area 19 and laterally with areas PMLS, VLS and 21b (Shipp and Grant, 1991; Tusa and Palmer, 1980). The area 21a receives cortical input from the primary visual cortex (areas 17 and 18) and to a lesser extent from area 19 (Conway et al., 2000; Grant and Hilgetag, 2005; Shipp and Grant, 1991; Symonds and Rosenquist, 1984b, 1984a). Nevertheless, evidence suggests that the main cortical driver input comes from area 17. For instance, a previous study demonstrated that the inactivation of area 17 by reversible cooling caused a significant decrease of neuronal activity in area 21a (Michalski et al., 1993). Moreover, the area 21a receives its main thalamic input from the cortico-recipient region of the lateral posterior nucleus and the pulvinar (Symonds et al. 1981; Raczkowski and Rosenquist 1983). The area 21a exhibits a retinotopic representation of part of the central visual space covering around 20 degrees of visual axis (Michalski et al., 1993; Tusa and Palmer, 1980). Most of 21a neurons are complex-like and exhibit a wide range of RF sizes (average of 5 degrees) that
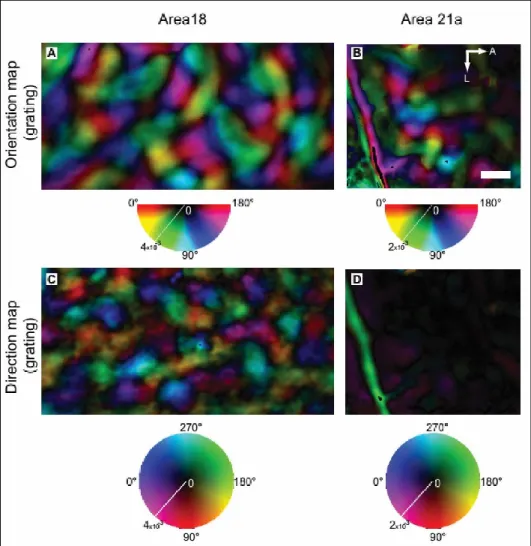
increase in function of the eccentricity (Dreher et al., 1993; Wimborne and Henry, 1992). Previous studies have characterized several properties of 21a neurons using classical visual stimuli such as bars and sinusoidal gratings (Wimborne and Henry 1992; Mizobe et al. 1988; Toyama et al. 1994; Tardif et al. 1996; Morley and Vickery 1997; Dreher et al. 1993). For instance, most neurons are selective to orientation while exhibiting poor direction selectivity (Mizobe et al., 1988; Toyama et al., 1994; Wimborne and Henry, 1992). More recently, Villeneuve et al. (2009) used the technique of optical imaging of intrinsic signals to characterize the modular organization of area 21a. They observed that, while 21a exhibits a clear modular pattern for orientation selectivity, this cortical area lacks a direction selectivity map (Figure 9). In addition, most of 21a neurons are sharply tuned to low spatial frequencies and exhibit poor selectivity to temporal frequencies (Tardif et al. 1996; Wimborne and Henry 1992; Morley and Vickery 1997). In a more recent study, the analysis of local field potentials in area 21a revealed that the neuronal activity is poorly correlated with the stimulus motion and lacks temporal selectivity tuning (Kayser and Konig, 2006). Taken together, these studies demonstrate that area 21a displays unique functional properties compatible with the processing of spatial features of the visual scene that is characteristic of the ventral stream. Moreover, previous studies demonstrated that most of 21a neurons are optimally activated by binocular stimulation and are sensitive to binocular disparity, indicating that the area 21a may also play a role in depth perception (Vickery and Morley 1999; Morley and Vickery 1999).
Figure 9. Organization of orientation (top) and direction (bottom) of areas 18 and 21a revealed by optical imaging of intrinsic signals. Contrary to area 18, area 21a exhibits an orientation map but lacks a modular organization for direction. From Villeneuve, Vanni, and Casanova (2009).
3.3 Perception and action
In parallel with the neurophysiological experiments performed in non-human primates and cats, several psychophysical studies in humans addressed the same questions about the cortical hierarchy and its functional organization in dorsal and ventral streams. In a particular set of experiments performed in a patient with visual agnosia (patient DF), Goodale and Milner (1992) provided a reinterpretation of the “what” and “where” pathways first proposed by Mishkin and Ungerleider (1982). In their interpretation, instead of having two systems dedicated to process object recognition and visuospatial perception, both dorsal and ventral streams would
use both types of information to achieve two distinct outputs: visually guided behaviour and visual perception respectively (Ganel and Goodale, 2017).
It is worth noting that the findings in the field of neuropsychology do not necessarily invalidate the body of evidence on the anatomical and neurophysiological data. Indeed, the question of how the processing of the different visual features is divided across the distinct cortical areas remains a topic under debate (Ganel and Goodale, 2017; Milner, 2017; Rauschecker, 2017). In the next section, I will introduce another piece of this puzzle by explaining the role of the thalamus on the cortical processing of visual information.
4 The visual thalamus
In the previous section, we reviewed the main aspects of the cortical hierarchical organization and how the visual information flows across the different cortical areas in order to create visual perception. In the classical view of the visual system, the retinal signals are relayed through the thalamus to the visual cortex where information processing is mainly undertaken (Kandel et al., 2000). Under this perspective, the thalamic structures involved in visual processing are regarded as simple relays placed between the retina and the primary visual cortex (Sherman and Guillery 1996). The idea of the thalamic structures as a relay was present in the minds of neuroscientists for a long time and is still portrayed in basic neuroscience textbooks. As it will be addressed below, a large body of evidence indicates that the role of the thalamus in visual processing lies beyond the function of a simple relay.
The lateral geniculate nucleus, in particular its dorsal part (dLGN), is the most studied thalamic structure involved in visual processing. For decades, a growing number of studies described the complex structure and connectivity of the dLGN (Laties and Sprague, 1966; Naito, 1986; Niimi and Sprague, 1970; Sanderson, 1971; Stone and Dreher, 1973; Van Horn et al., 2000). Despite this, its role in visual function was frequently associated with a simple machinelike relay (Sherman and Guillery 1996). Instead, the thalamus was previously believed to be mostly involved with changes in the arousal states of the brain as well as in sleep and wakefulness cycles, with little impact on the processing of visual signals per se (Sherman and Guillery, 1996). In fact, this is not the case, as the visual thalamus is actively implicated in different levels of the cortical processing. For instance, the dLGN not only sends the information from the retina
to the cortex, but also receives a large number of cortico-thalamic inputs from different visual cortical areas that makes possible to dynamically modulate the dLGN’s output to the primary visual cortex (Kawamura et al., 1974; Updyke, 1977). This is only one example from a large body of evidence that underscores the notion that the visual thalamus supersedes its classical view as a simple relay of retinal signals (Sherman 2007).
Among several research groups, the influential work of Sherman and Guillery made an important contribution for the current knowledge of the role of the thalamus on sensory information processing. They have provided a framework of the thalamic circuitry organization that largely instigated further studies helping to advance the knowledge on the thalamic function. The main aspects of their work, and others that followed, will be addressed below.
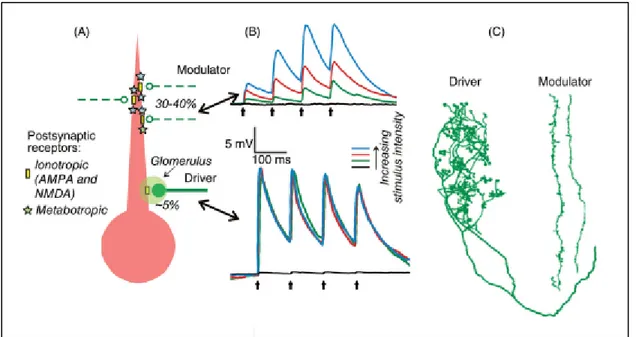
4.1 Drivers and modulators
The organizational framework proposed by Sherman and Guillery is based on the properties of the inputs received by the thalamic neurons that are connected to the cortex. The authors have identified two main types of inputs: drivers and modulators (Sherman and Guillery 1998). Driver inputs transmit the main message that is relayed to the cortex. On the other hand, modulator inputs influence the transmission of the driver without causing any substantial changes in the main message (Sherman and Guillery 1998; Reichova and Sherman 2004). The presence of both inputs, drivers and modulators, was reported in several thalamic nuclei involved in sensory processing. In particular, the cat dLGN was extensively studied and is frequently referred to as a typical example to illustrate the driver/modulator concept (Sherman and Guillery 1998; Sherman and Guillery 1996). The driver input to the dLGN comes from the retina, while descending projections from the cortex represent the main modulatory inputs to the relay neurons. Previous studies estimated that only a minority of the synapses made with a relay neuron (5-10%) is of driver type while corticothalamic modulatory projections comprise 30 to 40% of inputs (Figure 10A) (Sherman 2017). The remaining arise from the local inhibitory GABAergic neurons, the thalamic reticular nucleus and projections from the brainstem (Sherman 2007; Van Horn, Erişir, and Sherman 2000).