HAL Id: hal-00717865
https://hal.archives-ouvertes.fr/hal-00717865
Submitted on 13 Jul 2012
HAL is a multi-disciplinary open access
archive for the deposit and dissemination of
sci-entific research documents, whether they are
pub-lished or not. The documents may come from
teaching and research institutions in France or
abroad, or from public or private research centers.
L’archive ouverte pluridisciplinaire HAL, est
destinée au dépôt et à la diffusion de documents
scientifiques de niveau recherche, publiés ou non,
émanant des établissements d’enseignement et de
recherche français ou étrangers, des laboratoires
publics ou privés.
NAMA3DS1-COSPAD1: Subjective video quality
assessment database on coding conditions introducing
freely available high quality 3D stereoscopic sequences
Matthieu Urvoy, Marcus Barkowsky, Romain Cousseau, Yao Koudota,
Vincent Ricordel, Patrick Le Callet, Jesus Gutierrez, Narciso Garcia
To cite this version:
Matthieu Urvoy, Marcus Barkowsky, Romain Cousseau, Yao Koudota, Vincent Ricordel, et al..
NAMA3DS1-COSPAD1: Subjective video quality assessment database on coding conditions
introduc-ing freely available high quality 3D stereoscopic sequences. QoMEX - Fourth International Workshop
on Quality of Multimedia Experience, Jul 2012, Yarra Valley, Australia. pp.1-6. �hal-00717865�
NAMA3DS1-COSPAD1: Subjective video quality assessment database on coding conditions
introducing freely available high quality 3D stereoscopic sequences
Matthieu Urvoy, Marcus Barkowsky, Romain Cousseau, Yao Koudota, Vincent Ricordel, Patrick Le Callet
Jesús Gutiérrez and Narciso García
Image and video-communication (IVC) research group LUNAM Université, Université de Nantes IRCCyN UMR CNRS 6597, Polytech Nantes
Rue Christian Pauc BP 50609 44306 Nantes Cedex 3, France
Grupo de Tratamiento de Imágenes E. T. S. I. Telecomunicación Universidad Politécnica de Madrid Ciudad Universitaria, 28040, Madrid, Spain
ABSTRACT
Research in stereoscopic 3D coding, transmission and subjective assessment methodology depends largely on the availability of source content that can be used in cross-lab evaluations. While several studies have already been presented using proprietary content, comparisons between the studies are difficult since discrepant contents are used. Therefore in this paper, a freely available dataset of high quality Full-HD stereoscopic sequences shot with a semiprofessional 3D camera is introduced in detail. The content was designed to be suited for usage in a wide variety of applications, including high quality studies. A set of depth maps was calculated from the stereoscopic pair. As an application example, a subjective assessment has been performed using coding and spatial degradations. The Absolute Category Rating with Hidden Reference method was used. The observers were instructed to vote on video quality only. Results of this experiment are also freely available and will be presented in this paper as a first step towards objective video quality measurement for 3DTV.
Index Terms— Stereoscopic 3D, free content database, depth
maps, subjective evaluation, video quality, coding impairments
1. INTRODUCTION
Massive effort has been put into research in stereoscopic 3D coding, transmission and subjective assessment methodology, but most of the resulting studies are using discrepant and most often proprietary contents. As a consequence, it is difficult to compare the results of these studies, and to resolve the conflicts that may emerge. In particular for subjective experiment methodology evaluation in 3D video, cross-lab comparisons appear to be a required step towards drawing comprehensive conclusions.
The availability of 3D sequences is a major requirement for the research community to study the perceptual and technological factors of 3D video systems. In order to provide free 3D video content for research purposes, several datasets have been already published. For instance, Goldmann et al. [1] generated a stereoscopic video dataset captured using two consumer HD camcorders installed in a rig in parallel, in order to study the influence of the distance between the cameras on the perceived 3D quality. Another important dataset is the one used in the context of MPEG towards the new 3D Video Coding standard [2] which contains a set of uniformly spaced camera views. In addition, in the context of the research project Mobile3DTV [3], a dataset of stereoscopic and multiview sequences was gathered from different organizations, and their main properties were presented, in relation
to motion, color, texture, depth, etc. However, not all of the sequences are freely available, and only a few have Full-HD resolution. A database of stereoscopic videos captured with Full-HD cameras mounted on a rig and covering various scenarios and contents is presented in [4] with the aim of facilitating the research on post-production techniques. Finally, it is also worth noting the popular dataset presented in [5] with material used as a benchmark for the performance evaluation of depth estimation algorithms.
However, the availability of stereoscopic high quality source content is still a key problem that this paper addresses by providing a new and freely available 3D video database, with high visual quality sequences, including uncompressed or encoded videos with very high bitrate. It is composed of Full-HD stereo sequences at 25 frames per second, captured using a semi-professional 3D camera. It was named Nantes-Madrid-3D-Stereoscopic-V1, NAMA3DS1, and can be retrieved from our website [6].
Two aspects were considered when the sequences were recorded. Firstly, they encompass challenging aspects for coding algorithms (e.g., colorfulness, object & camera motion, texture), in addition to perceptual effects influencing the 3D quality of experience that should be studied. For example, it is known that motion in depth and parallel to the screen plane influence visual comfort differently [7][8]. Simple indicators computed on the sequences will show that they indeed span a large range of spatial, temporal, depth and coding characteristics. Secondly, the selection of the content was done trying to obtain interesting scenes for the observers, considering that they will be used in subjective quality assessment tests. For this reason, shooting conditions were varied and include indoor and outdoor sequences at close (<5m), medium (<10m) and long distances. Also, the content has been selected so that it is representative of usual television contents (such as sport scenes and broadcasting news), and contains 3D effects that are usually attractive for 3DTV users (like variations in the depth plane).
Performed on a common set of source contents, subjective evaluations are still likely to be influenced by the experimental setup, even when an international recommendation such as ITU-P.910 [9] is observed. Therefore, it is necessary to compare different laboratories, different environments, and different test methodologies for their suitability in acquiring reliable, meaningful, and reproducible results. In order to provide a first set of degraded sequences for such comparison a database, called NAMA3DS1-COSPAD1, has been created. Currently, it is restricted to COding and SPAtial Degradations only, such as blockbased coding, wavelet coding, resolution reduction, and edge enhancement algorithms.
Subjective evaluation in 3D has been shown to contain several different scales, such as video quality, naturalness, depth effect, depth quality, and visual comfort that may be affected by different processing steps along the transmission chain [10][11][12]. The restriction to coding and spatial degradations for NAMA3DS1-COSPAD1 was chosen in order to emphasize variability on the video quality scale while minimizing the influence on the other perceptual scales. Please note that this restricts also its usage in training and evaluating objective video quality measurement algorithms to the video quality scale.
A subjective experiment using the Absolute Category Rating with Hidden Reference (ACR-HR) [9] has been performed. For each observer, both his screening information and the votes were recorded. An analysis of the obtained results is provided in this paper. Because both the video sequences and the observer data are openly available, comparison studies using different methodologies or environmental setups are easy to conduct.
The rest of the paper is structured as follows. Section 2 first details the contents of NAMA3DS1 dataset, including scene descriptions, camera setup, and depth map generation. Then, section 3 demonstrates the richness of our dataset in terms of spatial, temporal and in-depth contents through indicators. Sections 4 and 5 contain the subjective evaluation and its analysis, respectively. Finally, section 7 concludes this paper.
2. SEQUENCES PROVIDED IN NAMA3DS1
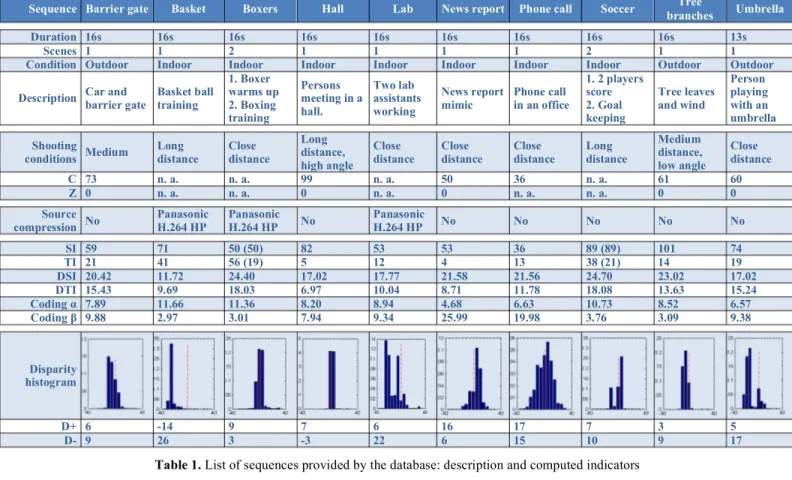
The provided sequences are summarized in Fig. 1, which shows sequence previews, and Table 1, which provides detailed information on each sequence, including a description, the shooting conditions, the camera parameters, and depth information.
2.1. Camera setup and shooting conditions
Sequences were captured with Panasonic AG-3DA1E twin-lens camera [13], which features a pair of twin-lens whose optical axes are separated by 60 mm, a distance close to the interpupillary distance, thus providing natural-looking contents. The lenses are equipped with a motorized 5.6× zoom, featuring a focal length ranging from 4.2 mm to 23.5 mm, and aperture from F1.8 to F2.4, respectively. The twin-lenses are adjusted and synchronized, thus avoiding vertical (<1.2%), angular, and rotational deviations, and
brightness mismatches between left and right views: no stereo-adjustments are required for most uses, unlike in [1].
Due to the different scenarios and shooting conditions, the parameters of the camera were chosen individually for each shot, including the white balance. Table 1 notably reports the zoom factor (Z) and the convergence (C) of the camera for each sequence. Z ranges between 0 (wide angle, 1×) and 99 (long focus, 5.6×). C ranges between 0 (2.2m) and 99, which indicates a parallel shooting with convergence at infinite.
While these camera parameters may not be sufficient for multi-view rendering algorithms or high precision stereo-processing such as depth estimation benchmarking, they may be useful in less demanding contexts and studies.
2.2. Recording chain
Captured sequences feature 1920×1080 progressive Full HD resolution per view and 25 frames per second. When feasible, uncompressed sequences were transmitted as dual SDI streams from the camera to a Clearview Extreme system from Video Clarity. This chain has been used for the sequences Barrier gate,
Hall, News report, Phone call, Soccer, Tree branches, and Umbrella. In a few scenarios, however, it was not possible to
stream the recorded sequences to the Clearview for practical reasons. Specifically, the sequences Basket, Boxer, and Lab were recorded on the camera itself in 1080p25 per view using two separate SD cards SanDisk Extreme class 10. To store the sequences, the Panasonic AG-3DA1E camera compresses them using H.264/AVC encoder, High-Profile, and a maximum bitrate of 24Mbps (average on these sequences: 21Mbps).
2.3. Depth map generation
Depth maps were generated from left and right views using a disparity estimation algorithm based on a first order primal-dual convex optimization algorithm proposed by Chambolle et al. [14], which has been adapted to stereo matching. In particular, occlusion areas were taken into account in the optimization process. For each frame, two depth maps were computed: one using the left view as reference image, and another one using the right view as reference image. Generated depth maps were then stored in individual .y16 files where disparities are input as 16 bits values (1 bit for the sign, 9 bits for the integer part, 6 bits for the fractional part).
a) Barrier gate - frame #245 b) Basket - frame #285 c) Boxers - frame #189 d) Hall - frame #200 e) Lab - frame #390
f) News report - frame #150 g) Phone call - frame #181 h) Soccer - frame #193 i) Tree branches - frame #200 j) Umbrella - frame #230 Fig. 1. Sequences previews
3. EVALUATION OF THE CONTENTS VARIETY
In order to quantify and assess the variety of the provided contents, it is proposed to investigate spatial, temporal and in-depth dimensions of each sequence. Spatial perceptual information (SI) and temporal perceptual information (TI), as described in ITU-T recommendation P.910 [9], are respectively computed to evaluate spatial and temporal dimensions. Figure 3a shows both SI and TI indices for left views and shows that they spread over the whole domain.
In order to evaluate characteristics concerning depth along spatial and temporal dimensions, the SI and TI are calculated on the depth maps instead of the luminance component leading to the proposal of the depth spatial indicator (DSI) and the depth temporal indicator (DTI).
Finally, coding characteristics are evaluated. A linear fitting was performed on the logarithm of the bitrate and the distortion measured in PSNR on the Y-component of the YCbCr color space. The fitting parameters, offset (β) and slope (α), characterize the sequences quality at a certain bitrate and thus the coding complexity (see Figure 3b). In [15], similar parameters were used
Sequence Barrier gate Basket Boxers Hall Lab News report Phone call Soccer Tree
branches Umbrella
Duration 16s 16s 16s 16s 16s 16s 16s 16s 16s 13s
Scenes 1 1 2 1 1 1 1 2 1 1
Condition Outdoor Indoor Indoor Indoor Indoor Indoor Indoor Indoor Outdoor Outdoor Description Car and barrier gate Basket ball training
1. Boxer warms up 2. Boxing training Persons meeting in a hall. Two lab assistants working News report mimic Phone call in an office 1. 2 players score 2. Goal keeping Tree leaves and wind Person playing with an umbrella Shooting conditions Medium Long distance Close distance Long distance, high angle Close distance Close distance Close distance Long distance Medium distance, low angle Close distance C 73 n. a. n. a. 99 n. a. 50 36 n. a. 61 60 Z 0 n. a. n. a. 0 n. a. 0 n. a. n. a. 0 0 Source compression No Panasonic H.264 HP Panasonic H.264 HP No Panasonic H.264 HP No No No No No SI 59 71 50 (50) 82 53 53 36 89 (89) 101 74 TI 21 41 56 (19) 5 12 4 13 38 (21) 14 19 DSI 20.42 11.72 24.40 17.02 17.77 21.58 21.56 24.70 23.02 17.02 DTI 15.43 9.69 18.03 6.97 10.04 8.71 11.78 18.08 13.63 15.24 Coding α 7.89 11.66 11.36 8.20 8.94 4.68 6.63 10.73 8.52 6.57 Coding β 9.88 2.97 3.01 7.94 9.34 25.99 19.98 3.76 3.09 9.38 Disparity histogram D+ 6 -14 9 7 6 16 17 7 3 5 D- 9 26 3 -3 22 6 15 10 9 17
Table 1. List of sequences provided by the database: description and computed indicators
a) SI vs TI - w/ () or w/o () scene cuts
b) Offset β vs slope α of log10R-D curves
Fig. 3. Spatial, temporal and coding characteristics a) Barrier-gate, frame 0 b) Boxers, frame 0
c) Umbrella, frame 0 d) Hall, frame 0 Fig. 2. Spatial, temporal, and coding characteristics
for a reduced-reference video quality model. All these indicators are reported in Table 1, along with disparity histograms, and maximum crossed (D+, objects projected in front of the screen) and uncrossed (D-, objects projected behind the screen) disparities. The variability of all these indicators reflects the heterogeneity of our source video database NAMA3DS1.
4. SUBJECTIVE EVALUATION
As a first step towards the subjective evaluation of the dataset NAMA3DS1, an ACR-HR test [16] was performed in order to assess the quality of each provided video sequence. The objective of the test is twofold: first and foremost, to evaluate the impact of various degradations on the perceived quality while building a dataset of observers and subjective scores for various applications, including 3D objective quality measurement methods; second, to assess the intrinsic quality of our sequences. Note that only video quality was assessed, which may neglect important factors of the overall quality of experience that includes, for example depth quality, naturalness, presence and comfort [10][11].
4.1. Stimuli and evaluated conditions
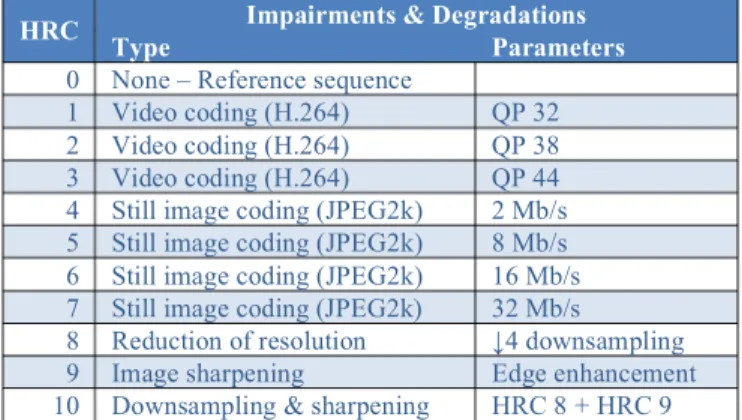
The source sequences (SRC) from NAMA3DS1 were impaired by various spatial or coding degradations. Eleven hypothetical reference conditions (HRCs), including the unprocessed reference as HRC0, were considered (see Table 2). Coding impairments were introduced through H.264/AVC video coder (JM reference software, v18.2) and JPEG 2000 still image coder (Kakadu software, v7.0). In both cases, left and right images were encoded separately with the same parameters (symmetric processing). Losses in resolution have also been considered: two HRCs feature sequences downsampled by a factor of 4, and later upsampled for displaying. Finally, a typical post-processing step in TV applications has been included: image sharpening through edge enhancement.
4.2. Towards a dataset of observers
In order to build a dataset of observers, diverse information on the subjects were included in NAMA3DS1-COSPAD1. Besides their age and gender, observers were asked how experienced they are with stereoscopic 3D contents, and empirically attributed a note ranging from 0 (never experienced 3D) to 5 (everyday use). Ocular tests were performed to evaluate visual acuity (Snellen chart),
stereo acuity (RANDOT), color vision deficiencies (Ishihara plates) and eye dominance (Porta test).
Recommendations such as ITU-R BT.500 and committees best practices such as the Video Quality Experts Group (VQEG) test plans often require observers’ visual performance to match certain criteria: a (corrected-to) normal visual acuity (≥ 0.9), no color vision deficiencies, and sufficient stereo acuity. In our study, however, all observers were allowed to perform the evaluation. As NAMA3DS1-Obs is freely available, researchers are invited to evaluate the influence of the characteristics of the observers on the perceived video quality.
4.3. Experimental setup
Observers were seated in a standardized room. A Philips 46PFL9705H 46” stereoscopic display with shutter glasses was used to display the sequences. Screen brightness was set to 180 cd/m2, resulting in 56 cd/m2 after glasses luminosity attenuation. Calibration was performed with an Eye One Pro luminance meter: gamma correction was set to 2.2 and white point to 6600K. Room illumination was calibrated as well, and set to 54 cd/m2 behind the screen, which results into 8 cd/m2 after glasses attenuation, hence 15% of the perceived screen brightness. Finally, viewing distance was set to three times the height of the screen, that is 172 cm.
4.4. Assessment method
29 observers (12 females, 17 males, aged from 18 to 63 years old) performed the ACR-HR evaluation on video quality scale to evaluate all 10 sequences and corresponding 11 HRCs, resulting in 99 sequences of 16s and 11 sequences of 13s. First, five sequences were used as a training set, then all 110 sequences were shown in a semi-random order individually chosen for each observer with the restriction that the same source or the same HRC was never selected twice in a row. At the end of each sequence, a grey screen was displayed, and the observer was asked to evaluate the video quality with a score ranging from 1 (bad) to 5 (excellent). Reported votes are provided with NAMA3DS1-COSPAD1.
5. RESULTS AND ANALYSIS
5.1. Observer characteristics
The choice of a specific panel of observers for a 3D subjective assessment may be even more important than in 2D as additional factors such as depth perception, acceptance of 3D visualization, or experience in viewing 3D may impact the results. While it has been shown that observers may lose about one fifth of Just Noticeable Differences (JND) per year of age [17], little is known about changes of 3D stereoscopic viewing.
The panel of observers used in this study contains a specific variability. Fig. 4a and 4b show the distribution of the ages and the experiences with 3D (respectively) of the observers. As can be seen, NAMA3DS1-COSPAD1 mostly features young observers (27 years old in average), and observers who only experience stereoscopic 3D several times a year; however, it also features few senior observers, and observers who watch 3D stereoscopic contents once a month.
Similarly, Fig. 4c shows that various types and intensities of visual deficiencies were measured. While no observer was rejected by the Ishihara color plate test, for each pair of visual and depth acuity values, Fig. 4c displays the corresponding number of
HRC Impairments & Degradations
Type Parameters
0 None – Reference sequence
1 Video coding (H.264) QP 32
2 Video coding (H.264) QP 38
3 Video coding (H.264) QP 44
4 Still image coding (JPEG2k) 2 Mb/s
5 Still image coding (JPEG2k) 8 Mb/s
6 Still image coding (JPEG2k) 16 Mb/s
7 Still image coding (JPEG2k) 32 Mb/s
8 Reduction of resolution ↓4 downsampling
9 Image sharpening Edge enhancement
10 Downsampling & sharpening HRC 8 + HRC 9
observers. It may be indicated that observers mostly present either visual acuity deficiencies or depth acuity deficiencies, but barely both at the same time although the amount of analyzed data is insufficient. This may be explained by the fact that visual acuity test (Snellen chart) involves far vision mechanisms, while depth acuity test (RANDOT) involves near vision mechanisms. As a perspective, an additional visual acuity test assessing the near vision performances may provide valuable information.
5.2. Observer rejection criteria
Prior to any further analysis, it is required to detect eventual outliers amongst observers. Rejection criteria from both ITU-R BT.500 and VQEG multimedia test plan were applied to our dataset. With respect to ITU-R BT.500, both observers 21 and 23 were labeled as outliers. With respect to VQEG multimedia test plan, all observers were accepted, although the correlation of observer 23 for all PVSs is only 0.75, which is the rejection threshold. After manual inspection of his votes, observer 23 was removed for the forthcoming analysis.
5.3. How balanced is the proposed evaluation?
One indication of the suitability of a subjective assessment for further studies is a uniform distribution of individual and PVS-averaged ACR ratings – resp. individual votes and Mean Opinion Scores (MOS) -, indicating that the proposed SRCs and HRCs are suitable, and that experiment setup and methodology do not introduce a significant bias.
Firstly, the five ACR attributes are indeed nearly uniformly distributed, hence spread the whole quality scale, as can be seen in Fig. 5a. This indicates that observers, on average, used the
available scale uniformly to assess the video quality. Secondly, MOS are also nearly uniformly distributed on the continuous scale ranging from 1 (bad) to 5 (excellent) as can be seen in Fig. 5b. This indicates that the proposed sequences and degradations are equally spread over the whole video quality spectrum considered and may thus be considered representative.
5.4. Video quality of original sequences
NAMA3DS1 sequences intend to be used as source material for cross-lab experiments, thus requiring for the video quality of the original sequences to be of sufficient quality. VQEG considered a MOS larger than 4 sufficient for a reference sequence in their multimedia experiment and in their HDTV test plan. Sequences of lower quality were manually inspected. Figure 6a shows that all sequences are attributed a score in between 4 and 5, with the exception of Boxers whose score is close to 4 (3.96). Hence, the video quality of NAMA3DS1 original sequences may be consi-dered sufficient for large-scale evaluation campaigns. In addition, Fig. 5a also plots the 95% confidence intervals on top of the MOS. It may be noted that higher values of MOS exhibit smaller confidence intervals which may be attributed to the limitation of the voting scale which provides MOS=5 as a maximum.
Finally, there is a significant difference in video quality between the source sequences, from Boxer (3.96) to Umbrella (4.75): the standard deviation of these MOS is σ =0.3. As a consequence, provided sequences may be used to investigate various factors (e.g., contrast and disparity) as potential influences on the video quality of 3D contents.
5.5. Video quality degradation: perspectives of study
Fig. 6b plots the MOS for each HRC averaged over all SRC in descending order, along with the 95% confidence intervals. Once again, it can be seen that proposed degradations, impairments and post-processing steps spread the whole ACR scale. In addition, MOSs obtained for all HRCs are trustworthy as corresponding confidence intervals are narrow.
From this information, and as a perspective, one may compare the influence of standard video coders artifacts (e.g., blocking effects) with those of wavelet based coders (e.g., blur), and train an objective model based and provided MOS.
In addition, HRCs 0 and 8 can be compared to HRCs 9 and 10 respectively: the subjective video quality is barely affected, which may not be the case with naïve objective metrics: another topic to investigate.
a) Age distribution (18 to 63) b) 3D experience distribution
c) Visual versus depth acuity
Fig. 4 Variability of the characteristics of the observers
a) Observers votes distribution b) MOSs distribution Fig. 5. Near-uniform distributions of votes and MOS
a) Source video quality b) Impairments Fig. 6. MOS for original and impaired sequences
Finally, one may investigate the inner-HRC variability of the MOSs to identify which sequences and associated characteristics are sensitive to certain degradations and impairments.
6. CONCLUSIONS
Most subjective assessment studies on coding, transmission, and perceptual issues with stereoscopic 3D video make use of discrepant and most often proprietary contents. In order to facilitate future cross-lab experiments and the comparison between different studies, this contribution provides camera information and sequence characteristics for a stereoscopic video database in 3D Full-HD for each view, which was explicitly constructed for this purpose and which is made freely available. NAMA3DS1-COSPAD1 features various kinds of contents, both in terms of semantics and spatial, temporal and in-depth characteristics.
In addition, a subjective evaluation assessing the video quality of original and degraded sequences has been performed. Results show that proposed evaluation is well balanced and features both observer and sequences variability. The video quality spectrum is uniformly represented through several common types of spatial and coding degradations as well as enhancements.
Moreover, the database is appropriate for several research areas, such as: 3D subjective assessment methodologies, depth estimation and post-processing techniques, full-reference to no-reference objective quality metrics for 3D video, and visual attention algorithms, bearing in mind that provided subjective scores reflect the video quality only, and may not reflect the quality of experience.
Despite the variety of sequences provided, further work is being carried out to get more 3D video sequences and get a more complete dataset, including other kind of contents, for example sequences with synthetic content. Moreover, other shooting factors that may affect the perceived 3D visual experience should be considered, like zooming effects or varying parallax motion. In addition, future work will include the generation of a wider database of impaired sequences, including many different patterns of coding, transmission, and processing degradations.
To summarize, NAMA3DS1-COSPAD1 is a freely available database that includes: ten 3D full HD stereoscopic sequences in high quality; one hundred 3D full HD stereoscopic sequences featuring various spatial and coding degradations; observer screening information; and video quality subjective scores. Any researcher interested in the proposed evaluation and willing to provide additional data or perform additional analysis is invited to use provided sequences, evaluation scores, and observer information. This additional data may be added to the existing dataset on the webpage [6].
7. ACKNOWLEDGMENT
This work has been partly conducted within the scope of the JEDI (Just Explore Dimension) ITEA2 project, which is supported by the French industry ministry through DGCIS and by the Spanish industry ministry through Avanza. In addition, this work was partly supported by PERSEE project that is financed by ANR (project reference: ANR-09-BLAN-0170). In addition, this work was partly supported by the COST IC1003 European Network on Quality of Experience in Multimedia Systems and Services - QUALINET. Finally, it was also partly supported by Spain through the Ministerio de Economía y Competitividad under project TEC2010-20412 (Enhanced 3DTV).
11. REFERENCES
[1] L. Goldmann, F. De Simone, and T. Ebrahimi, “A comprehensive database and subjective evaluation methodology for quality of experience in stereoscopic video”,
Electronic Imaging, 3D Image Processing and Applications,
USA, Jan. 2010.
[2] ISO/IEC JTC1/SC29/WG11, “Call for Proposals on 3D Video Coding Technology”, Doc. N12036, Switzerland, Mar. 2011.
[3] A. Smolic, G. Tech, and H. Brust, “D2.1. Report on generation of stereo video data base”, Mobile3DTV Technical
Report, Jun. 2008. Available online at http://sp.cs.tut.fi/mobile3dtv/results/
[4] D. Corrigan, F. Pitié, V. Morris, A. Rankin, M. Linnane, G. Kearney, M. Gorzel, M. O'Dea, C. Lee, and A. Kokaram, “A video database for the development of stereo-3D post-production algorithms”, Proc. of IEEE Conference on Visual
Media Production, pp. 64-73, Nov. 2010.
[5] D. Scharstein and R. Szeliski, “A taxonomy and evaluation of dense two-frame stereo correspondence algorithms”, Int.
Journal of Computer Vision, vol. 47, no. 1-3, pp. 7-42, 2002.
[6] IRCCyN-IVC, “Nantes-Madrid 3D Stereoscopic database”, available online at
http://www.irccyn.ec-nantes.fr/spip.php?article954, Mar. 2012
[7] J. Li, M. Barkowsky, and P. Le Callet, “The influence of relative disparity and planar motion velocity on visual discomfort of stereoscopic videos”, Proc. of the International
Workshop on Quality of Multimedia Experience, Mechelen,
Belgium, pp. 155-160, Sep. 2011
[8] F. Speranza, W.J. Tam, R. Renaud, and N. Hur, “Effect of disparity and motion on visual comfort of stereoscopic images”, Proc. of SPIE Stereoscopic Displays and Virtual
Reality Systems XIII, San Jose, USA, vol. 6055, pp. 94-103,
Jan. 2006
[9] ITU-T, “Recommendation P.910, Subjective video quality assessment methods for multimedia applications”, Apr. 2008
[10] P.J. Seuntiens, W.A. Ijsselsteijn, P.M.J. Van Den Avoort, J. Berensten, I.J. Dalm, M.T. Lambooij, W. Oosting, and I. Heynderickx, “Viewing experience and naturalness of 3D images”, Proc. of SPIE Three-Dimensional TV, Video, and
Display IV, Boston, USA, vol. 31, Oct. 2005
[11] M.T. M. Lambooij, W.A. Ijsselsteijn, I. Heynderickx, “Visual discomfort in stereoscopic displays: a review”, Proc. of SPIE
Electronic Imaging, vol. 6490, pp. 1-13, Jan. 2007
[12] Q. Huynh-Thu, M. Barkowsky, and P. Le Callet, “Video quality assessment: From 2D to 3D – Challenges and future trends”, Proc. of IEEE International Conference on Image
Processing, Hong Kong, China, pp. 4025-4028, Sep. 2010
[13] Panasonic Corporation, “Panasonic AVCCAM AG-3DA1 integrated twins-lens 3D camera recorder”, 2011. Available at http://panasonic.biz/sav/broch_bdf/AG-3DA1_e.pdf
[14] A. Chambolle, T. Pock, “A first-order primal-dual algorithm for convex problems with application to imaging”, Journal of
Mathematical Imaging and Vision, vol. 40, no. 1, pp.
120-145, May 2011.
[15] T. Oelbaum and K. Diepold, “Building a reduced reference video quality metric with very low overhead using multivariate data analysis”, Proc. of International Conference
on Cybernetics and Information Technologies, Systems and Applications, Orlando, USA, Jul. 2007
[16] ITU-R, “Recommendation BT.500-11, Methodology for the subjective assessment of the quality of television pictures”, Apr. 2008
[17] A.B. Watson, “Report of demonstration of JNDVIS method for IEEE G-2.1.6. Committee at NASA Ames Research Center”, Aug. 2001