UNIVERSITY OF QUEBEC AT CHICOUTIMI
A DISSERTATION PRESENTED TO THE UNIVERSITY OF
QUEBEC AT CHICOUTIMI IN PARTIAL FULFILLMENT
OF THE REQUIREMENT FOR THE DOCTOR OF
PHILOSOPHY IN ENGINEERING
BY
LEI PAN
EFFECTS OF ALLOYING ELEMENTS ON THE
MICROSTURCTUE AND PROPERTIES OF 8XXX
ELECTRICAL CONDUCTOR ALLOYS
UNIVERSITÉ DU QUÉBEC À CHICOUTIMI
THÈSE PRÉSENTÉ À
L'UNIVERSITÉ DU QUÉBEC À CHICOUTIMI
COMME EXIGENCE PARTIELLE
DU DOCTORAT EN INGÉNIERIE
PAR
LEI PAN
EFFETS DU ÉLÉMENTS D'ALLIAGE SUR LES
MICROSTRUCTURE ET PROPRIÉTÉS DES ALLIAGES
CONDUCTEURS ÉLECTRIQUE DE LA SÉRIE 8XXX
ABSTRACT
8xxx series aluminum conductor alloys are very attractive materials for their applications in overhead transmission and distribution, which progressively replace copper conductors in electrical application due to their significant advantages such as low density, high conductivity to weight ratio and low cost over copper. For a wide application of aluminum conductors, it is necessary to satisfy the overall requirement of properties in electrical industry, notably the electrical conductivity, tensile strength and creep resistance. To optimize the comprehensive properties of aluminum conductor materials, a better understanding of the effect of alloying elements on the microstructure and material properties is required. Therefore, in the present study, the effect of Fe, Cu and Mg additions on microstructure, electrical conductivity, mechanical and creep properties of the 8xxx alloys were systematically investigated.
In the first part, the effect of Fe contents (0.3−0.7 wt.%) on the microstructure evolution, electrical conductivity, mechanical and creep properties of 8xxx aluminum alloy conductors were investigated. The as-cast microstructure of 8xxx alloys was consisted of equiaxed α-Al grains and secondary Fe-rich intermetallics distributed in the interdendritic region. The extruded microstructure showed partially recrystallized structure for 0.3% Fe alloy but only dynamically recovered structures for 0.5% and 0.7% Fe alloys. With increasing Fe contents, the ultimate tensile strength (UTS) and yield strength (YS) were remarkably improved while the electrical conductivity (EC) was slightly decreased.
Moreover, the creep resistance was greatly improved, which is attributed to the larger volume fraction of fine intermetallic particles and smaller subgrain size in the higher Fe contained alloys. The creep threshold stress was found to increase from 24.6 to 33.9 MPa with increasing Fe contents from 0.3% to 0.7%, respectively. The true stress exponent values were close to 3 for all three experimental alloys, indicating that the creep mechanism of 8xxx alloys was controlled by dislocation glide.
In the second part, the role of Fe-rich intermetallic particles and Fe solutes on compressive creep behaviour of 8xxx aluminum conductor alloys was explored. The creep resistance of the alloys is significantly improved by a large number of Fe-rich particles and high Fe solutes in solid solution states, restricting and impeding the dislocation movement. At 100 °C, Fe solutes (0.023 wt.%)in aluminum matrix had stronger effect in increasing the creep resistance than FeAl3 particles (2.5 vol.%), while with increasing temperature to 150
and 200 °C, the high amount of FeAl3 particles (2.5 vol.%) had a stronger effect than Fe
solutes (0.023 wt.%). The threshold stress was found to increase with increasing of FeAl3
particles and Fe solutes but decrease with increasing temperature. The increment of threshold stress due to FeAl3 particles and Fe solutes is independent and the value is equal to
sum of the individual contribution. By incorporating the threshold stress into the analysis, the true stress exponent was calculated to be 3.1, 3.8, and 4.5 with increasing creep temperature from 100 to 150 and further to 200 °C, respectively.
In the third part, the effects of minor Cu (0−0.29 wt.%) and Mg (0−0.1 wt.%) additions on the microstructure, electrical conductivity, mechanical and creep properties of 8xxx aluminum conductor alloys were studied. The results reveal that additions of minor Cu and Mg reasonably improved the UTS, but slightly reduced EC. The effects of Cu, Mg and Fe on the UTS and EC are quantitatively evaluated. Addition of Cu remarkably decreases the primary creep strain but has a negligible effect on the minimum creep rate, leading to a beneficial effect onthe short-term creep resistance butno advantage to the creep resistance under the long-term creep process. The minor addition of Mg greatly reduces both primary creep strain and minimum creep rate, resulting in a significant and effective improvement on the creep resistance of 8xxx aluminum conductor alloys.
RÉSUMÉ
Les alliages d’aluminium de la série 8xxx sont des matériaux très attractifs pour leurs applications dans les transmissions et la distribution aériennes, qui remplacent progressivement des conducteurs de cuivre dans l’application électrique, en raison de leurs avantages significatifs tels que la faible densité, la conductivité élevée du rapport poids et le faible coût sur le cuivre. Pour une grande application de conducteurs en aluminium, il est nécessaire de satisfaire les exigences globales des propriétés de l’industrie électrique, notamment la conductivité électrique, la résistance à la traction et la résistance au fluage. Pour optimiser les propriétés complètes des matériaux conducteurs d’aluminium, une meilleure compréhension de l’effet des éléments d’alliage sur la microstructure et les propriétés des matériaux est nécessaire. Par conséquent, dans cette étude, l’effet des ajouts de Fe, Cu et Mg sur la microstructure, la conductivité électrique, les propriétés mécaniques et de fluage des alliages 8xxx ont été systématiquement étudiés.
Dans la première partie, nous avons étudié l’effet des teneurs en Fe (0,3−0,7 wt. %) sur l’évolution de la microstructure, la conductivité électrique, les propriétés mécaniques et les propriétés de fluages des alliages conducteurs d’aluminium de 8xxx. La microstructure brute de coulée des alliages de 8xxx était composée de grains équiaxes α-Al et d’intermétalliques riches en Fe secondaires distribuent dans une région interdendritique. La microstructure extrudée montrait partiellement une structure recristallisée pour un alliage de Fe de 0,3 %, mais montrait seulement des structures dynamiquement récupérées pour des
alliages de Fe de 0,5 % et 0,7 %. Avec l’accroissement des teneurs en Fe, la résistance à la traction (UTS) et la limite d’élasticité (YS) ont été remarquablement améliorées pendant que la conductivité électrique (EC) diminuait légèrement. De plus, la résistance au fluage a été grandement améliorée, qui était attribué au plus gros volumique de fraction de fines particules intermétalliques et à la plus petite taille de sous-grains des alliages très élevés en Fe teneurs. La limite d’endurance du fluage a augmenté de 24,6 à 33,9 MPa avec la croissance des teneurs en Fe de 0,3 % à 0,7 %. Les valeurs d’exposant de tension vrai étaient environ de 3 pour les trois alliages expérimentaux, indiquant que le mécanisme de fluage d’alliage 8xxx était contrôlé par un glissement de dislocation.
Dans la deuxième partie, nous avons exploré le rôle des particules intermétalliques riches en Fe et solutés Fe sur le comportement du fluage compressif des alliages conducteurs d’aluminium de 8xxx. La résistance au fluage a été grandement améliorée par un grand nombre de particules riches en Fe et de solutés Fe élevés à l’état de solution solide, en restreignant et entravant le mouvement de dislocation. À 100 °C, Fe (0,023 wt. %) a eu un effet plus fort en augmentant la résistance au fluage que les particules FeAl3 (2,5 vol. %),
tandis qu’en augmentant la température de 150 à 200 °C, le montant élevé de FeAl3 (2,5
vol. %) a eu un effet plus fort que les solutés Fe (0,023 wt. %). La limite d’endurance a augmenté en accroissant les particules FeAl3 et les solutés Fe, mais celle-ci a diminué avec
une hausse de température. L’augmentation de la limite d’endurance due aux particules FeAl3, les solutés Fe sont indépendants et la valeur est égale à la somme de la contribution
individuelle. En incluant la limite d’endurance à l’analyse, l’exposant de tension vrai a été calculé de 3,1, 3,8, et 4,5, en augmentant la température de fluage de 100 à 150 et ensuite à 200 °C.
Dans la troisième partie, nous avons étudié l’effet des ajouts de micro Cu (0−0,29 wt. %) et de Mg (0−0,1 wt. %) sur la microstructure, la conductivité électrique, les propriétés mécaniques et de fluage des alliages conducteurs d’aluminium de 8xxx. Les résultats révèlent que l’effet des ajouts de micro Cu et de Mg a raisonnablement augmenté les UTS, mais a réduit légèrement EC. Les effets de Cu, Mg et Fe sur les UTS et EC ont été évalués quantitativement. L’ajout de Cu diminue remarquablement la première de tension de fluage, mais il a un effet négligeable sur la vitesse de fluage minimale, conduisant à un effet bénéfique sur la résistance au fluage sous le procédé de fluage à court terme, mais n’ayant aucun avantage pour la résistance au fluage sous le procédé de fluage à long terme. L’ajout mineur de Mg réduit grandement à la fois de la première de tension de fluage et vitesse de fluage minimale, dont le résultat est une amélioration significative et efficace sur la résistance au fluage des alliages conducteurs d’aluminium de la série 8xxx.
ACKNOWLEDGEMENT
I would like to express my sincere gratitude to all those who helped and supported me during my PhD study.
First of all, I would like to express gratitude to my thesis supervisor, Professor X. Grant Chen, for his excellent guidance and most valuable advice and constant support throughout the project. Without his help and guidance, I could not have completed this thesis.
Second, I am grateful to the Rio Tinto Aluminum for providing the materials used in this study, and for their help in the equipment and design of experiments.
Then, I would like to express my heartfelt gratitude to Prof. Zhan Zhang for the training of SEM and TEM and also for the deep discussion on the EBSD results analysis; Dr. Kun Liu and Dr. Mirza Foisal Ahmed for their help in valuable discussions and constructive suggestions on my thesis writing. And also I thank Prof. Sarkar Dilip, who once offered me valuable courses and advice during my study.
Besides, appreciation also goes out to Martin Bouchard, Émélie Brideau, Alexandre Morin, Piérre-Luc, Dany Racine and to the staff of the CURAL for all the instances in which their assistance helped me along the way. Meanwhile, I am also deeply indebted to my colleagues for their fruit collaboration, scientific discussions and sharing their research experiences with me: Emad Elgallad, Mohammad Shakiba, Mehand Tebib, Junfeng Guo, Yumei Han, Gaofeng Li, Hezhaoye Ma, Qinfu Zhao, Jiawei Xiong, Lanfeng Jin, Na Xu,
Zhen Li, Peng Shen, Jian Qin, Cang-ji Shi and Ying Huang.
Finally, I would like to thank Stephanie Huo and my family for their love and support throughout this project. Thanks also to all my friends I met in Chicoutimi for long-time encouragement and support. Warm wishes to my parents and my whole family for their unending love and trust throughout my education.
TABLE OF CONTENTS
ABSTRACT ... I RÉSUMÉ ... IV ACKNOWLEDGEMENT ... VII TABLE OF CONTENTS ... IX LIST OF TABLES ... XIII LIST OF FIGURES ... XV INTRODUCTION ... 1 1.1 DEFINITION OF PROBLEMS ... 2 1.2 OBJECTIVES ... 5 REFERENCES ... 8 LITERATURE REVIEW ... 10
2.1 INTRODUCTION OF 8XXX ALUMINUM CONDUCTOR ALLOYS ... 11
2.1.1 Industrial application of 8xxx aluminum conductor alloys ... 11
2.1.2 Fabrication process of 8xxx aluminum conductor alloys ... 12
2.1.3 Alloying elements in 8xxx aluminum conductor alloys ... 13
2.1.4 Properties requirements for aluminum conductors ... 17
2.2 ELECTRICAL PROPERTIES OF 8XXX ALUMINUM CONDUCTOR ALLOYS ... 18
2.3 MECHANICAL PROPERTIES OF 8XXX ALUMINUM CONDUCTOR ALLOYS ... 21
2.3.2 Solid solution strengthening ... 26
2.3.3 Particle strengthening ... 28
2.4 CREEP BEHAVIOUR OF ALUMINUM CONDUCTOR ALLOYS ... 30
2.4.1 Creep phenomenon ... 30
2.4.2 Characterizations of creep properties ... 33
2.4.3 Creep threshold stress ... 35
2.4.4 Creep stress exponent ... 45
2.4.5 Analyzing the creep mechanisms ... 58
2.4.6 Investigation of creep properties in aluminum conductors ... 59
REFERENCES ... 61
EXPERIMENTAL ... 69
3.1 EXPERIMENTAL DESIGN ... 70
3.2 MICROSTRUCTURE OBSERVATION ... 73
3.2.1 Optical microscopy (OM) ... 73
3.2.2 Scanning electron microscopy (SEM) ... 73
3.2.3 Electron backscatter diffraction (EBSD) ... 73
3.2.4 Transmission electron microscopy (TEM) ... 74
3.3 PROPERTIES MEASUREMENTS ... 75
3.3.1 Electrical conductivity ... 75
3.3.2 Microhardness ... 76
3.3.4 Compression test ... 77
3.3.5 Creep test ... 77
REFERENCES ... 80
EFFECT OF FE ON MICROSTRUCTURE AND PROPERTIES OF 8XXX ALUMINUM CONDUCTOR ALLOYS ... 81
4.1 INTRODUCTION ... 83
4.2 MATERIAL AND METHODS ... 85
4.3 RESULTS AND DISCUSSION ... 86
4.3.1 Microstructures of as-cast and extruded materials ... 86
4.3.2 Effect of Fe on mechanical and electrical properties ... 91
4.3.3 Effect of Fe on creep properties ... 94
4.4 CONCLUSIONS ... 101
REFERENCES ... 103
EFFECT OF FE-RICH INTERMETALLIC PARTICLES AND FE SOLUTES ON CREEP BEHAVIOR OF 8XXX ALUMINUM CONDUCTOR ALLOYS ... 105
5.1 INTRODUCTION ... 107
5.2 MATERIAL AND EXPERIMENTAL PROCEDURE ... 109
5.3 RESULTS ... 111
5.3.1 Distribution of Fe-rich intermetallics and Fe solutes ... 111
5.4 DISCUSSIONS ... 120
5.4.1 Effect of Fe-rich intermetallic ... 122
5.4.2 Effect of Fe solutes ... 125
5.5 CONCLUSIONS ... 127
REFERENCES ... 129
EFFECTS OF MINOR CU AND MG ADDITIONS ON MICROSTRUCTURE AND MATERIALS PROPERTIES OF 8XXX ALUMINUM CONDUCTOR ALLOYS ... 131
6.1 INTRODUCTION ... 133
6.2 EXPERIMENTAL ... 135
6.3 RESULTS AND DISCUSSION ... 137
6.3.1 Microstructure evolution ... 137
6.3.2 Electrical conductivity and tensile strength ... 142
6.3.3 Effects of Cu and Mg on creep properties ... 149
6.4 CONCLUSIONS ... 157
REFERENCE ... 158
CONCLUSIONS AND RECOMMENDATIONS ... 160
7.1 CONCLUSIONS ... 161
7.2 RECOMMENDATIONS ... 165
LIST OF TABLES
Table 1.1 Chemical composition limits for AA1350 and AA8xxx aluminum alloy as electrical conductors [10,11]. ... 3
Table 2.1 Comparison of physical and mechanical properties of some typical aluminum conductor alloys. ... 17 Table 2.2 Effect of alloying elements in and out of the solid solution on the resistivity of aluminum. ... 20 Table 2.3 Comparative effects of different mechanisms on strength and resistivity in aluminum [33]. ... 22 Table 2.4 Atomic radius, shear modulus and strengthening parameter H of Cu and Mg in aluminum [46]. ... 27 Table 2.5 Estimated increase of aluminum hardness caused by 1% addition of Cu and Mg in different tempers. ... 27 Table 2.6 Threshold stress models proposed for the dispersoids strengthened alloys. ... 37
Table 3.1 Chemical compositions of the experimental alloys at 0.3% Fe used in this work. ... 70 Table 3.2 Chemical compositions of the experimental alloys at 0.5% Fe used in this work. ... 71 Table 3.3 Chemical compositions of the experimental alloys at 0.7% Fe used in this work. ... 71 Table 3.4 Parameters of the thermal holding treatment methods in this study. ... 72
Table 4.1 Chemical composition of experimental alloys studied (wt.%). ... 85
Table 5.1 Chemical composition (wt.%) of the alloys. ... 110 Table 5.2 Concentration of Fe solutes in the samples. ... 113 Table 5.3 Experimentally estimated increments of threshold stresses Δσth, Δσth(P) for FeAl3
particles and Δσth(S) for Fe solutes at various temperatures (MPa). ... 122 Table 5.4 The calculated Orowan stress σor and detachment stress σd for the alloys. ... 125
LIST OF FIGURES
Fig. 1.1 Cable products available in feeder sizes only. ... 2
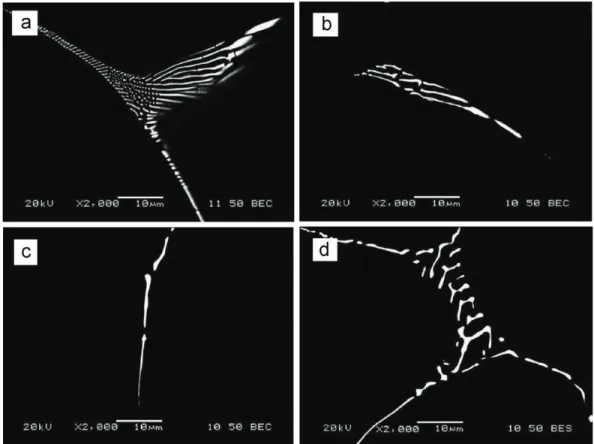
Fig. 2.1 Backscattered electron image for four different types of frequent Fe-rich particles: (a) AlmFe, (b) Al6Fe, (c) FeAl3 and (d) α-AlFeSi (Al8Fe2Si). ... 14
Fig. 2.2 Optical micrograph (a) and TEM image (b) of Al−0.75 wt.% Fe−0.15 wt.% Mg alloy rods continuously fabricated [13] (magnification 500 times for optical micrograph). ... 15 Fig. 2.3 TEM micrograph of Al−Fe−Mg alloys showing particles on sub-boundaries [41]. ... 25 Fig. 2.4 Sketch of a dislocation passing two hard particles, based on the Orowan mechanism [44]. ... 29 Fig. 2.5 Typical creep curve showing the three stages of creep. The dotted line shown in the figure is for the compression creep curves. ... 31 Fig. 2.6 Configuration representing particle dislocation interactions in 2014 Al, revealing the presence of threshold stress [66]. ... 36 Fig. 2.7 Creep threshold stress, normalized with respect to a calculated Orowan stress at 300 °C, as a function of average precipitate radius. ... 38 Fig. 2.8 Threshold stress originated from two processes, (a) threshold stress in the competing process, (b) corresponding energy profile, (c) threshold stress in the sequential process, (d) energy profile. ... 43 Fig. 2.9 Schematic view of vacancy diffusion during N-H and Coble creep. Arrows indicate the flow of vacancies through the grains from boundaries lying normal to the tensile direction to parallel boundaries. Thicker arrows indicate the tensile axis. ... 46
Fig. 2.10 Grain-boundary sliding creep mechanism. ... 47 Fig. 2.11 The slip bands and GBS of aluminum during creep deformation. (a) slip in an aluminum crystal deformed at a slow creep rate at 573 K. × 30; (b) GBS of aluminum, the close parallel lines are markers introduced during the preparation of the sample [102]. ... 48 Fig. 2.12 Schematic view of class-A creep mechanism. ... 49 Fig. 2.13 Dislocation structures for steady-state creep of Al−Mg alloys at 359 °C [105]. . 51 Fig. 2.14 Mechanism of dislocation-climb creep. ... 52 Fig. 2.15 TEM micrographs of post-creep dislocation structures of Al−0.3 wt.% Sc alloy aged at 300 °C for 5 h and crept at 300 °C under 36 MPa [42]. ... 53 Fig. 2.16 Schematic illustration of strain rate versus stress for Al−Mg alloy, showing the transition in creep mechanisms [116]. ... 56 Fig. 2.17 Creep deformation mechanism map Ashby-map [122]. ... 59
Fig. 3.1 Experimental equipment used in this work, (a) Optical microscopy (OM), (b) Scanning electron microscopy (SEM), and (c) Transmission electron microscopy (TEM). .. ... 75 Fig. 3.2 Experimental equipment used in this work, (a) SigmaScope SMP10 electrical conductivity meter, (b) Megger resistance ohmmeter, (c) HVS-1000 Digital Micro Hardness Tester, (d) Instron 8801 tensile test system, (e) Gleeble 3800 device, and (f) compression creep test machine ... 79
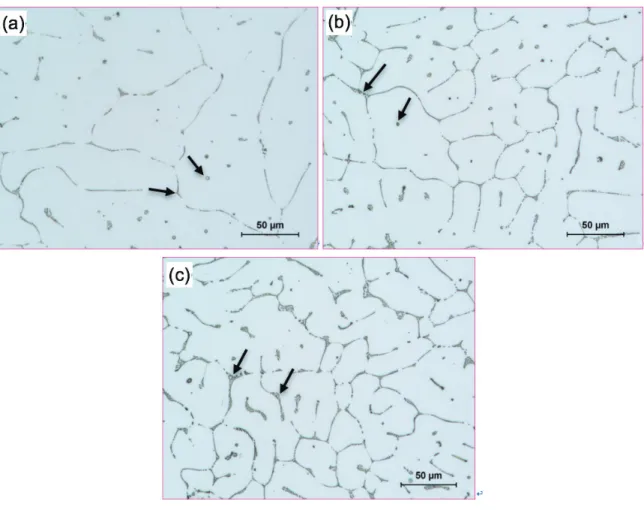
Fig. 4.1 Optical micrographs showing the as-cast grain structures: (a) Al3; (b) Al5; (c) Al7. ... 87 Fig. 4.2 Typical characteristics of Fe-rich intermetallics in Fig. 4.1: (a) SEM micrograph; (b)
EDS spectrum; (c) EBSD pattern; (d) simulated solution of EBSD pattern, identifying AlmFe phase with a lower mean angular deviation of 0.315. ... 88
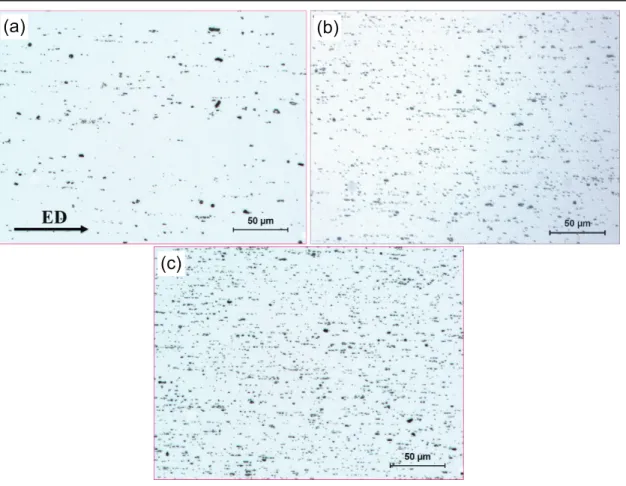
Fig. 4.3 Optical micrographs of the extruded samples: (a) Al3; (b) Al5; (c) Al7, showing fine Fe-rich intermetallic particles distributed along the extrusion direction (ED). ... 89 Fig. 4.4 Orientation imaging maps of the extruded samples with different Fe contents: (a) Al3; (b) Al5; (c) Al7; (d) Inversed pole figure color map and extrusion direction (ED). ... 91 Fig. 4.5 Evolution of mechanical properties (a) and EC (b) with different Fe contents. .... 92 Fig. 4.6 Mechanical properties (a) and EC (b) of the samples after annealing at 350 ºC for 4 h... 93 Fig. 4.7 Typical creep strain (ε) (a) and instantaneous creep rate (𝜀𝜀) (b) curves of the samples with different Fe contents, tested at 100 °C and 69 MPa. ... 95 Fig. 4.8 Double logarithmic plot of the minimum creep rate 𝜀𝜀� against applied stress σ for Al3, Al5, and Al7 alloys. ... 96 Fig. 4.9 Double logarithmic plot of minimum creep rate 𝜀𝜀� vs effective stress σ − σth for Al3, Al5 and Al7 alloys. ... 97 Fig. 4.10 TEM bright field images of Al3 samples after creep at 100 °C and 69 MPa, representing interaction between dislocations and dispersion particles: (a) dislocation pile-up at AlmFe intermetallic particles, (b) subgrain boundary blocking the dislocation
motion, and (c) intermetallic particles distributed on subgrain boundaries. ... 99 Fig. 4.11 Relation between the threshold stress, σth and Orowan stress, σor. ... 100
Fig. 5.1 SEM back-scattered micrographs of the Alloy A3 (a-b) and Alloy A7 (c-d) after thermal holding treatments. ... 112 Fig. 5.2 Binary Al−Fe phase diagram illustrating the solid solubility of Fe content at a given
temperature [24]. ... 114 Fig. 5.3 Typical compressive curves of the alloys: (a) creep strain (ε) and (b) instantaneous creep rate (𝜀𝜀), tested at 100 °C and applied load of 45 MPa ... 115 Fig. 5.4 Variations of minimum creep rate 𝜀𝜀� with applied stress σ for alloys tested at 100 °C (a), 150 °C (b), and 200 °C (c). ... 116 Fig. 5.5 Determining the threshold stress by linear fitting log 𝜀𝜀� against log σ for A3L alloys (a) and the threshold stress σth of all the alloys at the three test temperatures (b). . 118 Fig. 5.6 Logarithmic plots of minimum creep rate 𝜀𝜀� vs the effective stress, σ − σth, for alloys at three temperatures: 100 °C (a), 150 °C (b), and 200 °C (c). ... 120 Fig. 5.7 The increment of threshold stress Δσth due to FeAl3 particles and Fe solutes with
increasing temperatures. ... 122 Fig. 5.8 The diffusion rate of Al and Fe in aluminum as a function reciprocal temperature [12]. ... 127
Fig. 6.1 Optical micrographs showing the particles distribution of the alloys: (a) Al−0.3Fe, (b) Al−0.3Fe−0.29Cu, (c) Al−0.7Fe, and (d) Al−0.7Fe−0.18Cu−0.1Mg, showing fine Fe-rich intermetallic particles distributed along the extrusion direction (ED). ... 139 Fig. 6.2 Orientation image mapping showing the extruded microstructure of the alloys: (a) Al−0.3Fe, (b) Al−0.3Fe−0.29Cu, (c) Al−0.7Fe, (d) Al−0.7Fe−0.18Cu−0.1Mg, and (e) Inversed pole figure color map and extrusion direction (ED). Boundary misorientation indicated as follows: white lines 1−5°, blue lines: 5−15°, thin black lines: 15−30°, and thick black lines > 30°. ... 140 Fig. 6.3 The evolution of subgrain size with an increase of (a) Cu and (b) Mg contents..142 Fig. 6.4 Individual influences of selected alloying elements on electrical conductivity: (a)
Cu and (b) Mg. ... 143 Fig. 6.5 Correlation between calculated and experimentally measured EC. ... 145 Fig. 6.6 Individual influences of selected chemical elements on UTS: (a) Cu, (b) Mg, and (c) Fe with a linear relationship. ... 147 Fig. 6.7 Correlation between calculated and experimentally measured UTS. ... 148 Fig. 6.8 EC and UTS profile of the alloys with different Cu and Mg additions. Arrows show the increasing Cu and Mg additions to their corresponding regions. ... 149 Fig. 6.9 Typical compressive creep curves of Al−0.3Fe alloys with different Cu contents, tested at 100 °C and applied load of 69 MPa: (a) creep strain (ε) and (b) instantaneous creep rate (𝜀𝜀). ... 151 Fig. 6.10 Evolution of the primary creep strain (εp) (a) and minimum creep rate 𝜀𝜀� (b) as a function of Cu contents. ... 152 Fig. 6.11 Typical compressive creep curves of Al−0.3Fe−0.18Cu alloys with different Mg contents, tested at 100 °C and applied load of 69 MPa: (a) creep strain (ε) and (b) instantaneous creep rate (𝜀𝜀). ... 153 Fig. 6.12 Evolution of the primary creep strain (εp) (a) and minimum creep rate 𝜀𝜀� (b) as a function of Mg contents. ... 154
INTRODUCTION
Chapter 1
Introduction
1.1
Definition of problems
Aluminum conductors are widely used in building, aerospace, telephone lines, power grids and magnet winding [1-3]. Due to a much higher conductivity to weight ratio than copper and relatively lower price, they have become an attractive candidate for replacing copper conductors in electrical power industry, as shown in Fig. 1.1. As an electrical conductor material, it is necessary to satisfy the full requirements for high electrical conductivity, mechanical properties and sufficient creep resistance at an operation temperature up to 100 °C [4].
Fig. 1.1 Cable products available in feeder sizes only.
Among the aluminum conductor alloys, 8xxx aluminum alloys are the most commercialized conductor alloys used in the electrical distribution within buildings. They
are firstly developed to replace AA1350 alloys for the overhead electrical transmission [5]. In 8xxx alloys, alloying additives, such as Fe, Mg and Cu (in small amounts) are added, as listed in Table 1.1, making it possible to obtain a material with great microstructural stability, excellent comprehensive performance and creep resistance and not subject to the junction failure that occurred to AA1350 aluminum conductors [6-9].
Table 1.1 Chemical composition limits for AA1350 and AA8xxx aluminum alloy as electrical conductors [10,11].
Alloy Si Fe Cu Compositions, wt.% Mg Zn B Each
AA1350 0.10 0.40 0.05 0.001 0.05 … 0.03 AA8017 0.10 0.55-0.8 0.10-0.20 0.01-0.05 0.05 0.04 0.03A AA8030 0.10 0.30-0.8 0.15-0.30 0.05 0.05 0.001-0.04 0.03 AA8076 0.10 0.6-0.9 0.04 0.08-0.22 0.05 0.04 0.03 AA8130 0.15B 0.40-1.0B 0.05-0.15 … 0.10 … 0.03 AA8176 0.03-0.15 0.40-1.0 … … 0.10 … 0.05C AA8177 0.10 0.25-0.45 0.04 0.04-0.12 0.05 0.04 0.03 A 0.003 max lithium B 1.0 max silicon and iron C 0.03 max gallium
To improve the tensile strength and simultaneously to maintain excellent electrical property, the main alloying elements, Fe, Cu and Mg were added in 8xxx aluminum alloys [6-8]. Fe is added in this alloy to improve microstructural stability due to the presence of small insoluble dispersion eutectic particles which were formed during solidification and fabrication process [5,11], and to enhance mechanical properties through particle dispersion strengthening [12]. However, it has a detrimental effect on the casting speed due to the
lower heat extraction rate upon casting, leading to the low productivity. So, it would be preferable to keep lower Fe content and compensate properties by increasing concentrations of other elements. Small amount of Cu and Mg are known to improve the mechanical properties due to the solid solution strengthening [13,14], but the introduction of Cu and Mg will reduce the electrical conductivity [15]. Thus, it would be preferable to quantitatively understand the effects of Cu and Mg on mechanical properties and on electrical conductivity to balance the properties for their alloy development.
On the other hand, creep resistance is one of the most important properties during the industrial application of electrical conductor [9,16,17]. Gradual loosening at the terminals occurred due to poor creep resistance leads to some serious electrical fires in aluminum conductors [7-9]. The creep resistance could be improved by particles and solute additions, which lead to decreasing grain boundary mobility, impeding dislocation movement and accelerating dislocation multiplication [18-21]. The presence of Fe-containing particles has a strong effect in improving the creep resistance of aluminum alloys by impeding dislocation glide and climb and stabilizing the grain and substructure [12,25]. On the other hand, Fe solutes in commercial aluminum could be greatly increasing the creep resistance of aluminum alloys due to the low diffusion rate, while Cu and Mg could increase the creep resistance due to strong solute drag effect and clustering effect [21-24].
Though some works on electrical conductivity and mechanical properties have been performed, a systematic investigation of alloying elements (Fe, Cu and Mg) on the electrical
conductivity and mechanical properties of 8xxx aluminum alloy conductors has rarely been reported. Moreover, the study on effect of small amount of Cu and Mg on the creep behavior of 8xxx aluminum conductor alloys at relatively low temperature (T < 0.5 Tm, where Tm is
the melting point) has not been found in the literature. Furthermore, the poor understand of alloying elements on the microstructure evolution and their inference on material properties of aluminum conductor alloys seriously limit the ability for the alloy design and development. Therefore, this present study is aimed to investigate the effect of alloying elements (Fe, Cu and Mg) on microstructure and properties of 8xxx aluminum alloys to provide alternative alloy chemical compositions with a good combination of high productivity, enhanced electrical conductivity, good mechanical and creep properties.
1.2 Objectives
The goal of the present work mainly consists of three parts and the specific objectives are proposed as follows:
Part 1. Investigating the effect of Fe on microstructure and properties of 8xxx aluminum conductor alloys
1. Studying the evolution of as-cast microstructure of the 8xxx aluminum alloys with a series of Fe additions (0.3 wt.% to 0.7 wt.%).
2. Investigating the tensile strength and electrical conductivity of the 8xxx aluminum alloys with various Fe additions.
3. Constitutively analyzing the relationship between the initial microstructure and the tensile and electrical properties.
4. Studying the effect of Fe contents on the creep resistance of 8xxx aluminum conductor alloys at 100 °C.
Part 2. Exploring the role of Fe solute and Fe-containing particles on the creep behavior of 8xxx aluminum conductor alloys
1. Studying the microstructural evolution of the 8xxx aluminum alloys with two thermal holding treatments.
2. Investigating the effect of Fe solutes and Fe particles on the creep properties of the 8xxx aluminum alloys at elevated temperatures.
3. Discovering the relationship of Fe solutes and Fe particles with creep resistance at various temperatures.
4. Understanding the creep mechanisms at the studied temperature range.
Part 3. Studying the effect of Cu and Mg additions on the microstructure and properties of 8xxx aluminum conductor alloys.
1. Studying the microstructural evolution of the 8xxx aluminum alloys with a series of Cu and Mg additions during the hot extrusion.
strength and electrical conductivity of the 8xxx aluminum alloys.
3. Drawing the relationship diagram between the ultimate tensile strength and the electrical conductivity.
References
[1] V.M. Sizyakov, V.Y. Bazhin, A.A. Vlasov, Metallurgist 54 (2010) 409-414.
[2] T. Shikagawa, G. Itoh, S. Suzuki, H. Kuroda, T. Horikoshi, Aluminium Alloys 519-521 (2006) 515-518.
[3] L. Pan, B. Bourassa, X.G. Chen, Aluminium Alloys 2014 - ICAA14 794-796 (2014) 1121-1126.
[4] K.W. Barber, K.J. Callaghan, IEEE T. Power Deliver. 10 (1995) 403-409. [5] C. Olin, in: U.S.P. 3711339 (Ed.), US, 1973.
[6] J. Rabinow, Nat. Bur. Stand. (US) NBSIR (1978) 78-1507
[7] J. Rabinow, Report for the US. Consumer Product Safety Commission, 1974. [8] W.J.a.B. Meese, R., Nat. Bur. Stand. (U.S.), Bldg (1977).
[9] D. Newbury, S. Greenwald, J. Res. Nat. Bur. Stand. 85 (1980) 429-440.
[10] ASM International. Handbook Committee., ASM handbook Volume 2, Nonferrous Alloys and Special-Purpose Materials, 10th ed., ASM International, Materials Park, OH, 1992.
[11] ASTM. B800-05, Standard Specification for 8000 Series Aluminum Alloy Wire for Electrical Purposes-Annealed and Intermediate, ASTM Internationa, West Conshohocken, PA, 2005.
[12] H.J. Mcqueen, E.H. Chia, E.A. Starke, JOM 38 (1986) 19-24.
[13] H.J. Mcqueen, K. Conrod, G. Avramovic-cingara, Can. Metall. Quart. 32 (1993) 375-386.
Amsterdam; New York, 1996.
[15] G.E. Dieter, Mechanical metallurgy, 3rd ed., McGraw-Hill, New York, 1986.
[16] O. Ryen, O. Nijs, E. Sjolander, B. Holmedal, H.E. Ekstrom, E. Nes, Metall. Mater. Trans. A 37A (2006) 1999-2006.
[17] D.E. Newbury, Anal. Chem. 54 (1982) A059-A064.
[18] E. Kandare, S. Feih, A. Kootsookos, Z. Mathys, B.Y. Lattimer, A.P. Mouritz, Mater. Sci. Eng. A 527 (2010) 1185-1193.
[19] T. Hasegawa, T. Miura, T. Takahashi, T. Yakou, ISIJ Int. 32 (1992) 902-908. [20] P.K. Chaudhury, F.A. Mohamed, Mater. Sci. Eng. A 101 (1988) 13-23.
[21] N.N. Du, Y. Qi, P.E. Krajewski, A.F. Bower, Metall. Mater. Trans. A 42A (2011) 651-659.
[22] X. Sauvage, N. Enikeev, R. Valiev, Y. Nasedkina, M. Murashkin, Acta Mater. 72 (2014) 125-136.
[23] P.K. Chaudhury, K.T. Park, F.A. Mohamed, Metall. Mater. Trans. A 25 (1994) 2391-2401.
[24] O.D. Sherby, A. Goldberg, O.A. Ruano, Philos. Mag. 84 (2004) 2417-2434. [25] R.N. Lumley, A.J. Morton, I.J. Polmear, Acta Mater. 50 (2002) 3597-3608.
Chapter 2
Literature review
2.1 Introduction of 8xxx aluminum conductor alloys
2.1.1
Industrial application of 8xxx aluminum conductor alloys
Of all the conducting elements, aluminum and copper are often used as current carrying conductors due to their conductivity and mechanical properties. Although electrical conductivity of aluminum is somewhat less than that of copper, has long been used as an electrical conductor in view of its light weight and lower price. The first use of aluminum for electrical purposes was invented in Britain in 1876. And it entered service in transmission lines in 1909. In the US, utilities have used Al wires for over 100 years.
However, until 1965, the AA1350 aluminum conductor alloy began to be widely used for residential buildings. This alloy has a conductivity of 61 %IACS compared to 103 %IACS for pure copper but a density of only 30%, so that it is a far more effective medium than copper for conductors that have to be supported on overhead line structures. Meanwhile, widespread cost that the price of copper was very high made the installation of aluminum conductors a very attractive alternative. However, several issues were encountered with the use of AA1350 aluminum alloy conductor in household applications. Some junction failures occurred due to gradual loosening at the terminals that caused damage and fires [1-3].
Therefore, a new series of alloys, namely 8xxx aluminum alloy with 0.3−0.9 wt.% Fe which was registered in Aluminum Association to replace AA1350 alloys for the overhead electrical transmission [4]. The comprehensive performance, and high creep resistance of this type of conductors when installed properly can be just as safe as copper. The high extent Fe in these alloys are advantageous when the wire is batch annealed at 200−250 °C. However, it is bad for the flash annealing when the annealing conducted at higher temperature for shorter times.
2.1.2 Fabrication process of 8xxx aluminum conductor alloys
The product of 8xxx conductor is fabricated by Properzi continuous casting methods [5]. When the billet is continuously rolled to a rod with total strain of 4.3 (98.6%), the subgrain were formed and the size of subgrains greatly decreased during the process (i.e., for Al−0.65 wt.% Fe alloys, after 3 passes and 13 passes, the temperature T declines from 485 to 180 °C and subgrains decrease from 6.0 µm to 1.1 µm [6]). This heavy reduction breaks the eutectic compounds into segments and distributed throughout the aluminum matrix. Without an intermediate annealing treatment in order to retain the substructure, the rolled rod is transferred directly to wire drawing. At completion the wire is given a recovery annealing treatment which raises electrical conductivity and ductility without greatly changing the subgrain size.
In order to have better combination of mechanical and electrical properties in 8xxx aluminum conductors, processing parameters are investigated including extrusion ratio, homogenization and novel manufacturing process. Guo et al. [7] studied the influence of the extrusion ratio on the AA8030 aluminum alloys rods, and obtained the best ratio of 13, which showed the maximum electrical conductivity of 60.8 %IACS. Engler et al. [8] investigated the evolution of microstructure during homogenization and subsequent rolling and back-annealing for the Al−Fe−Mn alloy AA8006 to understand the underlying mechanism that control the recrystallization behavior of the alloys. In the research of Zhang et al. [9], it is found that Al−0.7 wt.% Fe−0.24 wt.% Cu alloy manufactured using horizontal continuous casting and subsequent continuous forming method showed well combined mechanical properties and electrical conductivity; in addition, a better creep resistance under condition of 90 °C and 76 MPa is obtained.
2.1.3 Alloying elements in 8xxx aluminum conductor alloys
In general, pure aluminum is weak and the aluminum conductors in transition lines have been developed by addition of other elements to improve the distribution and morphology of the stabilizing particles to improve the comprehensive properties. The addition of alloying additives, such as Fe, Cu, and Mg, was added in 8xxx aluminum alloys. These additions in aluminum may create a solid solution or individual phases, which will be discussed in the following.
Fe
The solid solubility of Fe in aluminum is very low (0.054 wt.% at 650 °C and about 0.005 wt.% at 450 °C [11]), and therefore most of Fe combines with both aluminum and silicon to form secondary intermetallic phase, such as AlmFe, FeAl3, Al6Fe, and α-AlFeSi
(Al8Fe2Si) [10-12]. The typical morphologies for four different frequent intermetallics are
shown in Fig. 2.1 [12]. Besides, the phase transition occurred under certain conditions. Shakiba et al. [12] has indicated that the phase transformation from the metastable AlmFe or
α-AlFeSi phase to the FeAl3 equilibrium phase occurred during the homogenization
treatment in the temperature range of 550 to 630 °C.
Fig. 2.1 Backscattered electron image for four different types of frequent Fe-rich particles: (a) AlmFe, (b) Al6Fe, (c) FeAl3 and (d) α-AlFeSi (Al8Fe2Si).
During the aluminum conductors fabrication process, the eutectic network was broken up into small particles and uniformly distributed through the matrix [6]. The metastable Fe-bearing intermetallic compound was reported to be FeAl3 or Al6Fe [6,13], with
morphology in Fig. 2.2(a). Besides, these coarse dispersed particles could pin on the subgrain as shown in Fig. 2.2(b), which retard the dynamic recovery in aluminum alloys [6,14]. The particle strengthening and substructure strengthening due to Fe greatly increased the stress in 8xxx aluminum alloys.
Fig. 2.2 Optical micrograph (a) and TEM image (b) of Al−0.75 wt.% Fe−0.15 wt.% Mg alloy rods continuously fabricated [13]
(magnification 500 times for optical micrograph).
Cu
The solid solubility of Cu in aluminum is much higher than Fe (5.7 wt.% at 548.2 °C and about 3.5 wt.% at 450 °C [15]). It is reported that small addition of Cu in solid solution could result in the fine substructure during the hot deformation process due to the lower diffusion rate [16]. Small amount of Cu in solid solution resulted in retardation of dislocation movement and enhanced the rate of dislocation multiplication.
On the other hand, Cu is often added to improve the strength of aluminum alloys. However, addition of Cu more than 1.1 wt.% results in the formation of coarse intermetallics during casting, which causes the corrosion. In addition, addition of copper causes greatly decreasing of electrical conductivity. Consequently, it is favourable to have a proper copper content by balancing the strength and electrical conductivity.
Mg
Mg has a very high solid solution in aluminum. At room temperature, aluminum can dissolve up to 1.7 wt.% Mg at equilibrium and the solubility increased up to 14.9 wt.% at 450 °C. Due to the relatively high diffusion rate, Mg in solid solution state could form clusters, which could significantly increase the stress of aluminum alloys [17].
Besides, Mg is often added to improve the mechanical properties of aluminum alloys. However, addition of Mg causes great decrement in electrical conductivity. Consequently, there is a trade-off between the mechanical property and electrical conductivity.
2.1.4
Properties requirements for aluminum conductors
The aluminum conductors must possess to be safely developed to have a good combination of high electrical conductivity, high mechanical properties, and high creep resistance to stress relaxation for contact stability [1,6,18,19].
Firstly, high electrical conductivity is mostly desirable for conductors. Low electrical conductivity will cause great energy losses in the application and lead to temperature problems. The minimum requirement for electrical conductivity is 61.0 %IACS for applications in building conductors [20].
Besides, the aluminum conductor alloys should have sufficient mechanical properties to meet the minimum requirements imposed by service conditions in electrical applications. In general, a minimum ultimate tensile strength of 103 MPa in straining hardening and partially annealing state is needed for aluminum conductors [20]. Table 2.1 shows the comparison of mechanical properties and electrical conductivity of some typical aluminum conductor alloys [5].
Table 2.1 Comparison of physical and mechanical properties of some typical aluminum conductor alloys.
Alloys UTS (MPa) YS (MPa) EL % Electrical conductivity (%IACS)
Al-0.5Fe-0.5Co 145 120 18 59.8
Al-0.65Fe 125 110 20 60.4
Another property that needed for the application of aluminum conductor is high creep resistance [21]. Creep is a permanent deformation resulting from an applied stress in a material over a long duration of time. In practice, stress relaxation by creep occurred at operation temperature up to 100 °C allows subsequent decrease in contact pressure [19]. This results in gradually loosening at terminals, and causes an increase of the constriction resistance [22], which in turn increase the temperature due to the increase of resistance. The joint force decreases significantly and further leads to increase in joint resistance [21]. Though creep property is very important for aluminum conductors, to the author’s knowledge, limited reference is available for systematically study on the creep properties of 8xxx aluminum conductor alloys.
2.2 Electrical properties of 8xxx aluminum conductor alloys
In the development of suitable conductor alloys, electrical conductivity is the primary criterion to be considered. Electrical conductivity is the ability of a material to measure how well it can carry a flow of electrons. The electrical conductivity of extreme purity aluminum (99.99%) at room temperature is 64.94% of electrical resistivity annealed copper based on the international standard (%IACS) [23]. The electrical conductivity of the annealed copper (5.8001 x 10⁷ S/m) is defined to be 100 %IACS at 20 °C.The unit of electrical conductivity is S/m, however, for convenience, electrical conductivity is frequently expressed in terms of %IACS. Conductivity values in S/m can be
converted to %IACS by multiplying the conductivity value by 1.7241 × 10⁻⁶ as shown in the
following equation:
%IACS = 1.7241 × 10⁻⁶ S/m ··· (Eq. 2.1)
Electrical conductivity of aluminum strongly depends on quantity of impurities and metallic additions [23-26]. The solute contents in aluminum matrix could enhance scattering of free electrons by the creation of defects and dislocations, which reduce the electrical conductivity [27]. According to I. N Fridlyander [23], impurities have negative influence on electrical conductivity of aluminum, which depends on quantity of solute and metallic additions. It can be arranged in the following order: Cr, V, Mn, Ti, Mg, Ag, Cu, Zn, Si, Fe, Ni. A summary of the maximum solubility of various elements in aluminum is shown in Table 2.2, together with the average increase in resistivity per 1% of the element in solution and out solution [28]. The formation of dispersoids or precipices had less effect in decreasing electrical conductivity than that of solute.
Table 2.2 Effect of alloying elements in and out of the solid solution on the resistivity of aluminum.
Elements Maximum solubility in Al, wt.% Average increase in resistivity, wt.%, µΩ.cm In Solution Out of Solution
Cr 0.77 4.00 0.18 Cu 5.65 0.344 0.30 Fe 0.052 2.56 0.058 Li 4.0 3.31 0.68 Mg 14.9 0.54 0.22 Ni 0.05 0.81 0.061 Si 1.65 1.02 0.088 Ti 1.0 2.88 0.12 V 0.5 3.58 0.28 Zn 82.8 0.094 0.023 Zr 0.28 1.74 0.044
Note: Addition to high purity Al base resistivity of 2.71 µΩ.cm at 25 ºC
Besides, the influence of alloying elements on electrical conductivity can be quantitatively determined accordingly to the Matthiessen rule [29]. The relationship between EC and the concentration of alloying elements in solid solution (wt.%) can be expressed as follows:
EC1 =ρb+ ρi
i
∑
Ci+ρPfP ··· (Eq. 2.2)where ρi is resistivity of the base alloy, is the sum of the resistivity contributions from the various solution additions, i.e. ρi is the resistivity parameter and Ci is the concentration of the ith solute, ρp is the resistivity parameter of the particles to resistivity and fp is the particles volume fraction. In as-homogenized state, the relationship between the
ρi
i
electrical conductivity (EC, S/m) and the concentraion of alloying elements in solid solution can be expressed as follows [30,31]:
1
EC =0.0267 + 0.0032Fess+0.0068Siss+0.003Mgss+0.0021Particle% ··· (Eq. 2.3)
where, Fess, Siss, and Mgss are the weight percentages of these elements in solid solution, and the last part in this equation is the total volume fraction of particles which is an estimation of the particle contribution to the electrical resistivity. However, the parameter for the particle contribution would be variable, which depends on the shape and size of the particles in the alloys [26].
2.3 Mechanical properties of 8xxx aluminum conductor alloys
For aluminum conductors, it is necessary to have high mechanical properties to stress relaxation for contact stability, and will not be susceptible to oxide growth [32]. To effectively improve mechanical properties of an aluminum conductor, the strengthening mechanisms must be applied, which has the optimum ratio of increase in strength to resistivity (Δσ/Δρ), as indicated in Table 2.3. Substructure strengthening, solid solution strengthening and particle strengthening could be the effectively strengthening mechanism for aluminum alloys and would be discussed below.Table 2.3 Comparative effects of different mechanisms on strength and resistivity in aluminum [33].
2.3.1
Substructure strengthening
The substructure of an aluminum alloy consists of a mixture of single dislocations and dislocation arrangements, which is formed as a result of recovery [34]. During deformation, the mobile dislocations interact with the substructure and the mobility of the dislocations is reduced. The slip length (i.e., the average distance of a mobile dislocation travels from the source to becoming stored in the substructure) depends on these interactions [35]. The fine substructure will act as barriers to slip, and results in a reduced mean free path for dislocation movement. The effect of grain boundaries on the room temperature strength of metals can be described by the relationship as follows [36]:
σy = σ0 + kds−1 ··· (Eq. 2.4)
where σ0 is the yield strength of a substructure free metal with the same grain size, k is a constant that is related to the strength of subboundary, ds is the subgrain diameter. At elevated temperatures, the substructure strengthening may be described by a relationship as follows:
σy = σ0 + kds−1/2 ··· (Eq. 2.5)
Rack and Cohen [37] have shown this to be the case for heavily deformed Fe alloys. Data from the review paper of Mcelroy and Szkopiak [38] on aluminum, iron, and iron-based alloys also correlate well with ds−1/2.
development and stabilization of a fine substructure, which would be the alloying elements in solid solution state and the formation of particles. Firstly, the alloying elements in solution could result in a retardation of dislocation movement, an enhanced rate of dislocation multiplication and a restriction of dynamic softening process [16,39,40]. Shakiba et al. [16] investigated the hot deformation behavior of Al−Fe−Si alloys containing 0.05−0.31 wt.% Cu at a temperature range of 440−550 °C, and found that addition of Cu retarded the dynamic recovery and decreased the subgrain size and mean misorientation angle of the grain boundaries. Furu et al. [39] showed that an addition of 1% Mg produces a solute drag effect during the hot deformation of aluminum resulting in a slightly smaller subgrain size. Shi et al. [40] studied the hot deformation behavior of 7150 aluminum alloys containing (0.01−0.19 wt.%) vanadium at various temperatures (300−450 °C) and strain rates (0.001−10 s−1), and pointed out that as little as 0.03 wt.%
vanadium could significantly reduce the subgrain size during the hot deformation process due to the low diffusion rate of vanadium solute atoms. Besides, addition of alloying elements in solid solution was also helpful in the generation of dislocations, lead to a high dislocation density for given amount of deformation. The high dislocation density would accelerate the cell formation and produce a fine substructure [34].
Secondly, the formation of particles due to alloy additions would benefit for the development and stabilization of a fine substructure due to the strong pinning effect on the dislocation motion and migration of grain boundaries [6,14,41-43]. In these materials, the
subgrain size is a function of the particle spacing [42]. Shakiba et al. [14] studied the hot deformation behavior of Al−Fe−Si alloys containing various amounts of Fe (0.1−0.7 wt.%) and Si (0.1−0.25 wt.%) at various temperatures (350−550 °C) and strain rates (0.01−10 s−1), and found that with increasing of the Fe content dynamic recovery was greatly inhibited which is associated with a decrease in the subgrain size and mean misorientation angles. Fig. 2.3 shows an example that a large part of the intermetallic particles distribute on the subgrain boundaries, which increases the pining effect on subgrain boundaries and hence enhances the subgrain stability [41].
Fig. 2.3 TEM micrograph of Al−Fe−Mg alloys showing particles on sub-boundaries [41].
2.3.2
Solid solution strengthening
The introduction of foreign atoms into a crystal lattice invariably interfered the structure of the base metal increase the strength of the material [35]. Solid solution additions can be helpful by their effect on the stacking fault energy and the ability to tie up defects, thus hindering dislocation motion. The main strengthening mechanisms have been suggested as the elastic interaction due to the size misfit and the modulus misfit between the solute atoms and solvent atoms [44,45]. The size of the solute atom differs from the solvent atoms create a strain field, which will interact with dislocations and give rise to the energy. The modulus misfit is related to the difference in bind force between the solute atoms and the matrix atoms, which creates a soft or hard “spot” in the matrix and an interaction with the moving dislocation is occurred.
Previous work has been done on the solid solution hardening in aluminum alloys [35,45], and found that the strength is affected by the amount and type of alloy additives in aluminum matrix. The relationship between the flow stress and the alloy concentration is generally expressed as follows:
σss = σb + HCn ··· (Eq. 2.6)
where σb is the stress of the base alloy and H and n are constants. The value of n is reported in the range of 0.5−1.0 of pure fcc substitutional solid solutions [35].
the strength by solid solution strengthening [17,35,46]. Addition of Cu and Mg has the high relative difference in atom size and shear modulus misfit with aluminum, as illustrated in Table 2.4, which cause a strong solid solution strengthening effect.
Table 2.4 Atomic radius, shear modulus and strengthening parameter H of Cu and Mg in aluminum [46].
Elements H MPa (at.%)−1 Atomic radius r (Å) Shear modulus G (GPa)
Al - 1.43 26.2
Cu 119.8 1.28 48.3
Mg 69.4 1.60 17.0
Ryen et al. [35] reported that Mg in a solid solution give a nearly linear concentration dependence of strength for commercially pure aluminum alloys. Mamala and Sciezor [47] studied the effect of small amount of (0.1−0.6 wt.%) Cu and (0.3−0.9 wt.%) Mg on the Vickers hardness of aluminum alloys in as cast and heat treated tempers, and the results are summarized in Table 2.5.
Table 2.5 Estimated increase of aluminum hardness caused by 1% addition of Cu and Mg in different tempers.
Alloying
elements As cast, HV
Homogenized and fast cooled to water, HV
Homogenized, slow cooled and heated in 250°C, HV
Cu 18.6 17.0 16.2
2.3.3
Particle strengthening
A common classification of the different particles that may be present in aluminum alloys is roughly given as follows: (1) unshearable primary or constituent particles, which are formed during solidification, (2) unshearable dispersoids, which are formed during homogenization. The dispersoids impose a Zener drag on grain boundaries which implies that they prohibit recrystallization and grain growth, and (3) precipitates that are formed by solution heat-treatment followed by aging.
The materials in this work are of non-heat-treatable strengthened aluminum alloys and the most relevant part of particle strengthening is the unshearable primary or constituent particles. Heat treatment of such an alloy will generally not produce any strengthening precipitates as in the heat-treatable alloys. The contribution of unshearable particles to the strength of alloys can be evaluated by the Orowan mechanism, as shown in Fig. 2.4. A dislocation passing through two particles will bend initially. At stage 3, it has reached to critical curvature, and when the segments meet on the other side they have opposite signs and leave a dislocation loop around each other (stage 4).
Fig. 2.4 Sketch of a dislocation passing two hard particles, based on the Orowan mechanism [44].
The strengthening due to Orowan dislocation looping is given by an equation as follows [42]:
ΔσOr =M 0.4
π 1−νGb λ ln(1 2rb ) ··· (Eq. 2.7)
where v = 0.34 is the matrix Poisson’s ration and λ is the inter-precipitate distance, which is calculated according to the equation [48]:
λ =d( 4 fπ −1) ··· (Eq. 2.8)
where f is the volume fraction of the particles and d is the average particle diameter.
Generally, alloying elements (mainly Fe in this study) in 8xxx aluminum could form dispersoids due to its low solubility [11], which would cause particle strengthening. Addition of Fe could improve the mechanical properties of 8xxx aluminum alloys due to the
formation of Fe-containing particles [18,36,49,50]. Jablonski et al. [49] have shown that an addition of 0.5 wt.% Fe in AA8176 aluminum alloys resulted in a great improvement in ultimate tensile strength under drawing condition without significant deterioration on its electrical properties.
2.4 Creep behaviour of aluminum conductor alloys
At room temperature, most metals deform in a way that depends on stress but not on time. As the temperature increased, low loads can give permanent progressive deformation, which is termed creep [44]. Due to the lower creep resistance, the application of aluminum conductors is greatly restricted. In the following session, the creep phenomenon, characterization of creep properties, possible creep mechanisms occurred in aluminum conductor alloys and creep behavior in aluminum conductors will be discussed.
2.4.1 Creep phenomenon
The behavior of aluminum alloys at elevated temperatures is primarily controlled by a phenomenon termed creep. Creep is a permanent deformation of material at constant stress and temperature. The typical shape of a creep curve can be represented as shown in Fig. 2.5. The slope of creep curve is referred to as the creep rate ( !ε=dε/ dt), which indicates the elongation speed of the specimen with time [44]. When loads are applied, an instantaneous deformation (𝜀𝜀0) occurs as a combination of the elastic and plastic response.
Fig. 2.5 Typical creep curve showing the three stages of creep. The dotted line shown in the figure is for the compression creep curves.
It is generally considered that there are three different regions of creep in the unreinforced alloys [51]. The primary creep region that occurs upon initial loading exhibits a very high creep rate as the material elastically and plastically responds to the applied load. As the material deforms, the material is strengthened through strain hardening, leading to the decreasing creep rate. This stage is the dominant form of creep observed at low stresses and at low temperatures relative to the melting point of the material [44,51-53].
Primary creep gradually transitions into the steady-state creep stage (or minimum creep stage) with increase of time. During the steady-state creep, the creep rate changes little with time under a constant stress due to an equilibrium between recovery and hardening [54]. In an ideal material, the hardening rate is exactly proportional to the recovery rate, and the steady-state creep rate can be described by the relationship [55]
!
ε= r
h ··· (Eq. 2.9)
where h is the hardening rate and r is the recovery rate. In reality, some creep deformations do not exhibit a well-defined steady-state stage. Instead, the material will demonstrate a continuously decreasing creep rate with time, which is more suitable to be defined as a quasi-steady-state stage [56]. In these cases, the quasi-steady-state creep curves can be assumed to be linear decrease with increase of time for the purpose of conventional creep analysis with little impact on the quality of the subsequent results [57,58]. The steady-state creep region dominates most of the time of the test, especially during long time creep tests at low temperature and stress. Therefore, the steady-state creep rate is one of the most important design parameters derived from the creep curve for the design of components.
As creep continuing, the steady-state creep transitions into the third stage, typically identified as a tertiary creep (in tension) [51]. Continuous deformation produces voids or internal cracks which in turn decrease the cross-section (necking) and increase the stress. This accelerates the creep rate as shown in the tertiary stage of the creep curve in Fig. 2.5. The tertiary stage is mainly observed at high temperatures and high stresses creep tests. This region is always very short and is the final stage of creep before rupture occurs [54,59]. However, in compression creep curves, there is no such necking as occurred in tension creep, due to the geometric effect that the sample cross-section will get larger with increased strain [58,60]. Thus, the steady-state creep stage dominated during compression creep. As shown
in Fig. 2.5 (dotted lines), the compressive creep curves can be generally divided into two different stages, and no tertiary creep was observed.
2.4.2 Characterizations of creep properties
Creep deformation has been shown to be a strong function of stress, temperature and microstructures [51,61]. Garodo et al. [51,58,62] have proposed several forms of equations to describe the total creep strain ε(t) during the creep test. In these equations the total strain and time dependent creep rates are summed. In cases where the creep strain and temperature are lower, the creep strain can be expressed by [62]
ε(t) = (kTλ )ln(1+ tτ) ··· (Eq. 2.10)
where and τ are constant, T is experimental temperature. Parameters kT λ and τ
are determined by experimental condition. For this research, the more attention is paid to the minimum creep (𝜀𝜀�), which is given by a simple power law:
!
εm=Aa(σG)n exp(− Qa RTa ) ··· (Eq. 2.11)
where Aa is a constant for all stresses and temperatures, σ is the applied stress, G is the shear modulus, na is the apparent stress exponent, Qa is the apparent activation energy for creep, R is the gas constant and T is absolute temperature. The shear modulus is temperature dependent and calculated from the equation (given as G = 25.4 [1 − 0.5 (T − 300) / 933] with GPa unites) [48]. Under the fixed constant in temperature, the stress exponent na can be
calculated according to the following equation:
na = ∂ln !εm/ ∂lnσ ··· (Eq. 2.12)
The activation energy Qa can be measured by the temperature-cycling method [63]. In this method, a specimen was subjected to a number of rapid changes in temperature while under constant stress. The apparent activation energy was then determined after each temperature changes for the relation as follows:
Qa = Rln(
! ε1/ !ε2)
(T1−T2) /T1T2 ··· (Eq. 2.13)
where and are the instantaneous creep rates immediately before and after the change in temperature from T1 to T2. The activation energy is designated as the apparent energy for creep because it is empirically determined. Many different mechanisms may be interacting to cause the observed Qa, but can not be separated based only on the experimental data.
The values of na can be used to estimate the creep mechanism in unreinforced aluminum alloys. However, in dispersion strengthened aluminum alloys, the apparent stress exponent (na) is higher and variable [64,65]. This behavior can be modeled by introducing in a threshold stress, σth, below which creep is not measurable experimentally [64]. After incorporating σth, Eq. 2.11 can be modified as follows [66,67]:
𝜀𝜀� = 𝐴𝐴�(������)��exp (−���) ··· (Eq. 2.14) !ε1 !ε2
The incorporation of a threshold stress into the analysis is usually effective in giving values of nt that is similar to those obtained in the unreinforced matrix materials. According to the different na values, the creep mechanisms can be estimated. For the threshold stress, more discussion will be present on the following session.
2.4.3 Creep threshold stress
Unlike pure aluminum where dislocation-dislocation interactions and the development of a dislocation substructure are significant, in dispersoids strengthened aluminum alloys the dislocation - dispersoids interactions are of primary importance. It is common seen that the existence of unshearable particles inhibit the motion of moving dislocations, meanwhile solute atoms dissolved in alloy matrices can also have a pinning effect on mobile dislocations [36,68-71]. A creep threshold stress may exist, which is defined as a lower limiting stress below which no measurable creep rate can be experimentally achieved [64]. The presence of a threshold stress plays an important role in controlling the apparent creep behavior [72-74]. The following section will discuss the origin of threshold stress and the methods in determining threshold stress.
2.4.3.1 Definition of threshold stress
The origin of threshold stress in a material is alternatively interpreted to be the inhibition of dislocation movement either by particles [36,69], by solute atoms [70,71], or by the multiple sources [48].
1. Interaction between particles and dislocations
In the dispersion strengthened aluminum alloys, the presence of the unshearable particles could greatly strengthen the creep resistance [68]. It has been suggested that the particles act as effective barriers to the movement of dislocations and give rise to threshold stress for creep [73]. Lin et al. reported that the dislocation particle interaction configuration as shown in Fig. 2.6, suggesting the presence of threshold stress [66].
Fig. 2.6 Configuration representing particle dislocation interactions in 2014 Al, revealing the presence of threshold stress [66].
Several models have been proposed to explain the nature of the interaction between dispersion particles and dislocations and to give the magnitude of threshold stress: (a) the threshold stress is the stress required to bow the dislocation between two particles [75,76], corresponding Orowan stress σor, (b) the additional back stress associated with the local climb of dislocations over an obstacle [77,78], referred as σb, and (c) the stress associated with detaching a dislocation from an obstacle which exerts an attractive interaction [72,79], termed as σd. The equations for the three possible models together with various parameters are given in Table 2.6.
Table 2.6 Threshold stress models proposed for the dispersoids strengthened alloys.
Model Stress References
Orowan stress 𝜎𝜎�� = 0.84𝑀𝑀(���)�� [75,76] Local climb (back stress) σb =0.3M(Gbλ ) [77,78]
Detachment stress 𝜎𝜎� = 𝜎𝜎�� 1 − 𝐾𝐾� [72,79]
M is the appropriate Taylor factor, λ is the inter-particle spacing, and d is average
particle diameter;
K is a relaxation parameter that takes value between 0 (maximum attractive interaction)
and 1 (no attractive interaction).
Usually, the magnitude of the threshold stress is related with the particle radius [48]. When the average radius is small, the experimental measured threshold stress is smaller than the calculated Orowan stress [42,48,80]. Marquis et al. [80] showed that the threshold stress
increased from 9% to 70% of the Orowan stress for dislocation looping with increasing average particle radius from 2 to 25 nm in Al−Sc alloys. The normalized threshold stress, defined as the ratio of the measured threshold stress to a calculated Orowan stress, is plotted as a function of average precipitate radius as shown in Fig. 2.7, has been reported by many researches [42,81,82].
Fig. 2.7 Creep threshold stress, normalized with respect to a calculated Orowan stress at 300 °C, as a function of average precipitate radius.
When the average radius is large, the experimental measured threshold stress is larger than the calculated valued which is probably due to the load transfer and substructural strengthening effect, similar as the effect in aluminum composites [67,73,83]. Load transfer
![Fig. 2.3 TEM micrograph of Al−Fe−Mg alloys showing particles on sub-boundaries [41].](https://thumb-eu.123doks.com/thumbv2/123doknet/7623361.235028/46.918.304.658.517.904/fig-tem-micrograph-al-alloys-showing-particles-boundaries.webp)
![Fig. 2.4 Sketch of a dislocation passing two hard particles, based on the Orowan mechanism [44]](https://thumb-eu.123doks.com/thumbv2/123doknet/7623361.235028/50.918.234.734.140.361/fig-sketch-dislocation-passing-particles-based-orowan-mechanism.webp)
![Fig. 2.6 Configuration representing particle dislocation interactions in 2014 Al, revealing the presence of threshold stress [66]](https://thumb-eu.123doks.com/thumbv2/123doknet/7623361.235028/57.918.329.632.650.1000/configuration-representing-particle-dislocation-interactions-revealing-presence-threshold.webp)

![Fig. 2.16 Schematic illustration of strain rate versus stress for Al−Mg alloy, showing the transition in creep mechanisms [116]](https://thumb-eu.123doks.com/thumbv2/123doknet/7623361.235028/77.918.258.666.188.485/schematic-illustration-strain-versus-stress-showing-transition-mechanisms.webp)