transportation in Canada: a time use approach of the active lifestyle of
3transit users
4 5 6 7Version : Monday, July 13, 2015
8 9 10 11 12
Ugo Lachapelle, PhD (Corresponding author) 13
Département d’études urbaines et touristiques, 14
École des sciences de la gestion, 15
Université du Québec à Montréal, 16
Case postale 8888, Succursale Centre-‐Ville, Montréal (Québec) H3C 3P8 17 Montréal, QC, Canada 18 Phone: (514) 987-‐3000 x5141 19 Fax: (514) 987-‐7827 20 Email: [email protected] 21 22 23 24 25 26 27 28 29 30 31 32 33 34 35 36
Paper Prepared for Presentation at the Transportation Research Board 95nd Annual 37 Meeting 38 39 Word Count: 40 Abstract: 249 words 41
Paper: 2,820 + (Tables: 2*250 + Figures: 3x250= 1,250) = 4,070 words
42
ABSTRACT
44
45
The use of public transit has been positively associated with active transportation mainly 46
because active transport is typically required to access and egress stations. Transit users 47
may adopt a lifestyle that enables them to walk and bicycle more to destinations other than 48
transit stops or stations. This study seeks to analyze the relationship between public transit 49
use and active transportation in residents of larger urban areas of Canada. Using an urban 50
sample of the time use module of Canada’s General Social Survey (2005, n= 10,867, 51
weighted to represent 15,298,948 Canadians), meeting Canadian physical activity 52
guidelines of 30 minutes or more of moderate physical activity through walking on survey 53
day was assessed using a logistic regression. Using public transit during the day was the 54
main correlate, controlling for socio demographic characteristics and survey day. Transit 55
users (8.5%) met physical activity guidelines (Adjusted Odds Ratio: 1.66 and 2.87 56
respectively for bus and subway/train) by walking to public transit or to other 57
destinations. Additional analysis of walk time by purpose shows that trip duration do not 58
vary significantly between transit users and non-‐users once an individual walks for a 59
specific purpose, but a higher proportion of transit users walked for each studied purpose. 60
Above and beyond the walks to public transit stops or stations, transit users perform more 61
active transportation to destinations by taking more trips for various purposes. Promoting 62
public transit use by developing infrastructure may provide health benefits beyond a 63
reduction in travel related energy use and Greenhouse gas emissions. 64
65
Key words: Mass transportation, Walking, Travel, Time use, Physical activity guidelines
66 67
INTRODUCTION
69 70
Because of the important potential health benefits associated with physical activity (1,2), 71
and the limited amount of Canadians being sufficiently physically active on a regular basis, 72
the practice of active transportation (AT), walking or cycling for the purpose of reaching 73
destinations, has been identified as a potentially important source of physical activity (3,4). 74
In 2011, 54% of Canadians were considered active or moderately active (5), an increase 75
compared to the 52% of active or moderately active Canadians in 2005 (6). 76
77
The total (direct and indirect) health care costs of physical inactivity in Canada in 2009 78
amounted to $6.8 billion, and represented 3.7% of overall health care costs (7). The 79
Canadian Society for Exercise Physiology (CSEP) has established a set of guidelines for the 80
practice of physical activity (PA) (1). On hundred and fifty minutes a week, or thirty 81
minutes a day of brisk walking can improve adults’ personal health, reduce the onset of 82
disease, and help recover from poorer health. Coronary artery disease, stroke, 83
hypertension, colon cancer, breast cancer (in women only), type 2 diabetes, and 84
osteoporosis are some of the most common diseases associated with physical inactivity (7). 85
86
An abundance of research points to the relationship between the built environment and 87
walking (8,9). Environments that are denser have more destinations within walking 88
distance and have a variety of land uses tend to favor walking and have been empirically 89
show to be associated with more frequent and longer bouts of active transportation. 90
91
Transit users are also walkers because most public transit trips require a walk trip at least 92
on one end of a transit journey (10). Estimates for the percentage of transit users reaching 93
PA guidelines by walking to and from transit range from 29% (11) to 35.3% (12) and 40% 94
(13). Average total walk time to and from transit can be in the order of 12-‐49 minutes for 95
work trips depending on transit types and need for transfer (14). Analyses are usually 96
carried out at the level of a city or metropolitan region. Beyond transit access by active 97
transportation, being a transit user increased the likelihood of walking to multiple other 98
destinations both near their homes and workplace (15) but their data did not enable the 99
calculation of time spent walking by purpose. Transit service tends to be associated with 100
denser neighborhoods with more accessible destinations and certain trip may be accessed 101
near the home without taking transit. Once at the destination side of a trip, transit users 102
have no other means of transportation, and are more likely to walk to nearby destinations 103
and services (15). 104
105
The higher level of active transportation of public transit users has also been associated to 106
overweight and obesity (16-‐18), higher energy expenditure (19-‐21) and reduced health 107
care costs (22,23). 108
109
This paper’s objective is to explore how the Canadian General Social Survey (GSS) can serve 110
to confirm these analyses at a national level. Specifically the paper aims to assess the 111
relationship between meeting PA guidelines through walking depending on whether a 112
person used different modes of transit, or not. A secondary objective is to identify 113
differences in engagement in walking for different purposes and average trip duration for 114
users and non-‐users of public transit. 115
116
While a number of authors have used the GSS to assess the practice of physical activity 117
(24), or overall transportation for the entire population (25,26) or for specific groups such 118
as the elderly (27,28), none to this author’s knowledge have analyzed the relationship 119
between active transportation and public transit use. The GSS provides important qualities 120
that can distinguish this analysis from others in its field. Namely, a nationally 121
representative sample of urban Canadians, detailed socio-‐demographic characteristics, 122
detailed information on trip purposes and on variation between days of the week. 123 124 METHODS 125 126
The analysis relies on the time use module of Statistics Canada’s General Social Survey, 127
Cycle 19 (2005, n= 19,597). The GSS is a Computer Assisted Telephone Interview of a 128
random sample of non-‐institutionalized persons 15 years of age or older, living in Canada’s 129
ten provinces (excluding Yukon, Northwest Territories and Nunavut). The weighted sample 130
is representative of the entire non-‐excluded population of Canada (29). Random Digit 131
Dialing (RDD) methods were used to sample participants, and telephone interviews were 132
conducted to retrieve voluntary information. Data was gathered in 2005 between January 133
12 and December 13. The overall response rate was 58.6%. The public use microdata files 134
were used for this analysis. 135
136
This time use survey collects information on activities having taken place on the day prior 137
to the survey call. The designated day begins at 04:00AM and ends 24 hours later. 138
Participants are asked to provide a detailed list of all activities that took place during the 139
24-‐hour period. Types of activities are coded into episode files (nearly 200 activity codes), 140
location where the activity took place (including 9 modes of transportation), start and end 141
time, as well as duration. A person level file that includes information on socio 142
demographic characteristics accompanies the episode file. 143
144
Because public transit is typically not available outside of larger urban centers, the analysis 145
was restricted to participants living inside Census Metropolitan Areas (CMA) and Census 146
Agglomeration (CA). One or more adjacent municipalities centered on a population core 147
form a CMA and a CA. A CMA must have a total population of at least 100,000 of which 148
50,000 or more must live in the core. A CA must have a core population of at least 10,000 149
and a total population of at least 11,000 (29). The population of these 147 areas amounted 150
in 2005 to 20,947,994, or 14,715 respondents. The final sample size (n=10,867) contained 151
all relevant variables included in analysis. Most of the 3,848 missing cases were omitted 152
because they did not report income. 153 154 Dependent Variables 155 156
Using a variable on the total walking duration for active transportation, two dummy 157
variables were created: having walked at all and having walked 30 minutes or more on the 158
diary day. Episode files were also used to create variables for participation and duration of 159
walk trips by purpose. The 24 different activity codes for walking were recoded into 7 160
purposes to combine similar activities with low participation rates. Upon inspection of the 161
episode files, it was found that most respondents bundled walk access, transit wait time, 162
trip time and egress time together as transit trips were not always preceded or followed by 163
walk, bicycling, car or other transit trips. Estimates therefore underestimate the total 164
amount of walking done by participants and should thus be considered as conservative 165
estimates. Bicycle trips were also not included in measures of active transportation for the 166
purpose of this study. Reported bicycling was however very low and preliminary tests 167
showed that including them did not have a strong effect on results. 168 169 Independent Variables 170 171
The main independent variables of interest refer to the use of public transit. Public transit 172
users were identified in a dummy variable as those participants that recorded at least one 173
public transit trip during the survey day. Additional variables identified users of buses and 174
users of subway/train separately. 175
176
Because both walking and transit use has been found to be associated with socio-‐ 177
demographic characteristics (30, 31), age (seven categories), household income (five 178
recoded categories), and dichotomous variables of sex, having worked on survey day, 179
having children under 14, being a recent immigrant (less than ten years) and currently 180
receiving education were used as socio-‐demographic control variables. Canadian Census 181
level analyses concluded that recent immigrants were more likely to commute by public 182
transit (32). 183
184
Further contextual variables were used to describe the diary day (weekend days, vs. 185
weekdays), and whether a person lived in a single family home. This last variable was used 186
as a proxy for land use types surrounding a participant’s home. The five large regions of 187
Canada were also used in analyses to assess cross-‐Canada variations in meeting PA 188 recommendations. 189 190 Analysis 191 192
The sample of users and non-‐users of transit was described using Chi squared tests for 193
categorical variables. A multivariate logistic regression was used to test the hypothesis that 194
using public transportation is associated with meeting physical activity recommendations 195
through active transportation after controlling for covariates. Individual level survey 196
weights were used to expand the survey population to the targeted Canadian population. 197
Graphical analyses enabled the exploration of participation rates and episode specific 198
duration of walking purposes contributing to total active transportation levels. Variation in 199
duration by trip purpose was tested with ANOVA and variations in duration between users 200
and non-‐users for each specific trip purpose was tested using two-‐tailed T-‐tests. Data 201
analysis was carried out using Stata (Version 11.0, StataCorp, College Station, Texas). 202 203 RESULTS 204 205
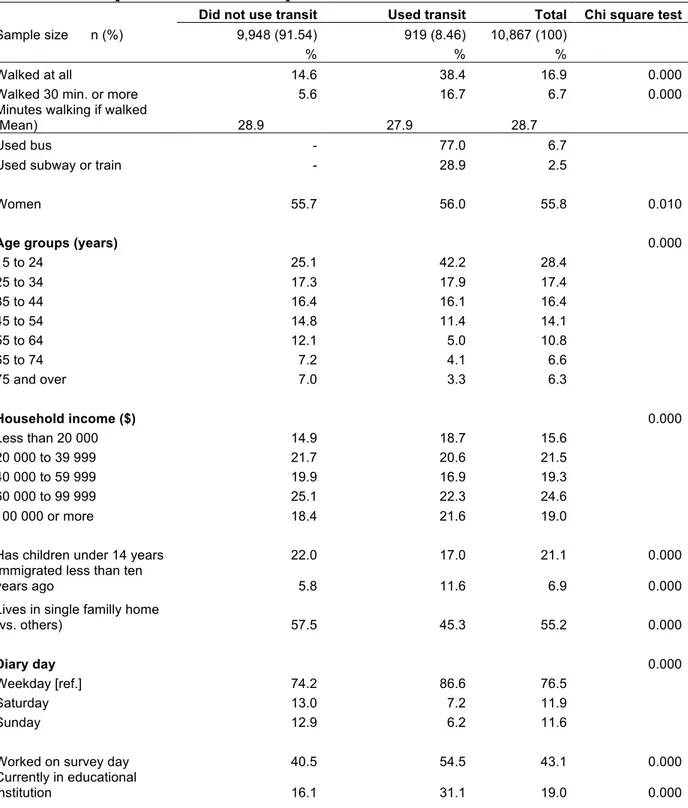
A list of descriptive statistics for the survey sample and sub groups of transit uses and non-‐ 206
users is presented in Table 1. Compared to non-‐users of transit, transit users were younger, 207
had lower incomes, were composed of a higher percentage of women, fewer families with 208
children, more recent immigrants, fewer participants living in single family homes. There 209
was less transit use on the weekends, and transit user had a higher proportion of students 210
and participants who worked on the survey day (All reported differences were statistically 211
significant at the p<0.005 level). 212
TABLE 1 Description of Studied Sample
213
Did not use transit Used transit Total Chi square test
Sample size n (%) 9,948 (91.54) 919 (8.46) 10,867 (100)
% % %
Walked at all 14.6 38.4 16.9 0.000
Walked 30 min. or more 5.6 16.7 6.7 0.000
Minutes walking if walked
(Mean) 28.9 27.9 28.7
Used bus - 77.0 6.7
Used subway or train - 28.9 2.5
Women 55.7 56.0 55.8 0.010
Age groups (years) 0.000
15 to 24 25.1 42.2 28.4 25 to 34 17.3 17.9 17.4 35 to 44 16.4 16.1 16.4 45 to 54 14.8 11.4 14.1 55 to 64 12.1 5.0 10.8 65 to 74 7.2 4.1 6.6 75 and over 7.0 3.3 6.3 Household income ($) 0.000 Less than 20 000 14.9 18.7 15.6 20 000 to 39 999 21.7 20.6 21.5 40 000 to 59 999 19.9 16.9 19.3 60 000 to 99 999 25.1 22.3 24.6 100 000 or more 18.4 21.6 19.0
Has children under 14 years 22.0 17.0 21.1 0.000
Immigrated less than ten
years ago 5.8 11.6 6.9 0.000
Lives in single familly home
(vs. others) 57.5 45.3 55.2 0.000 Diary day 0.000 Weekday [ref.] 74.2 86.6 76.5 Saturday 13.0 7.2 11.9 Sunday 12.9 6.2 11.6
Worked on survey day 40.5 54.5 43.1 0.000
Currently in educational
Region of Canada 0.000 Atlantic 9.2 3.6 8.1 Quebec 21.6 24.3 22.2 Ontario 38.8 48.1 40.6 Prairies 15.6 10.5 14.6 British Columbia 14.8 13.6 14.6 214
Active transportation measures also differed across groups. A higher percentage of transit 215
users walked at all, and reached PA guidelines during the reference day. Among transit 216
users, 77% used buses and 28.9% used subway or trains (results do not add up to 100 217
because some users used both modes during one day). 218
219
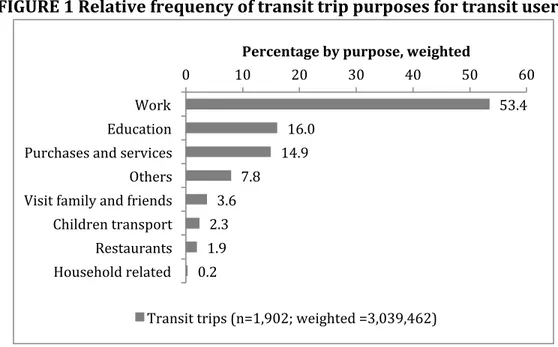
As show in Figure 1, work trips were the main destination of reported transit trips by more 220
than three times the second most popular destination, education related trips. Trips to 221
purchases and services followed. The activity purposes where walking was accumulated 222
are presented in Figure 2 for users and non-‐users of public transportation. Transit users’ 223
participation rates by trip types were usually nearly double or more those of non-‐users for 224
each trip purpose. There were both significant differences (chi squared test) between trip 225
purposes for users and non-‐users and between users and non-‐users by trip purposes. The 226
ordered popularity of trip purposes between users and non-‐users of transit was quite 227
similar. 228
229
FIGURE 1 Relative frequency of transit trip purposes for transit users
230
231
232
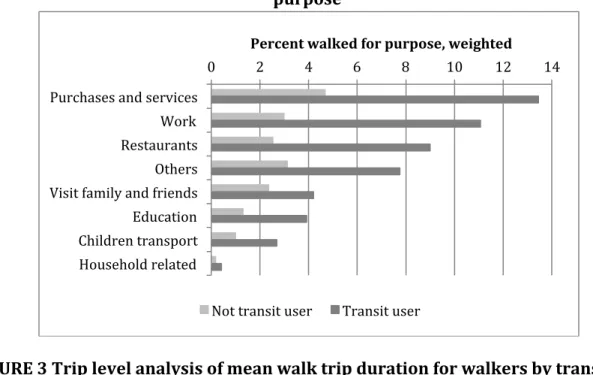
The average durations of trips by purpose depending on participants being transit users or 233
not are presented in Figure 3. For those who performed active transportation trips, mean 234
walk time per trip was not significantly higher for transit users (ANOVA test). Trip duration 235
by purpose was similar for users and non-‐users (non significant T-‐test results) and 236
hovered between 10 and 15 minutes. Both for users and non-‐users, duration was 237
significantly different by trip purpose (using ANOVA test). For children transportation, the 238
sample sizes were too small to produce reliable estimates, but were included to match 239
information produced in other figures. 240
241
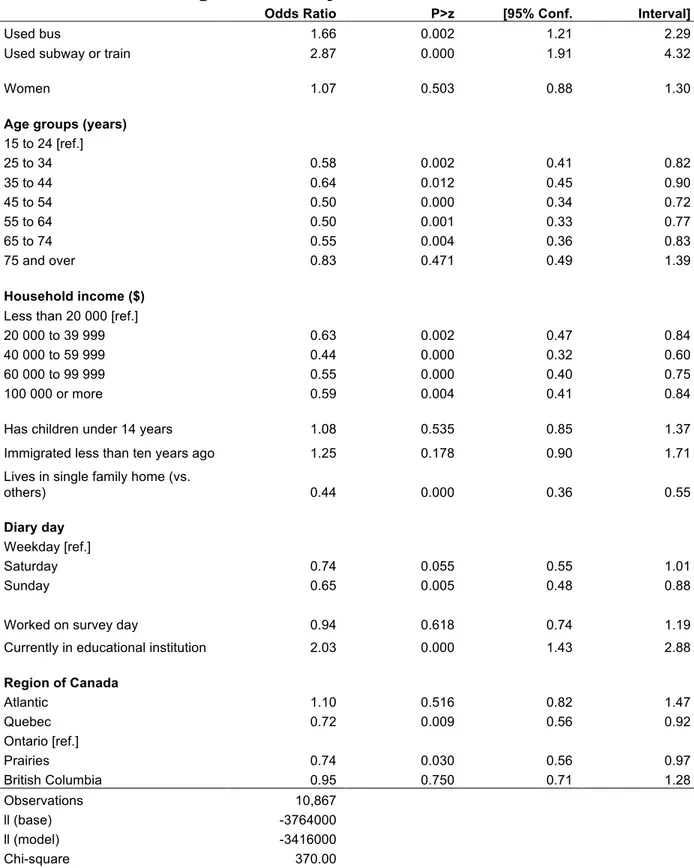
The results of the multivariate logistic regressions are presented in table 2. In a base model 242
of meeting physical activity recommendations including only independent variables on 243
transit use, the OR of using any form of transit on meeting the physical activity 244
recommendation was of 2.78 (CI: 2.28-‐3.40). 245 53.4 16.0 14.9 7.8 3.6 2.3 1.9 0.2 0 10 20 30 40 50 60 Work Education Purchases and services Others Visit family and friends Children transport Restaurants Household related
Percentage by purpose, weighted
246
247
FIGURE 2 Percentage of transit users and non-‐users engaging in walk trips by
248 purpose 249 250 251
FIGURE 3 Trip level analysis of mean walk trip duration for walkers by transit use
252
253
254
These values were respectively 2.57 (CI: 2.06-‐3.22) and 3.11 (CI: 2.23-‐4.33) for using buses 255
and the subway/train. When adding all other control variables (which presented significant 256
differences between transit users and non-‐users in Table 1) to this model, the Adjusted 257
Odds Ratio of using buses and subway/train respectively dropped to 1.66 and 2.87 but 258
were still highly significant. Numerous socio demographic variables were also significantly 259
associated with meeting the physical activity recommendation. There were no difference 260
between men and women. As age and income increased, the likelihood of meeting the 261
physical activity recommendation decreased. Living in a single family home decreased odds 262
of meeting recommendations. Participants that were surveyed on the weekends were less 263
0 2 4 6 8 10 12 14 Purchases and services
Work Restaurants Others Visit family and friends Education Children transport Household related
Percent walked for purpose, weighted
Not transit user Transit user
0.0 5.0 10.0 15.0 20.0
Restaurants Others Visit family and friends Household related Purchases and services Education Work Children transport
Mean duration of walk trips (min.), weighted Transit user (849 trips) Not transit user (3,720 trips)
likely to meet physical activity recommendations. Participants living in the Atlantic 264
Provinces, Ontario and British Columbia were more likely to meet physical activity 265
recommendations than those in Quebec and the Prairies. 266
TABLE 2 Multivariate Logistic Regression of Meeting Physical Activity
267
Recommendation Through Active Transportation
268
Odds Ratio P>z [95% Conf. Interval]
Used bus 1.66 0.002 1.21 2.29
Used subway or train 2.87 0.000 1.91 4.32
Women 1.07 0.503 0.88 1.30
Age groups (years)
15 to 24 [ref.] 25 to 34 0.58 0.002 0.41 0.82 35 to 44 0.64 0.012 0.45 0.90 45 to 54 0.50 0.000 0.34 0.72 55 to 64 0.50 0.001 0.33 0.77 65 to 74 0.55 0.004 0.36 0.83 75 and over 0.83 0.471 0.49 1.39 Household income ($)
Less than 20 000 [ref.]
20 000 to 39 999 0.63 0.002 0.47 0.84
40 000 to 59 999 0.44 0.000 0.32 0.60
60 000 to 99 999 0.55 0.000 0.40 0.75
100 000 or more 0.59 0.004 0.41 0.84
Has children under 14 years 1.08 0.535 0.85 1.37
Immigrated less than ten years ago 1.25 0.178 0.90 1.71
Lives in single family home (vs.
others) 0.44 0.000 0.36 0.55 Diary day Weekday [ref.] Saturday 0.74 0.055 0.55 1.01 Sunday 0.65 0.005 0.48 0.88
Worked on survey day 0.94 0.618 0.74 1.19
Currently in educational institution 2.03 0.000 1.43 2.88
Region of Canada Atlantic 1.10 0.516 0.82 1.47 Quebec 0.72 0.009 0.56 0.92 Ontario [ref.] Prairies 0.74 0.030 0.56 0.97 British Columbia 0.95 0.750 0.71 1.28 Observations 10,867 ll (base) -3764000 ll (model) -3416000 Chi-square 370.00
Significance 0.000 269 270 DISCUSSION 271 272
The analysis of time use data shows that on a survey day, transit users did more active 273
transportation, were more likely to walk for all trip purposes and achieved the physical 274
activity recommendation of 30 minutes through AT more frequently than non-‐users of 275
public transit. Transit users have socio demographic characteristics that differentiate them 276
from non-‐users. For research purposes, these characteristics must be controlled for when 277
assessing walking and the health benefits associated with walking. Failure to do so may 278
create spurious relationships due to the socio-‐demographic characteristics themselves. 279
Models that did not include socio-‐demographic covariates overestimated the impact of 280
transit use on meeting physical activity recommendations. 281
282
These results correspond to the findings of analyses on the relationship between public 283
transit use and active transportation (AT) not related to transit access (15, 33). The results 284
also link transit users to more AT as other analyses that focus on the walk time needed to 285
access public transit (11,12,14). The paper provides four original contributions: First, 286
analyses were based on a time use survey instead of ad hoc surveys, health surveys or 287
travel diaries. As such, the analysis carried out here can be replicated in many countries 288
where such data is available. Second, time use diaries also have the advantage of not 289
inciting certain response through the stated objective of the survey, and make it difficult for 290
respondents to provide inaccurate time results since the sum of all time period must 291
conform to a 24-‐hour day. Third, the paper provides estimates of the time spend in walking 292
activity for multiple purposes and the percentage of transit users and non-‐users that 293
engaged in these purposes. Fourth the paper provides socio-‐demographic comparison of 294
users and non-‐users representative at a National level of the urban population. 295
296
Given that more walking converts to more energy expenditure, reduced obesity, other 297
health benefits and reduced health care costs (18,20,22,23), there are clear public health 298
benefits to the promotion of public transit use not only for its direct contribution to 299
walking but also for the walking trips that the transit user lifestyle entails. Without proper 300
access to public transit, most of the population needs to purchase a vehicle and is more 301
likely to use it even when destinations are within walking distance (34). Walkable 302
neighborhood design must likely include strong transit access to reach their objectives. 303 304 LIMITATIONS 305 306
Time use surveys provide incomplete information on walking trips to access public transit. 307
Upon observation of activities preceding and following transit trips, it was founds that 5% 308
and 4,3% of transit trips were respectively preceded or followed by walk trips and few 309
transit trips were also preceded or followed by car, cycling or other transit trips. The data 310
suggest that some transit users rather reported stop or station access and wait time as part 311
of the overall transit trip time. For these 179 walk trips to or from transit, duration 312
averaged 11.5 minutes. As participants having shorter transit access trips may be more 313
likely to not report walk access, these values are slightly higher than walk distance 314
reported elsewhere. Because evidence points to this consistent source of walking for 315
transit users (11,12,14), presented estimates of associations between transit use and 316
meeting physical activity guidelines are conservative. 317
318
Because the GSS time use survey only reports on one specific day, it cannot be excluded 319
that transit use on the survey day is not representative of all transit use and users. As some 320
transit users potentially did not use transit on the survey day, results possibly 321
underestimates the total proportion of transit users in the population and the extent of the 322
benefits on walking. The clear link between transit use and all walk trips on a given day is 323
however not affected. 324
325
The GSS 2005 did include other measures that could have been useful in this analysis such 326
as car ownership, drivers license, perceived access to public transit, and use of public 327
transit in the past year. This additional module was however only available for half of the 328
survey population. The variables were not used in this analysis. 329
330
Bicycle trips were also excluded from the analysis because of their distinct characteristics 331
and the low number of participants having reported cycling. 332 333 CONCLUSION 334 335
The use of public transit was associated with active transportation and with meeting 336
physical activity recommendations through walking. Objectives to increase transit use 337
among the Canadian population have the potential to increase population health, reduce 338
health care costs, improve access and reduce car dependence not only because users walk 339
to access transit, but because they also take more walk trips directly to destinations. Walk 340
trips taken by transit users are typically not longer than the ones taken by non-‐users. 341
Transit users just tend to take more of these trips for various purposes than their non-‐user 342
counter parts. This result suggests that transit users preference for walking does not 343
translate to longer walking distances per purpose, but rather to more frequent and varied 344
walk trips. Providing land uses that enable short walking trips to destinations in areas with 345
transit service is warranted. 346 347 ACKNOWLEDGEMENT 348 349
The author thanks the Fonds Québecois de recherche sur la société et la culture (FQRSC) for 350
financial support for this project. Diogo Gianini Pinto assisted with data preparation and 351
literature review. Results and views expressed are those of the author and are not those of 352
Statistics Canada. 353
REFERENCES
355 356
1. Canadian Society for Exercise Physiology (CSEP) (2012 ). Canadian Physical Activity Guidelines and
357
Canadian Sedentary Behaviour Guidelines: Your Plan to Get Active Every Day. Ottawa, ON,
358
Canadian Society for Exercise Physiology (CSEP),: 29.
359
360
2. USDHHS. U.S. Department of Health and Human Services (2008). Physical activity guidelines for
361
Americans. Washington DC, USDHHS, CDC.
362
363
3. Sallis, J. F., L. D. Frank, et al. (2004). "Active transportation and physical activity: opportunities for
364
collaboration on transportation and public health research." Transportation Research Part A:
365
Policy & Practice 38(4): 249.
366
367
4. Sallis, J. F., R. B. Cervero, et al. (2006). "An Ecological Approach To Creating Active Living
368
Communities." Annual Review of Public Health 27(Journal Article): 297-322.
369
370
5. Statistics Canada. (2012). "Health indicator profile, annual estimates, by age group and sex, Canada,
371
provinces, territories, health regions (2011 boundaries) and peer group (CANSIM table
105-372
0501). Ottawa: Statistics Canada. (http://www4.hrsdc.gc.ca/[email protected]?iid=8#M_1)
373
Accessed on March 18, 2012.
374
375
6. Gilmour, H. (2007). "Physically active Canadians." Health reports/Statistics Canada, Canadian Centre
376
for Health Information= Rapports sur la sante/Statistique Canada, Centre canadien d'information
377
sur la sante 18(3): 45-65.
378
379
7. Janssen, I. (2012). "Health care costs of physical inactivity in Canadian adults." Applied Physiology,
380
Nutrition, and Metabolism 37(4): 803-806.
381
382
8. TRB-IOM - Transportation Research Board and Institute of Medicine of the National Academies
383
(2005). "Does the Built Environment Influence Physical Activity? Examining the evidence. TRB
384
special report 282." 248 pages.
385
386
9. Brownson, R. C., C. M. Hoehner, et al. (2009). "Measuring the Built Environment for Physical
387
Activity: State of the Science." Measurement of the Food and Physical Activity Environments -
388
Enhancing Research Relevant to Policy on Diet, Physical Activity, and Weight 36(4, Supplement
389
1): S99-S123.e112.
390
391
10. Lachapelle, U. and L. D. Frank (2009). "Transit and Health: Mode of Transport, Employer-Sponsored
392
Public Transit Pass Programs, and Physical Activity." Journal of public health policy 30(Journal
393
Article): S73-S94.
394
395
11. Besser, L. M. and A. L. Dannenberg (2005). "Walking to Public Transit: Steps to Help Meet Physical
396
Activity Recommendations." American Journal of Preventive Medicine 29(4): 273-280.
397
398
12. Freeland, A. L., S. N. Banerjee, et al. (2013). "Walking Associated With Public Transit: Moving
399
Toward Increased Physical Activity in the United States." American Journal of Public Health
400
103(3): 536-542. 401
402
13. Wener, R. E. and G. W. Evans (2007). "A Morning Stroll: Levels of Physical Activity in Car and
403
Mass Transit Commuting." Environment & Behavior 39(1): 62-72.
405
14. Wasfi, R. A., N. A. Ross, et al. (2013). "Achieving recommended daily physical activity levels
406
through commuting by public transportation: Unpacking individual and contextual influences."
407
Health & Place 23(0): 18-25.
408
409
15. Lachapelle, U., L. Frank, et al. (2011). "Commuting by public transit and physical activity: where you
410
live, where you work, and how you get there." Journal of Physical Activity & Health 8 Suppl 1:
411
S72-82.
412
413
16. Brown, B. B. and C. M. Werner (2009). "Before and After a New Light Rail Stop: Resident Attitudes,
414
Travel Behavior, and Obesity." Journal of the American Planning Association 75(1): 5-12.
415
416
17. Ming Wen, L. and C. Rissel (2008). "Inverse associations between cycling to work, public transport,
417
and overweight and obesity: Findings from a population based study in Australia." Preventive
418
Medicine 46(1): 29-32.
419
420
18. MacDonald, J. M., R. J. Stokes, et al. (2010). "The Effect of Light Rail Transit on Body Mass Index
421
and Physical Activity." American Journal of Preventive Medicine 39(2): 105-112.
422
423
19. Morabia, A., F. E. Mirer, et al. (2010). "Potential health impact of switching from car to public
424
transportation when commuting to work." American Journal of Public Health 100(12).
425 426
20. Morabia, A., F. F. Zhang, et al. (2012). "Biologic and epigenetic impact of commuting to work by car
427
or using public transportation: a case-control study." Preventive Medicine 54(3): 229-233.
428 429
21. Rissel, C., N. Curac, et al. (2012). "Physical activity associated with public transport use--a review
430
and modelling of potential benefits." International journal of environmental research and public
431
health 9(7): 2454-2478.
432
433
22. Edwards, R. D. (2008). "Public transit, obesity, and medical costs: Assessing the magnitudes."
434
Preventive Medicine 46(1): 14-21.
435
436
23. Stokes, R. J., J. MacDonald, et al. (2008). "Estimating the effects of light rail transit on health care
437
costs." Health & Place 14(1): 45-58.
438
439
24. Spinney, J. E. L., D. M. Scott, et al. (2009). "Transport mobility benefits and quality of life: A
time-440
use perspective of elderly Canadians." Transport Policy 16(1): 1-11.
441
442
25. Turcotte, M. (2008). "Dépendance à l’automobile dans les quartiers urbains." Tendances sociales
443
canadiennes 85: 21-32.
444
445
26. Turcotte, M. (2011). "Commuting to work: Results of the 2010 General Social Survey." Ottawa:
446
Statistics Canada.
447
448
27. Newbold, K. B., D. M. Scott, et al. (2005). "Travel behavior within Canada's older population: a
449
cohort analysis." Journal of Transport Geography 13(4): 340-351.
450
451
28. Spinney, J. E. L., H. Millward, et al. (2011). "Measuring active living in Canada: A time-use
452
perspective." Social Science Research 40(2): 685-694.
453
29. Béchard, M. and I. Marchand (2006). General Social Survey Cycle 19: Time Use (2005)--Public Use
455
Microdata File Documentation and User's Guide. Ottawa, ON, Statistics Canada– Product
456
No.12M0019-GPE: 970.
457
458
30. Lee, C. and A. V. Moudon (2004). "Physical Activity and Environment Research in the Health Field:
459
Implications for Urban and Transportation Planning Practice and Research." Journal Of Planning
460
Literature 19(2): 147-181.
461
462
31. Polzin, S. E. and X. Chu (2005). Public transit in America: results from the 2001 national household
463
travel survey. Tampa, National Center for Transit Research (NCTR) and Center for Urban
464
Transportation Research (CUTR): 83.
465
466
32. Heisz, A. and G. Schellenberg (2004). "Public Transit Use Among Immigrants." Canadian Journal of
467
Urban Research 13(1): 170-191.
468
469
33. Lachapelle, U. and R. B. Noland (2012). "Does the commute mode affect the frequency of walking
470
behavior? The public transit link." Transport Policy 21(0): 26-36.
471
472
34. Morency, C., M. Demers, et al. (2007). "How Many Steps Do You Have in Reserve?: Thoughts and
473
Measures About a Healthier Way to Travel." Transportation Research Record: Journal of the
474
Transportation Research Board 2002(-1): 1-6.
475