OATAO is an open access repository that collects the work of Toulouse
researchers and makes it freely available over the web where possible
Any correspondence concerning this service should be sent
to the repository administrator:
tech-oatao@listes-diff.inp-toulouse.fr
This is an author’s version published in:
https://oatao.univ-toulouse.fr/cgi/users/home?screen=EPrint::View&eprintid=16281
To cite this version:
Jacquin, Anne and Goulard, Michel and Hutchinson, J.M. Shawn
and Hutchinson, Stacy L. Military training and fire regime impacts
on tallgrass prairie vegetation degradation. (2015) In: 2.
International Workshop on Temporal Analysis of Satellite Images,
17 June 2015 - 19 June 2015 (Stockholm, Sweden).
Official URL:
https://prodinra.inra.fr/?locale=fr#!ConsultNotice:347736
MILITARY TRAINING AND FIRE REGIME IMPACTS ON
TALLGRASS PRAIRIE VEGETATION DEGRADATION
Anne Jacquin1, Michel Goulard2, J.M. Shawn Hutchinson3, and Stacy L. Hutchinson4
1. Université de Toulouse, INPT, Ecole d'Ingénieurs de Purpan, UMR 1201 DYNAFOR, Toulouse, France; anne.jacquin@purpan.fr
2. Institut National pour la Recherche Agronomique, UMR 1201 DYNAFOR, Castanet Tolosan, France; michel.goulard@toulouse.inra.fr
3. Kansas State University, Department of Geography, Manhattan, Kansas, USA; shutch@ksu.edu
4. Kansas State University, Department of Biological and Agricultural Engineering, Manhattan, Kansas, USA; sllhutch@ksu.edu
ABSTRACT
The relationship between fire and long-term trends in tallgrass prairie vegetation was assessed at Fort Riley and Konza Prairie Biological Station (KPBS) in Kansas. Linear trends of surface greenness were previously estimated using BFAST and MODIS MOD13Q1 NDVI composite images from 2001 to 2010. To explain trends, fire frequency and seasonality (fire regime) was determined and each site was divided into spatial strata using administrative or management units. Generalized linear models (GLM) were used to explain trends by fire regime and/or stratification. Spatialized versions of GLMs were also computed address unexplained spatial components. Non-spatial models for FRK showed fire regime explained only 4% of trends compared to strata (7-26%). At KPBS, fire regime and spatial stratification explained 14% and 39%, respectively. At both sites, improvements in performance were minimal using both fire and strata as explanatory variables. Model spatialization resulted in a 5% improvement at FRK, but with weak spatial structure in the residuals, and was not necessary at KPBS as the existing stratification most of the spatial structure in model residuals. All models at KPBS performed better for each explanatory variable and combination tested. Fire has only a marginal effect on vegetation trends at FRK despite its widespread use as a grassland management tool to improve vegetation health, and explains much more of the trends at KPBS. Analysis of predictors from spatial models with existing stratification yielded an approach with fewer strata but similar performance and may provide insight about additional explanatory variables omitted from this analysis.
INTRODUCTION
The role of fire in maintaining mesic grasslands is a well-studied topic (1,2). In the Flint Hills ecoregion of North American, fire has been historically important in the maintenance of tallgrass prairie ecosystems and is today used by many private landowners to favor C4 grasses and increase vegetation productivity for cattle grazing (3,4). Fire frequency and timing can have significant impacts on the spatial pattern of plant productivity, vegetation structure, and nutrient cycling (5,6,7,8). When considered with other factors such as weather and climate, topographic position, grazing, and other anthropogenic disturbances the impact of fire on grassland dynamics is even more complex (9,10,11,12,13).
Here we consider promoting sustainable military grasslands as a primary objective and measure sustainability using results from a long-term analysis of grassland vegetation trends derived from remotely-sensed estimates of normalized difference vegetation index (NDVI) data. Given the geographic extent of military training lands and their diverse ecological settings, defining and agreeing on metrics to measure “sustainable use” is difficult. The influence of fire and land use practices on grassland vegetation trends is assessed to provide military land managers with site-specific feedback about progress towards sustainability goals.
2nd EARSeL International Workshop on Temporal Analysis of Satellite Images Stockholm, Sweden, June 17-19, 2015
Spatial statistical tools are used to analyze spatiotemporal trends in vegetation and fire regime using a time series of multisource remote sensing images over the period 2001-2010. Results from non-spatial and spatial statistical analyses with spatial stratification are compared to identify the best method for explaining vegetation dynamics. Also introduced is an approach for proposing an improved, and simplified, spatial stratification better adapted to the response variable.
METHODS Study Area
Fort Riley is a 41,128 ha U.S. Army installation located in northeast Kansas (39°11’N, 96°48’W), on the Kansas River within Geary, Riley and Clay counties. The installation is located in the Flint Hill ecoregion (14) and vegetation is dominated by grasslands (81%) followed by woodlands (16%) and shrublands (3%). Dominant plant species in grassland areas include big bluestem (Andropogon gerardii), Indiangrass (Sorghastrum nutans), switchgrass (Panicum virgatum), and little bluestem (Schizachyrium scoparium). These characteristic tallgrass prairie species are actively managed using prescribed fire during the fall, winter, and spring seasons but wildfires resulting from military training may occur during any season. The installation is subdivided into 103 training area units within which military training occurs. Disturbances from military training include a variety of on- and off-road field maneuvers (including tracked and wheeled combat vehicle operations), mortar and artillery fire, small arms fire, and aircraft flights.
The Konza Prairie Biological Station (KPBS) was included in this analysis to contrast vegetation change measured at Fort Riley with that at a relatively natural grassland site. KPBS is owned by the Nature Conservancy, operated by the Division of Biology at Kansas State University, and is a Long Term Ecological Research Site supported by the U.S. National Science Foundation. KPBS has similar vegetation, soils and climate due to its close proximity (< 10 km) to Fort Riley. The KPBS site is subdivided into 48 sub-watershed areas which serve as experimental units where specific combinations of prescribed burning and grazing by cattle and native bison are applied.
Vegetation Activity Change Data
A vegetation change indicator was developed to characterize long-term trends in activity. The indicator was obtained using a temporal decomposition method applied to a time series of MODIS 16-day maximum value composite NDVI images (MOD13Q1) between January 2001 and December 2010. The method (described in 15) consists of three steps: (1) NDVI time series decomposition using BFAST based on LOESS (16), (2) analysis of the BFAST trend component using linear regression, and (3) identification of significant positive or negative trend slopes using a Student’s t-test. This method has already been applied to the Fort Riley and KPBS study areas (17).
Fire Regime Data
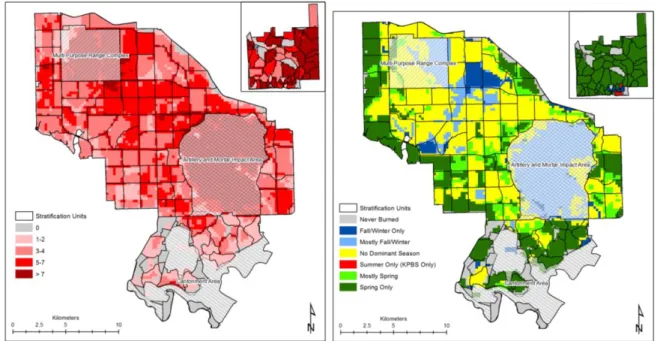
A fire regime indicator was also developed to characterize burning activities according to season and frequency by analyzing a time series of multisource remote sensing data for the period 2001-2010 (Figure 1). Primary data were high spatial resolution (HSR) images most appropriate for delineating burn scars at local and regional scales (18). A total of 83 Landsat 5 TM images were acquired and burn scars extracted using a combination of unsupervised classification of the near-infrared band with CAPI techniques (19). Due to persistent cloud contamination in the HSR images, 135 additional MODIS Burned Area Product (MCD45) images were used to complement the HSR time series.
Model Development
Generalized linear models (GLM) were computed on a per-pixel basis to determine how well fire regime and/or stratification explained degraded vegetation activity. In the first non-spatial model, where independence between observations was assumed, a classical binomial GLM was used where the probability of success depended on site-specific characteristics. The link between this
probability and the linear preditor based on individual characteristics was the logit and the estimation is done by maximum likelihood (20).
Figure 1: Fire frequency (left) and seasonality (right) for Fort Riley and Konza Prairie Biological Station (inset map) during the period 2001-2010. Combining frequency and seasonality yielded 13 total fire regime classes used in the analysis. Black boundary lines indicate stratification units.
A second model accounting for spatial correlation was also applied where a spatially random field was used to account for what was not explained in the independent model. The model adds to the linear predictor the value of the random field at the observation site. The Bayesian Markov Chain Monte Carlo method based on Metropolis dynamics was used to estimate model parameters. The estimates are then taken as the posterior mean (21).
Both types of models (non-spatial and spatial) were evaluated with two metrics. The first was the Akaike Information Criterion (AIC) which summarizes the tradeoff between model accuracy and complexity (22,23). The second metric is a ratio equal to 1 minus the residual deviance divided by null deviance (1 – (residual deviance / null deviance)). If the ratio is low then, at the level of the study area, other explanatory variables not included in the model should be considered.
Five models using different explanatory variables were tested and their ability to explain vegetation degradation assessed. The initial assumption was that vegetation degradation would be explained adequately by only the fire regime (model 1), or only stratification (model 2), or a combination of fire regime and stratification (model 3). However, the original stratification, especially at Fort Riley, was not specifically designed for use in monitoring grassland vegetation dynamics so a simplified stratification more adapted to the response variable was tested. This stratification was developed by analyzing the distribution of the model predictor based only on the original stratification (model 2) as a function of the stratification units. Two additional models were developed. One only with simplified stratification (model 4) and one with fire regime and simplified stratification (model 5).
Model Validation
Each GLM model generates a probability map for vegetation degradation. Model performance was validated using two different reference datasets. The first was the vegetation degradation class resulting from the previously mentioned MODIS NDVI trend analysis. The second was a new HSR vegetation degradation class from a change analysis performed using two Landsat 5 TM images acquired near the beginning (08/05/2001) and end (08/30/2010) of the study period. This method was recommended by Borak et al., (24), has been proven well adapted for grassland ecosystems
2nd EARSeL International Workshop on Temporal Analysis of Satellite Images Stockholm, Sweden, June 17-19, 2015
(15,25), and has been previously used to validate vegetation change activity for the Fort Riley and KPBS study areas (17).
The HSR dataset consists of a raster with the same spatial resolution as the vegetation activity change map (250 m) in which each grid cell corresponds to one of two classes (degraded or non-degraded) based on the interpretation of NDVI change derived from the Landsat 5 TM images. Since the GLM model estimates the probability of vegetation degradation, only the NDVI change class for degraded vegetation was retained during validation. A contingency matrix was constructed with rows representing the reference data and columns with two classes of vegetation degradation probabilities (> 0.50 and <= 0.50).
RESULTS
The ratio (1 – residual deviance/null deviance) * 100 was used to determine how well explanatory variables in the five GLM models explained variability in the vegetation activity change indicator. Associated AIC values were also calculated to characterize the relative explanatory power of each model (Table 1).
Impact of Fire on Vegetation Degradation
To assess the effect of fire regime on vegetation activity change, results from GLM models with only the fire regime variable (model 1) were compared with those of GLM models with only stratification (model 2). Fire alone explains very little at Fort Riley (4-11%) versus stratification alone (26-31%). The marginal effect of fire on vegetation change is confirmed when also considering the results of the GLM model with fire and stratification (model 3). The combination of fire regime and stratification does not improve the explanatory power of the model (27-31%). This same applies to KPBS, except that the effect of fire on vegetation activity change is higher than Fort Riley (14-29%).
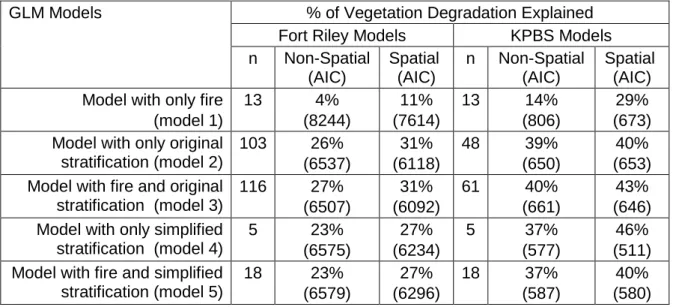
Table 1: Percentage of vegetation degradation explained by spatial and non-spatial GLM models. The value for n is the total number of modalities for explanatory variables used in each GLM model.
At Fort Riley, regardless of the GLM model, using a spatial approach in the statistical analysis is needed. Spatial versions of the GLM models provide a 4-7% improvement in performance compared to non-spatial models with the added benefit of systematically lower AIC values. The situation at KPBS is slightly different. Model spatialization is not needed if the analysis is done with the original stratification, as the percentage of vegetation activity change explained and AIC values
GLM Models % of Vegetation Degradation Explained
Fort Riley Models KPBS Models
n Non-Spatial (AIC) Spatial (AIC) n Non-Spatial (AIC) Spatial (AIC) Model with only fire
(model 1) 13 4% (8244) 11% (7614) 13 14% (806) 29% (673) Model with only original
stratification (model 2) 103 26% (6537) 31% (6118) 48 39% (650) 40% (653) Model with fire and original
stratification (model 3) 116 27% (6507) 31% (6092) 61 40% (661) 43% (646) Model with only simplified
stratification (model 4) 5 23% (6575) 27% (6234) 5 37% (577) 46% (511) Model with fire and simplified
stratification (model 5) 18 23% (6579) 27% (6296) 18 37% (587) 40% (580)
are the nearly same with both non-spatial and spatial models. At KPBS, the original stratification already accounts for the type and distribution of explanatory variables in the models. However, when modifying the original stratification (model 4), spatialization provides a 9% improvement in model performance with a decrease in AIC values from 577 to 511.
Assessing the Performance of the Simplified Stratification Model
By analyzing the range of predictor values for GLM models with only stratification (model 2) for each of the original management units (103 training areas at Fort Riley and 48 sub-watersheds at KPBS), a simplified stratification was proposed. For both study areas, this simplification consists only of five strata obtained after reclassification of training areas or sub-watersheds.
Results from the GLM model with original stratification (model 2) were compared to those of the GLM model with only simplified stratification (model 4). At Fort Riley and KPBS, simplification explains nearly the same amount of vegetation activity change but with only five strata. As already seen with the original stratification, adding the fire regime variable to simplified stratification in a GLM model (model 5) does not improve the ability to explain vegetation activity change. Therefore, the GLM model with only simplified stratification was considered most appropriate.
Validating Vegetation Degradation Probabilities under Simplified Stratification
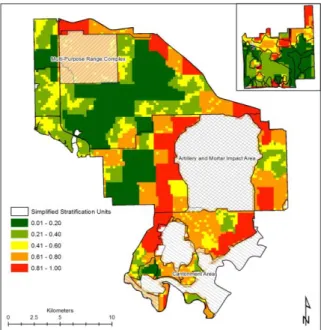
The vegetation degradation probability maps for Fort Riley and KPBS generated by the GLM model with only simplified stratification (model 4) are shown in Figure 2. Areas in red correspond to the highest probabilities of vegetation degradation as explained by the five new strata. Areas in green suggest a low probability of vegetation degradation.
Evaluation of the contingency matrix helps validate the vegetation degradation probability maps from the selected GLM model (Table 2). Agreement is high at Fort Riley (59-76%) and moderate to relatively high at KPBS (40-62%) based on the reference data used. These validation results suggest the new simplified stratification is capable of highlighting areas of degradation, especially at Fort Riley. Identifying concentrations, or hot spots, of vegetation degradation can focus the attention of military land managers on specific areas where anthropogenic activities are having a negative impact on vegetation activity.
Figure 2: Probability of vegetation degradation for Fort Riley and Konza Prairie Biological Station (inset map). Probabilities are based on the GLM model results using only the five simplified strata (model 4) as the explanatory variable.
Table 2: Contingency matrix with validation results for the Fort Riley and KPBS vegetation degradation probability maps. Landsat and MODIS NDVI change classes are considered the
2nd EARSeL International Workshop on Temporal Analysis of Satellite Images Stockholm, Sweden, June 17-19, 2015
reference. Numbers are percentage of vegetation degradation probability pixels belonging to the Landsat or MODIS NDVI change class.
Reference Data
for Vegetation Degradation Class
Vegetation Degradation Probability Classes from GLM Model 4
> 0.50 <= 0.50
Fort Riley Landsat NDVI change class 59 41
MODIS NDVI change class 76 24
KPBS Landsat NDVI change class 40 60
MODIS NDVI change class 62 38
CONCLUSIONS
Results from this analysis provide two major advances. First, from a thematic perspective and contrary to what was expected, fire regime does not adequately explain patterns of vegetation activity change. At both sites, based on comparison of models with only original stratification (model 2) with original stratification and fire (model 3), vegetation degradation is better explained by the original stratification. This is especially true at Fort Riley.
Second, from a methodological point of view, the soundest approach in finding a model that best explained vegetation activity change involved first using a one with the original stratification to form a new stratification better adapted to the response variable using a spatial approach. At Fort Riley, where simplified stratification is very informative, the five new strata were used to characterize the probability of vegetation degradation provided by the GLM model (Figure 5, top left). Strata 4 and 5, respectively, have an average vegetation degradation probability of 0.79 and 0.75 which is significantly higher than that obtained for strata 1, 2, and 3.
There appears to be contrasting approaches to fire management between Fort Riley and KPBS. Spring fires at KPBS tend to serve as a stabilizing factor with vegetation degradation due mainly to grazing activities combined with fire frequency and human disturbances. In areas where training intensities are high at Fort Riley, spring fires are perhaps used to promote grassland health where military training disturbances are significant and frequent. In other training areas, no fire regime dominates. While the literature and results from KPBS support spring burning as a beneficial grassland management practice, when combined with frequent and intense training during a wet season it may actually be counterproductive and amplify vegetation degradation. At the least, the influence of military training on vegetation dynamics is dominant and serves to minimize any potential benefit realized from a typical Flint Hills fire regime.
To confirm such conclusions, more detailed and temporally consistent training data are required. While these data do exist, they are embedded within complex U.S. Army database management systems and are difficult to extract for use in natural resource studies. Until such a time when training data is routinely available for Fort Riley land managers, the new simplified strata presented here may be used as a spatial guide to modify training schedules and prevent further declines in vegetation condition where degradation has been predicted and measured.
ACKNOWLEDGEMENTS
Funding to support international research collaboration was provided by Ecole d’Ingénieurs de Purpan and through a Faculty Development Award from Kansas State University. Additional travel funding to support researcher exchange was provided by the National Polytechnic Institute (INP) of Toulouse and the Geographic Information Systems Spatial Analysis Laboratory (GISSAL) at Kansas State University.
REFERENCES
1 Axelrod D I, 1985. Rise of the grassland biome, central North America. The Botanical Review, 51: 163–201.
2 Daubenmire R, 1968. The ecology of fire in grasslands. Advances in Ecological Research, 5: 209–266.
3 Hulbert L C, 1969. Fire and litter effects in undisturbed bluestem prairie in Kansas. Ecology, 50: 874–877.
4 Adams D E & R C Anderson, 1978. The response of a central Oklahoma grassland to burning. The Southwestern Naturalist, 23: 623–632.
5 Towne E G & C Owensby, 1984. Long-term effects of annual burning at different dates in ungrazed Kansas tallgrass prairie. Journal of Range Management, 37: 392-397.
6 Collins S L, S M Glenn, & D J Gibson, 1995. Experimental analysis of intermediate
disturbance and initial floristic composition: Decoupling cause and effect. Ecology, 76: 486-492.
7 Abrams M D & L C Hulbert, 1987. Effect of topographic position and fire on species
composition in tallgrass prairie in northeast Kansas. American Midland Naturalist, 117: 442– 445.
8 Ojima D S, D S Schimel, W J Parton, & C E Owensby, 1994. Long- and short-term effects of fire on nitrogen cycling in tallgrass prairie. Biogeochemistry, 24: 67-84.
9 Abrams M D, A K Knapp, & L C Hulbert, 1986. A ten-year record of aboveground biomass in a Kansas tallgrass prairie: effects of fire and topographic position. American Journal of Botany, 73: 1509–1515.
10 Collins, S L, 1987. Interaction of disturbances in tallgrass prairie: a field experiment. Ecology, 68: 1243–1250.
11 Towne, E G & A K Knapp, 1996. Biomass and density responses in tallgrass prairie legumes to annual fire and topographic position. American Journal of Botany, 83: 175–179.
12 Briggs J M & A K Knapp, 1995. Interannual variability in primary production in tallgrass prairie: climate, soil moisture, topographic position, and fire as determinants of aboveground biomass. American Journal of Botany, 82: 1024–1030.
13 Spasojevic M J, R J Aicher, G R Koch, E S Marquardt, N Mirotchnick, T G Troxler, & S L Collins, 2010. Fire and grazing in a mesic tallgrass prairie: Impacts on plant species and functional traits. Ecology, 91(6): 1651-1659.
14 Bailey R G, P E Avers, T King, & W H McNab, eds, 1994. Ecoregions and subregions of the United States (map) (supplementary table of map unit descriptions compiled and edited by W H McNab & R G Bailey). Washington, D.C., U.S. Department of Agriculture–Forest Service, scale 1:7,500,000.
15 Jacquin A, 2010. Dynamique de la végétation des savanes en lien avec l’usage des feux à Madagascar: Analyse par série temporelle d’images de télédétection. Chapter 4 (pp. 81-201) in PhD dissertation, University of Toulouse (France).
16 Verbesselt J, R Hyndman, G Newnham, & D Culvenor, 2010. Detecting trend and seasonal changes in satellite image time series. Remote Sensing of Environment, 114(1): 106-115.
2nd EARSeL International Workshop on Temporal Analysis of Satellite Images Stockholm, Sweden, June 17-19, 2015
17 Hutchinson J M S, A Jacquin, S L Hutchinson, & J Verbesselt, 2015. Monitoring vegetation change and dynamics on U.S. Army training lands using satellite image time series analysis. Journal of Environmental Management, 150:355-366.
18 Bowman D M J S, Y Zhang, A Walsh, & R J Williams, 2003. Experimental comparison of four remote sensing techniques to map tropical savanna fire-scars using Landsat-TM imagery. International Journal of Wildland Fire, 12: 341–348.
19 Laris P S, 2005. Spatiotemporal problems with detecting and mapping mosaic fire regimes with coarse-resolution satellite data in savanna environments. Remote Sensing of
Environment, 99: 412-424.
20 McCullagh P & J A Nelder, 1989. Generalized Linear Models (Chapman and Hall) 511 pp. 21 Banerjee S, B P Carlin, & A E Gelfand, 2004. Hierarchical Modeling and Analysis for Spatial
Data (Chapman and Hall/CRC Press) 454 pp.
22 Akaike H, 1974. A new look at the statistical model identification. IEEE Transactions on Automatic Control, 19(6): 716-723.
23 Collett D, 1991. Modelling Binary Data (Chapman and Hall) 387 pp.
24 Borak J S, E F Lambin, & A H Strahler, 2000. The use of temporal metrics for land-cover change detection at coarse spatial scales. International Journal of Remote Sensing, 21: 1415-1432.
25 Serneels S, M Said, & E F Lambin, 2001. Land-cover changes around a major East African wildlife reserve: The Mara ecosystem. International Journal of Remote Sensing, 22: 3397-3420.