an author's https://oatao.univ-toulouse.fr/21707
https://doi.org/10.1109/ICRERA.2018.8566931
Martinez, Viviana and Defaÿ, François and Salvetat, Laurent and Neuhaus, Kolja and Bressan, Michaël and Alonso, Corinne and Boitier, Vincent Study of Photovoltaic Cells Implantation in a Long-Endurance Airplane Drone. (2018) In: 2018 7th International Conference on Renewable Energy Research and Applications (ICRERA), 14 October 2018 -17 October 2018 (Paris, France).
Viviana Martinez1, F. Defaÿ1, L. Salvetat2, K. Neuhaus3, M. Bressan3 C. Alonso3, V. Boitier3, 1ISAE-SUPAERO, Université de Toulouse, DCAS, Toulouse, France
2Lycée d’Artagnan, Nogaro, France
3 LAAS-CNRS, Université de Toulouse, UPS, Toulouse, France francois.defay@isae-supaero.fr, vboitier@laas.fr Abstract: Applications of unmanned aerial vehicle (UAVs)
are expanding for long-endurance mission such as agricultural inspection, fire prevention and many others. Photovoltaic cells can be added to the wing surface and extend the global endurance of the UAV. This paper builds a model of the whole system and estimates the energy savings that can be achieved for different cell technologies and different types of missions. Furthermore, the impact of airplane movement (roll) on the performance of the maximum power point tracking control algorithm (MPPT) is studied.
Keywords : UAV, MPPT, photovoltaic, drone,
I. INTRODUCTION
The use of drones has significantly increased in the last years in the development of different applications [1]. Unfortunately, the flight time is shortened by the limited capacities of batteries. Depending of external weather conditions it could be interesting to add solar cells in order to increae the flight time. This project covers the implementation of solar panels on the wings of an airplane drone (DT-18) provided by the drone’s manufacturing company Delair [2]. The DT18 features up to a 100 km range and 2 hours of endurance.
Solar panels can provide enough energy to fly indefinitely if the aircraft has huge wings as the Solar Impulse airplane [3] has demonstrated but this kind of airplane has limited payload and maneuverability. In order to increase the range of the aircraft, it is interesting to study the improvement of endurance by adding solar cell directly on an existing UAV. Some papers in the literature such as [4,5,6,7] deal with the uses of solar cells with UAV for the guidance or material parts.
This paper presents a global simulation which provides a solution to validate the tracking of the MPPT controller with the real movement of the UAV. Reference [8] describes an improved MPPT system for moving systems. But for agile UAVs, variations may be faster. Therefore, the first objective of this paper is to study the influence of fast drone movements on the MPPT control.
The other goal of this paper is to quantify the amount of energy offered by the photovoltaic cells while taking into account anticipated flight conditions.
To achieve this, some simulation tools were developed using the softwares Plecs and Matlab which allowed the study of the whole system. The choice of the solar cells technology,
the cells disposition on the wings, and the economic factor were also subject of study. Finally, a first version of the solar panel was made.
First, a modelization of the contribution of the sun on the PV cells is realized and validated through experimental data. In a second part, the complete model of the system is presented with a focus on the impact of the roll disturbance on the recovered photovoltaic power. Then the model is used to make a prevision of the amount of energy produced by the photovoltaic cells.
II. SOLAR CONTRIBUTION A. Solar Energy
A solar panel allows the transformation of solar energy into electric energy. In order to estimate the electric power generated by the photovoltaic panel (PV), it is necessary to establish the effective irradiance received by the panel. Results are depending on meteorological conditions. This study has been conducted assuming a cloudless sky. The effective irradiance depends on the relative positions of the sun and the PV panel. On sunny days, the calculation of this irradiance is well known and directly taken from [9]. At the time (t), the elevation angle of the sun (h) and azimuth angle (α) (cf Fig. 1) are deduced from declination (δ) and hour angle (ω) at a given latitude (φ).
arcsin(cos( ).cos( ).cos( ) sin( ).sin( ))
h
(1) cos( ).sin( ) arcsin cos( )h
(2)Fig. 1 Horizontal coordinates of the sun: azimuth (α) and elevation (h), from [16].
Likewise, knowing the position of the PV cells fixed on the UAV, from the drone’s position in space and from roll, pitch and yaw angles, the inclination angle (i) from the horizontal
Study of Photovoltaic Cells Implantation in a Long-Endurance
Airplane Drone.
axis and the orientation angle (γ) from the south are calculated for the PV cells.
Finally, starting from I and Gh, the direct and global radiation in the case of a horizontal panel (given in literature [15] as a function of h and of local conditions), the global irradiation G is computed as the sum of the direct irradiation S and the diffuse one D. a is the albedo coefficient.
1 cos( ) 1 cos( ) ( ) .( sin( )) . . 2 2 i i D i Gh I h a Gh (3)
( , )
. sin( ).cos( ).cos(
) sin( ).cos( )
S i
I
i
h
h
i
(4)( , ) ( , ) ( )
G i
S i
D i (5) B. Roll influence in the received irradianceUsing Matlab, we could either work with real data recorded during a flight or generate a roll variating profile and study its influence on the profile of received irradiance. An exemple of simulation results is exhibited (Fig. 2) for a test flight on April 7th, with a drone, going towards the south, with initial inclination and orientation of 0° and a sinusoidal roll variation of ±5°
Fig. 2 Irradiation vs Time. Simulation with roll variation 5° (blue line) and measured irradiance (red line), profile on April 7th 2016, Toulouse.
The result shows as expected that when the sun is at its highest, induced variation in the radiation profile is not really significant, but in the morning or afternoon the variations reached 15% of the daily maximum irradiation.
The model (blue) was validated during a sunny day with a real irradiation profile (red) recorded in Toulouse LAAS-CNRS laboratory on April 7th 2016.
C. Choice of PV technology
Different cell technologies were studied. The solution with Alta Devices cells offers the best recovered power and is the more lightweight but Sun Power cells have been selected for price and availability reasons. Each cell is cut in three pieces in order to optimize the occupied surface. Finally, the solar cells configuration chosen is: 20S1P (20 cells in series and 1 branch). In such case, 10 cells compose a wing (cf Fig. 3).
Fig. 3 Implementation of Sun Power cells on the wing. III. SIMULATION TOOL (PLECS)
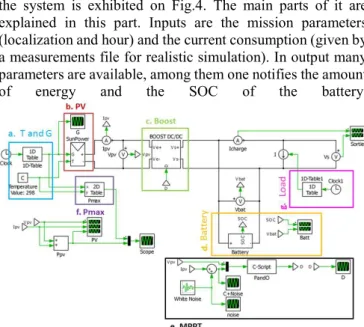
The full model describing the exchanges of electrical power in the system is exhibited on Fig.4. The main parts of it are explained in this part. Inputs are the mission parameters (localization and hour) and the current consumption (given by a measurements file for realistic simulation). In output many parameters are available, among them one notifies the amount
of energy and the SOC of the battery.
Fig. 4 Complete Plecs description of the energy chain (from sun to the load)
A. PV Model
The PLECS PV model is based on a classical one diode model for the PV cell:
Fig. 5 PV cell, one diode model
The current provided by the panel could be considered like the sum of the photocurrent linked to the irradiation, a reverse diode current and resistive losses current.
L d Rp
I I
I
I
(6) After a development presented in [10], we obtained a model which receives the irradiation and temperature values, and generates the characteristic curve I(V). This model uses 8 parameters: 𝐼 , 𝑉 , 𝑘 , 𝑘 , 𝐴, 𝑁, 𝑅 , 𝑅 which are extracted from the datasheet.This cell’s model has been validated with the comparison of the datasheet curves and simulation curves (Fig. 6). The result
is a successful model that works similarly to reality. So, the electrical PV panel model is built from the PV cell model.
Fig. 6 I(V) Curves for a SunPower cell, datasheet (continuous lines), simulation (dotted lines)
B. Battery
The LiPo (Lithium Polymer) battery of 14.4V, 8000mAh for a weight of 730g is composed of 8 elements mounted in 4S2P. Vbatt and i are respectively the voltage and the current of the battery.
0 ( ) t
it
i t dt and i*is the filtered current ( = 30s)The equations used in the model extracted from [11] and [12] are: Discharge Phase: ( *) .exp( . ) batt o Q V E Ri K it i A B it Q it (7) Charge Phase * .exp( . ) 0.1 batt o Q Q V E Ri K i K it A B it it Q Q it (8)
To determine the parameters: B, A, K, Eo, R, we have to deduce five values from the datasheet discharge curves given at constant current: the full voltage (Vfull), the full battery capacity (Q), the battery capacity at the end of exponential zone (Qexp), the voltage at the end of exponential zone (Vexp), the battery capacity at the end of nominal zone (Qnom), and the voltage at the end of nominal zone (Vnom).
With these values, we could find the required parameters: exp 3 B Q (9) exp 1 2 exp 1 2 1 1 ( ) ( ) 1(1 exp( . )) 1(1 exp( . ))
full full nom
nom V V V V I I A B Q B Q I I (10) exp exp 1 1 ( full ) (1 exp( )) K V V A BQ I (11) o full
E
V
Ri A
(12) 1 0.2 nom nom R V Q
(13)This simple model is clearly not perfect (cf Fig. 7) but it gives a correct estimation (around 5%) of the battery’s state of charge (SOC).
Fig. 7 Evolution of the battery’s voltage under a given current profile during a flight, experimentation (green line), simulation result (red line)
C. DC/DC Converter
The topology choice for the converter (Buck or Boost) is highly dependent on the technology and the configuration of the solar cells. To ensure the highest efficiency, it is ideal to have a gain around 1 for the boost converter, or to stay very close to a gain of 0.5 for the buck converter.
Under tempered temperature (0°C, +40°C), the range for the photovoltaic voltage @MPP is located between 11.0V and 12.4V and with a battery voltage range generally comprised between 13.0V and 16.8V (excepted at the end of the battery discharge) the choice of a classical boost topology is convenient and has therefore been chosen for this project (Fig. 8).
We note D the duty cycle of the Pulse Width Modulation (PWM). D is comprised between 0 and 1. The PWM frequency is fixed at 100 kHz which is a good trade-off between the size of the inductance (smaller as the frequency increases), commutation losses (proportional to frequency) and good resolution for the PWM (best with low frequency).
Fig. 8 Boost converter topology
The main electrical elements used in this boost converter that give the dynamic of the system are:
Ce=10µF, Cs=30µF, L=1mH
The instantaneous model requires a really high simulation time, so an average model of the boost converter was implemented and validated.
In that case the boost converter is simply summarized by the following relationship between the average output and input voltage: 1 batt D pv V V D (14)
In practice, the microcontroller is a PIC 18F1220 used with its internal quartz. The internal PWM function works at 10 kHz in order to preserve a small resolution on D. After an average
function made with a first order filter an LTC6992 creates a 100 kHz signal whose duty cycle is driven by the output of the filter.
D. MPPT (Maximum Power Point Tracking)
From measurements of Ipv and Vpv, the algorithm generates D. The command is refreshed each Tcom. For testing the influence of roll perturbation, a very classical MPPT algorithm P&O (Perturb and Observe) has been implemented (Fig. 9)[8].
Fig. 9 Flow chart of MPPT P&O from [13]
We note ΔD the increment or the decrement of D. The analysis of the maximum resolution available shows that ΔD=0.00125 is the smallest value available.
Each Tcom = 100ms, D is actualized. This value is slow enough to let free time for the microcontroller to do another task. ΔD=0.01 is chosen. Choosing a higher ΔDproduces more oscillations in the steady state, and a smaller ΔD makes the system’s response slower. This constitutes the classical trade-off between stability and rapidity.
Two representative irradiation profiles (with different ranges and frequencies of variations induced by roll angle influence) were extracted from the irradiation model combined with experimental roll curves. Those profiles are used to test the MPPT algorithm’s behavior. In the same program, the theoretical (depending only on instantaneous received irradiation and temperature) and effective instantaneous maximum power (also depending on the quality of the MPPT algorithm) are calculated and presented on Fig. 10 and Fig. 11. Additionally, to be more representative, the simulations were conducted while adding a white noise in the measurement part, in order to take in account realistic imperfections in the measures of photovoltaic current and voltage.
By paying attention to the power scale, we could conclude that the MPPT achieves to follow the two different irradiation profiles despite the irradiation variations.
A simple analysis shows that the roll variation dynamic has a maximum bandwidth of 2 Hz and the frequency command fcom = 1/ Tcom = 10Hz, which is still faster. It explains why in that case, the MPPT follows accurately the power variations. The effective efficiency of the MPPT algorithm is close to 99%. It proves that roll variations are not fast enough
to disrupt the MPPT algorithm and to decrease the MPPT efficiency.
Fig. 10 PV Power, simulation results for the irradiation profile 1, effective power (blue), theoretical power (green).
Fig. 11 PV Power, simulation results for the irradiation profile 2, effective power (yellow), theoretical power (green).
IV. ENERGYINTAKE
Using a real power consumption profile of a DT-18 drone during 41 minutes, the consumed energy is computed at 46Wh. For such simulations, an average model of the converter is used, which allows to increase the simulation step and to obtain a result in few minutes.
The harvested energy was calculated (flight to South) for two cell technologies, with the aim of facilitating future versions. The simulations summarized in Table 1 are realized for two significant but sunny days (June 21st and December 21st), and for three different hours of the day (10h00, 14h00 and 18h00). The global efficiency of the boost converter (including the MPPT efficiency) before effective tests was chosen at 0.8 (a realistic value in this range of power).
TABLE IENERGY INTAKE
Table I gives the amount of energy offered by the photovoltaic chain computed as the ratio between the electrical energy furnished by the output of the boost converter to the battery and the energy consumed by the UAV. The intake is the relative proportion of the energy which could be furnished by photovoltaic circuit (the saved energy). The obtained value is highly influenced by the payload and the disposition of the cells on the wings.
Results show that PV cells won’t give a complete autonomy. This simulation tool offers a good estimation of the saved
energy and therefore the extension of available distance. We must notice that wings are not designed to be completely covered by PV cells (the ratio Surface of cells / Surface of wings is only 38% for SunPower cells and 50% for Alta Devices cells), results will be better with a specifically designed drone.
V. IMPLANTATIONOFPVCELLS
A first version of the implementation was realized using specific industrial installations kindly furnished by the high school “Lycée d’Artagnan” in Nogaro (Fig. 12).
The materials used for the process are:
- Sun Power cells cut off in 3 parts, and welded for building two 10S1P structure (one for each wing)
- A flexible support plate that withstands 150°C of temperature.
- Two EVA sheets - One TFE sheet
Fig. 12 Final encapsulation of PV cells
Those wings are functional (efficiencies between 12% and 15%) and will be used on a test bench.
The poor efficiency is due to unexpected cracks on cells… It shows that all cells must be tested before the encapsulation phase. Furthermore the process must be clearly improved (cell sorting, welding, bonding, encapsulation,…) before a real implementation on a wing.
VI. CONCLUSION/FUTUREPROSPECTS
Concerning roll influence, we have observed that the variations of irradiation are negligible when the sun is at its highest but significant in the morning and in the afternoon. A generic simulation tool that works properly has been implemented and tested. This system allows to study the behavior of each elements separately (PV module, converter, battery, MPPT, payload) or to simulate the whole energy chain (from sun to payload).
Using this model, we have validated the proper functioning of MPPT P&O algorithm taking into account the dynamic variations of roll angle and concluded that for this drone losses generated by the command are negligible.
To reduce the computation time an average model has been developed, tested and validated.
Then, simulations have showed that the energy intake can be calculated. It depends of many factors: the cell technology, the disposition of cells, the date and hour of the mission and the desired trajectory.
Finally, a first version of cell implementation was done and a boost converter has been shaped. During further works, the model will be compared with experimental results monitored on a test bench.
In futures studies, we both have to quantify the losses induced by those roll variations and to compute the influence of the other angles (yaw and pitch).
VII. ACKNOWLEDGMENT
The authors’ work on UAV powered by PV cells has been partially supported by the French ANR Labcom called MIDLELAB.
VIII. REFERENCES
[1] THE DRONES REPORT: Market forecasts, regulatory barriers, top vendors, and leading commercial applications, Business Insider, May 27, 2015
[2] http://delair.aero/ [3] www.solarimpulse.com
[4] D. Scheiman & all: A Path Toward Enhanced Endurance of a UAV Using IMM Solar Cells, Photovoltaic Specialists Conference (PVSC), 2016 IEEE 43rd (2016).
[5] S. Hosseini, M. Mesbahi: Energy-Aware Aerial Surveillance for a Long-Endurance Solar-Powered Unmanned Aerial Vehicles, Journal of Guidance, Control, and Dynamics, Vol. 39, No. 9 (2016), pp. 1980-1993.
[6] G. C. Bertoli & all: Extending Flight Endurance of Electric Unmanned Aerial Vehicles through Photovoltaic System Integration, Renewable Energy Research and Applications (ICRERA), 2015 International Conference on.
[7] H. Park et al., Flight Evaluation of Solar Powered Unmanned Flying Vehicle Using Ground Testbed, 15th Int. Conf. on Control, Automation and Systems (ICCAS 2015), Oct. 13-16,Bexco, Korea
[8] D. Sera et al, Improved MPPT method for rapidly changing environmental conditions, IEEE ISIE 2006, July 9-12, 2006, Montreal, Quebec, Canada
[9] B. Jacques, Energie Solaire, Calculs et optimisation, Ellipses, 2011. ISBN : 9782729864927
[10] N.B. Nguyen. Modeling and Simulation of Photovoltaic Generator, Master Thesis, <dumas-01220257>
[11] O. Trembley et L.-A. Dessaint, «Experimental Validation of a Battery Dynamic Model for EV Applications,» World Electric Vehicle Journal Vol. 3 - AVERE, Stavanger, 2009.
[12] O. Tremblay, L.-A. Dessaint et A.-I. Dekkiche, «A Generic Battery Model for the Dynamic Simulation of Hybrid Electric Vehicles,» IEEE, 2007.
[13] A.Q. Al-Shetwi, M. Z. Sujod, ‘Modeling and Simulation of Photovoltaic Module with Enhanced Perturb & Observ Algorithm using Matlab/simulink’, ARPN, Journal of Engineering and Applied Sciences, Vol. 11, N°. 20, Oct 2016
[14] G. Notton et al., Calculation of solar irradiance profiles from hourly data to simulate energy systems behaviour, Renewable Energy 27 (2002) 123–142
[15] J. A. Duffie, W.A. Beckman, Solar Engineering of Thermal Processes, John Wiley & Sons, New Jersey, 2006.
[16] http://herve.silve.pagesperso-orange.fr/solaire.htm
![Fig. 1 Horizontal coordinates of the sun: azimuth (α) and elevation (h), from [16]](https://thumb-eu.123doks.com/thumbv2/123doknet/3018348.84841/2.892.504.848.791.1114/fig-horizontal-coordinates-sun-azimuth-α-elevation-h.webp)