OATAO is an open access repository that collects the work of Toulouse
researchers and makes it freely available over the web where possible
Any correspondence concerning this service should be sent
to the repository administrator: [email protected]
This is an author’s version published in:
http://oatao.univ-toulouse.fr/27483
To cite this version:
Prioux, Manon
and Duluard, Sandrine Nathalie
and Ansart, Florence
and Pujol, Guillaume and Gomez, Philippe and Pin, Lisa Advances in the
control of electrophoretic process parameters to tune the ytterbium disilicate
coatings microstructure. (2020) Journal of the American Ceramic Society, 103
(12). 6724-6735. ISSN 0002-7820
DOi: IO.l l l l/jace.17365
Advances in the control of electrophoretic process parameters to
tune the ytterbium disilicate coatings microstructure
Manon Prioux
1G
Philippe Gomez
21
Sandrine Duluard
1G
LisaPin
31
Florence Ansart
1 1Guillaume Pujoi
21Université de Toulouse, CNRS, INPf, UPS, Université Toulouse 3Paul Sabatier, Bât CIRIMAT, Toulouse Cedex 9, France 2DGA Aeronautical Systems, Balma Cedex, France
3Safran Ceramics, Merignae, France
Correspondence
Manon Prioux, Université de Toulouse, CNRS, INPf, UPS, Université Toulouse
3 Paul Sabatier, BâtCIRIMAT, 118 Route de Narbonne, 31062 Toulouse Cedex 9, France. Email: [email protected] Fundlng infonnatlon Safran; OGA
1
INTRODUCTION
AbstractSuspensions of ytterbium disilicate in isopropanol were prepared using iodine dis persant. Their zeta potential, electrical conductivity, and pH dependence with iodine concentration is detailed. Electrophoretic deposition was performed on silicon sub strates at various voltages (100-200 V) and rimes (until 10 minutes) and the growth dynamic was investigated. It was observed that the deposited mass reaches a maxi mum value for [12] = 0.2 g/L, and the coating microstructure becomes porous at higher iodine concentrations. Current density and voltage measurements allowed to correlate this behavior to the increase of free protons concentration in the suspen sion. In these conditions, it was proved that porosity increases with the increase in applied voltage, and a compaction occurs as the deposition tirne increases. This has been related to the coating resistance increase and subsequent decrease in effective voltage in the suspension. The denser coatings (20% of porosity) were obtained in the case of suspension without iodine, at the minimum applied voltage and for the longest deposition times.
KEYWORDS
coatings, electrophoretic deposition, environmental barrier coatings (EBC), microstructure
Rare earths silicates find many applications in aeronautics or energy field. One of them is relative to the high tempera ture protection of cerarnics such as SiC-based materials. Generally, environrnental barrier coatings (EBCs) are needed to protect SiC-based cerarnic materials against water vapor corrosion at high temperature.1 The development of such coating systems is necessary to implement SiC/SiC cerarnic matrix composites in hot section components of advanced gas turbine machine.2 lndeed, at high temperature in dry air, the SiüSiCs react with oxygen to form a thin protective sil ica layer. However, in combustion environrnent, water vapor reacts with the silica, forming gaseous reaction products such as Si(OH)4, leading to severe recession of the SiC.3-5 Ytterbium disilicate YbiSi2O7 is a prornising material for
EBCs, because it has an excellent resistance to volatilization and a thermal expansion coefficient close to that of the Siü SiC substrate one (5.06 x
10-
61
°c
for SiC and 4.5 x10-
61
°c
for YbiSi2O7).6 Moreover YbiSi2O7 exhibits a single phase structure up to about 1600°C.7 The properties of EBCs vary with the different preparation processes. There are several methods to produce ceramic coatings, such as chernical vapor deposition, physical vapor deposition, ion implantation, ther mal-spray, soft chernistry including sol-gel routes and newly developed electrophoretic deposition (EPD).8-12Electrophoretic deposition is a suspension process ing technique, and is increasingly gaining applications in manufacturing of thin and thick films, larninates, advanced functional coatings, porous materials, ceramics with com plex geometric shape, or thermal barrier coatings.13-15 Once the EPD processing and suspension parameters well were
detennined, this process is robust, rapid, low-cost and ver satile. EPD is a two steps process: (a) migration of charged particles in a suspension under an electric field between two electrodes, and (2) particles coagulation on one of the electrode surface.16 The preparation of a stabilized parbti cles suspension is essential to obtain homogeneous and re productive coatings. The stability is achieved by adjusting inter-particles forces.17-18 The optimization of the process parameters such as applied deposition voltage and time is necessary to tune the deposit microstructure (thickness, density, homogeneity). Suspension properties and stability depend on the nature (metallic, ceramic, or polymer), size, and concentration of the particles, type of solvent and ad ditives. Most of the works in the EPD field correspond to non-aqueous media. Organic liquids and alcohols offer many advantages such as their good chemical stability, which avoid adverse reactions to the electrode, disrupting the for mation of the coating. 16 Among the conventional sol vents used in EPD, isopropanol is a good candidate due to its low dielectric constant (19.4), low viscosity (2.04 mPa s), and a moderate evaporation rate (saturated vapour pressure equal to 4.4 kPa).19-21 The kinetics of EPD has also been widely investigated. 16•22-24 In particular, controlling the kinetics during EPD makes possible the control of the desired mass/ thickness of deposit. In a first approximation, the Hamaker model for EPD kinetics is proposed:25
dw
-=µxcxAxE,
dt (1)with dw/dt the deposition rate (gis), µ the electrophoretic mo bility of particle (cm2/(s V)), c the particles concentration in
the suspension (g/cm\ A the deposition area (cm2), and Ethe applied electric field (V /cm). The electrophoretic mobility µ is calculated using the following equation:26
(2) with e0 the vacuum pennittivity, Er the relative dielectric con stant of the suspension medium, ç the zeta potential of particles, and I'/ the viscosity of the solvent. However, this model is only relevant for low concentrations and short experiments. In gen eral, the evolution of the different parameters with rime must be taken into account: depletion in particles concentration, evolu tion of suspension parameters (conductivity, etc ... ), decrease of the efficient voltage due to the electrically resistive character of the deposited coating, etc In ethanol-based suspensions, Sarkar and Nicholson suggested that the decrease of the deposited mass is mainly influenced by the decrease of both solid loading in the suspension and electric field.22 Ferrari and Moreno took into account the change of the conductivity of alumina suspen sions with time during EPD.23 For ytterbium disilicates, such
systematic study of the kinetics is necessary to determine the deposited mass depending on the deposition parameters.
The aim of this present work was to investigate EPD of ytterbium disilicate (Yb2Si207) coatings from suspension prepared with isopropanol and iodine (12) as conductivity modifier, and to study the effect of various parameters such as the iodine concentration, applied voltage and deposition rime on the EPD kinetics and on the morphological proper ties of the YbiSi207 coatings.
2
2.1
EXPERIMENTAL PROCEDURE
Materials
Ytterbium disilicate powder (Marion Technologies France, 214.270.007) with an average particles size of 300 nm was used as received. Isopropanol (>99%; Merck) and lodine 12 (99.5%; Fisher chemical) were used as solvent and dispersant, respectively. Silicon wafers were used as substrates (Sil'tronix Silicon Technologies, France, stock list reference W3707, P-boron, resistivity 10 Q cm). Before deposition, the surfaces of the substrate were sand blasted with Al203 particles at 4 bars for 30s, in order to get a substrate roughness similar to that of the foreseen application, and then cleaned in ethanol and acetone in an ultrasonic bath during 10 minutes each. The arith metic roughness after preparation is around 4µm.
2.2
Suspension preparation
lodine solutions at 0, 0.1, 0.2, 0.3, 0.5, and 0.8 g/L were pre pared in isopropanol and magnetically stirred for 30 minutes until complete dissolution of iodine. Yb2Si2� powders were added with a concentration [Yb2Si2�] = 30 g/L, then ex posed to ultrasonic stirring (franssonic TI-H-15 35/130 kHz) for 15 minutes and then magnetically stirred for 12 hours. Finally, just before deposition the suspension was placed in the ultrasonic bath for 15 minutes.
2.3
Electrophoretic process
Electrophoretic deposition for ail specimens was performed using a two-cell electrode; a plate of platinum with an area of 10 cm2 was used as anode. The silicon substrate was used as the cathode (area of 4 cm2) at a distance of 20mm from the anode. The EPD process was performed at different voltages (Vapp = 50, 100, 150, and 200 V) and times (td = 15, 30, 60, 120, 180, 300, and 600 seconds) using a DC power supply (sourcemeter Keithley 261 lA). The current density (i) was measured during the deposition process using a computer connected to the sourcemeter (TLS express software). After
deposition, the cathode was taken off the bath at a controlled withdrawal speed of 20 mm/min. The wet coatings were dried at room temperature during 1 hour. Theo the coatings were heat treated at 1300°C during 10 hours in air.
The effective voltage ¼:tT and electrical resistance of the deposit
Rd at any rime t were calculated using the following equations: (3)
where Vapp is the applied voltage and i(t) is the transrnitted cur rent from electrophoretic circuit. Rs is the suspension resistance, deterrnined using the Ohm's law by dividing the applied voltage by the current passes through the circuit at td
=
0 seconds. As confirmed by conductivity measurements before and after deposi
tion, the suspension resistance was considered as constant during the whole deposition duration (for [12]
=
0 g/L a= 0.230 µS/cmbefore deposition, and a= 0.236 µSiern after deposition).
Yaw
isthe applied electric voltage (constant in this study) and V drop (t) is
the voltage drop over the deposit. R5 and Rœp, the resistance of the
suspension and of the deposit produced by EPD are composed of
two components, one resistance related to the powder and another
to the interparticle liquid. Theo as the current is carried by both free ions and charged particles,27 the electrical resistance of the suspension can be obtained by the following equation:28
where and [ 1 1
1-I
R sus=
--+--R /,sus R p,sus L-d R1 ,sus =--A al,sus R p,sus =_L_-_d_ µAcQetT' (5) (6) (7)R1,sus represents the resistance of the ions in the suspension, Rp,sus the resistance of the powder particles in suspension, L and A are the electrode distance (m) and surface area (m2) respec
tively, d is the deposit thickness (m), Qeff the effective powder
charge (C/kg), and ai.sus is the conductivity of the liquid in sus pension (Sim).
The deposition resistance can be calculated as follows:28
[ 1 1
1-l
Rd ep=
--+--R1,cJep Rp,dep (8) where d R�dep= ---,
(j�de�(l-p) (9) and R p,dep -- d a p,dep--Ap, (10)with Rp,dep the resistance of the powder contribution, Ri,cJep the
resistance of the liquid contribution, ap,dep the conductivity of
the dry powder in the deposit, and p is packing factor. a�dep, the conductivity of the interparticles liquid is slightly higher than the one of the suspension a1 sus, due to counter-ions release from the particles cloud at the el�trode.28
The mass wd of the coatings was deterrnined by weight ing the silicon substrate before and after deposition (Atilon,
d
=
0.1 mg, max 120 g). Hence the green density Pgreen d of the deposit is calculated by a mass and volume method: (11) where d is the thickness of the green deposit, and S is the deposit area
2.4
Suspension and coating
characterizations
The zeta potential, the electrophoretic mobility, and the particle size in the suspension were measured using particle and zeta potential analyser (Zetasizer nano; Malvern). The suspension operational pH was measured using a normal ized cell (WTW lnolab 7110). The electrical conductivity of the suspensions was measured as a function of [12] with a conductimeter (Mettler Toledo, Seven2Go Cond meter S7). The XRD pattern was obtained with the diffractometer RX D4-BRUKER-AXS. Surface morphology and microstruc ture were investigated by scanning electron rnicroscopy (FEG-SEM, FEI Quanta 250). Thickness of deposits was deterrnined by step profiling using an interferometric and confocal microscope (S-Neox; Sensofar). The method con sists in measuring the path difference between the coated and uncoated part of the substrate. The measurements are carried out over the length of the coating, three times in three places, in order to have a consistent average of the thickness of the coating. The results are reproducible to ±4%. The porosities of the sintered coatings are deterrnined by image analysis (lmageJ), with five images in each case.
3
3.1
RESULTS AND DISCUSSION
Morphology of the Yh
2Si
20
7powder
The XRD diagram of the as-received Yb2Si2Ü] powder is shown in Figure lC. All peaks correspond to the YbiSi207phase (JCPDS 01-072-064). Figure 1 A exhibits SEM image of the powder. The particles have regular shapes with rela tively uniform size (average size of 0.2 µm) which is in good agreement with granulometry measurements (Figure 1B) and the supplier specifications: d50 = 300 nm. The specific surface area was evaluated at 7 m2/g using the therory of Brunauer, Emmett and Teller method.
3.2
Conductivity and zeta potential
measurements of the suspension
lodine is a well-known electrostatic dispersant in different organic solvents, such as acetone,29-31 acetylacetone,32 meth anol,33 ethanol,29-30 and isopropanol.34-35 The effect of iodine addition in the isopropanol solvent on both the electrical con ductivity and the operational pH of the suspensions is shown in Figure 2A. The electrical conductivity linearly increases from 0.2 to 6.7 µSiern with the iodine concentration, while the operational pH decreases from 6 to 2.5 between O and 1 g/L of iodine. This result suggests that free protons were
8
..
..
l
.
�l•
2g
2.
·,/".
0.
0.1formed because of a reaction between the sol vent and iodine. The proton generation from iodine and isopropanol reaction is described as follows:34-35
10
(CH3)i-CH-OH+l2 �l(CH3)i-COH+H+ +r. (12)
The concentration of H+ increases with iodine content
and causes a reduced pH value. The linear increase in the
conductivity of the suspension is attributed to the formation of the free ions. Shedbakar and Bhat studied the interaction between iodine and polar solvent such as methanol and eth
anol. 36-J7 Based on its dielectric constant. isopropyl alcohol
can also be associated to this study.
It is proved that in many donor-iodine accepter systems, the formation of triodide ions is often noticed as the medium is polar. The increase in the observed conductivity is at tributed to the transformation of the initially formed 1: 1 outer complex into the inner complex, followed by the fast reaction of the inner complex with iodine to form triiodide ions:37
100
fast slow
ROH+ 12:::; ROH -12 :::; (ROHl)+1-, (13)
� � !?. ë
s
1000 outercornplex innercornplex 10000§]
9000 , • Yb,So,O, -JCPDS 01-072--064 8000 6000 5000 "400 20 2S 30 35 ◄O 45 50 P811lcle d,ameter (µm) 2thela (')FIGURE 1 A, Scanning electron microscopy images, (B) size distribution of Yb2Si2O7, and (C) XRD pattern of YbzSip7 powder [Color figure can be viewed at wileyonlinelibrary .corn]
8
•
6 50 (A) (B) 7 •Conductivity • pH 5>
45 Ê6.s
\fi
l
�•
4 � 40t
55
•
•
ë:Î
4•
•
3J: 0 a. 35•
ro-6
3•
2 N � 30•
U 2•
1 25•
0•
0 20 -0,1 0,1 0,3 0,5 0,7 0,9 1,1 -0,1 0,1 0,3 0,5 0,7 0,9 1,1lodine concentration (g/L) lodine concentration (g/L)
FIG URE 2 A, Effects ofl2 addition on electrical conductivity and pH on Yb2Sip7 isopropanol suspension, and (B) the zeta potential versus iodine concentration [Color figure can be viewed at wileyonlinelibrary.com]
(14) Another study also proved, in the case of acetone io dine solution, that surface charging mechanism takes place through the formation of CH3CH2ICOH+ complex cations.31 It is also suggested that, in addition to the electrostatic stabi lization, the adsorption of these compounds provides a steric contribution to the stabilisation mechanism. Taking into ac count these elements, the formation of the complex ((CH3)i CH-OHit can be considered in this case.
The zeta potential of the ytterbium disilicate particles as a function of the iodine concentration is shown in Figure 2B. The particles acquire a positive zeta potential without iodine ( +43 m V) and it remains stable around +40 m V until a concen tration of 1 g/L of iodine. It means that all the suspensions are well dispersed and stable. It is usually reported that an appro priate addition of iodine in the solution enhances the adsorp tion of
W
or as mentioned above the complex (ROHit, on the surface of the particle. The adsorbed species increase the zeta potential and improve the dispersion of the colloids. In this case the zeta potential rneasurernent shows that ytterbium disilicate particles are positively charged in pure isopropanol (Figure 2B) which suggests that the ytterbium disilicate particle surface can adsorb hydroxyl groups from moisture in air or residual water in isopropanol. The zeta potential tends to slightly decrease with increasing iodine concentration, due to the increase in the ionic strength of the suspension. This causes the compression of the double layer at high protons concentration, and conse quently a decrease of the zeta potential.16 Finally, in this case, iodine main purpose is to increase the electrical conductivity of the suspension whereas the zeta potential is not affected.3.3
1Deposited mass and
morphology of the deposit
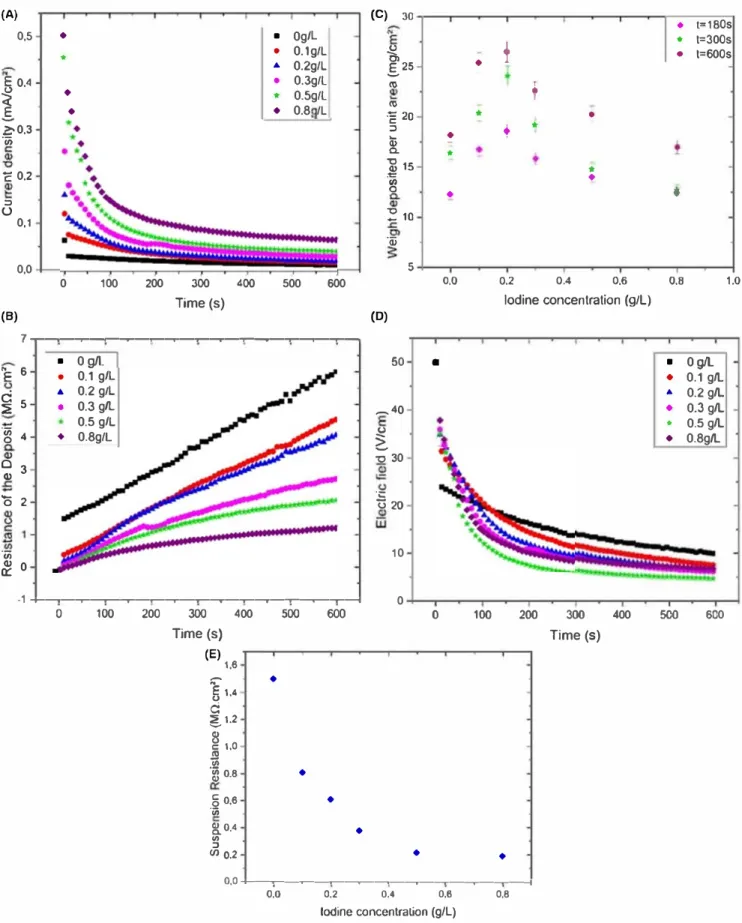
The Figure 3 exhibits the evolution of the current density during deposition (3A), resistance of the deposit calculated with Equation 3 (3B), and electric field calculated with equation 4 divided by the inter-electrode distance (3D) as a function of time, for deposition under the constant applied voltage of 100 V, for different suspensions containing vari ous iodine concentrations; as well as deposited mass (3C), and the suspension resistance (3E) depending on the iodine concentration. The suspensions containing iodine show a decrease in current density with deposition time reaching a plateau after maximum 200 seconds. The current densi ties decrease with deposition time; this is due to the forma tion of a deposit on the substrate with a higher electrical resistivity than the suspension one. As the iodine concentra tion increases, the initial value (t = 0) of the current density becomes higher as expected from the increase in electrical
conductivity of the suspension with iodine concentration (Figure 2A). It reaches the maximum value of 0.5 rnA/cm2
for [12] = 0.8 g/L. By increasing [12], the slope of reduction of the current density with time increases significantly. This could be also related to the increase of the electrical conduc tivity of the suspension. 38
The deposited mass increases with the iodine concentra tion for low iodine concentration, reaching a maximum value of 26 mg/cm2 after 600 seconds for [12] = 0.2 g/L, and then de creases sharply. Such a behaviour could be due to the increase of ionic concentration with the increase of iodine. As men tioned previously, the ytterbium disilicate nanoparticles have a relatively high zeta potential in the suspension (Figure 2B) implying that a relatively high concentration of ions is at tached to them and so in the deposit. Ytterbium disilicate ac quires strongly bonded protons at its surface, whereas when iodine is added, (ROHI)+ complex are formed and are weakly adsorbed on the surface. This result implies in the case of deposits from suspensions with iodine, some of the positively charged ions can be detached from the particles and migrate toward the cathode and transport the current. This suggests an increase of charge carriers in the interparticle liquid which increases its conductivity. In conclusion, it leads to the reduc tion of the electric resistance of the deposit (Equation 9). To explain the presence of the maximum, it should be noticed that the lower the iodine concentration, the higher the electri cal resistance of the coating (for a given deposition time) (see Figure 3B), leading to a lower deposited mass. This behavior is predominant for [12]
<
0.2 g/L. At higher iodine concen trations, despite a lower resistance of the deposits compared to the ones without iodine, the relatively high concentration of unabsorbed species in the suspension leads to an increase in the number of ionic species transported as compared to Yb2Si2Ü] particles. Consequently, at a deposition time of 600 seconds, whereas the electrical resistance of the coat ing deposited without iodine is six times higher (6 MQ cm2) than the one of the coating deposited with [li) = 0.8 g/L (1 MQ cm2), the deposited masses are very sirnilar, around17 mg/cm2
. Another remark concerns the deposit resistance, in the case where there is no 12: its value is high even after only few seconds of deposition, which means that even with a small amount of coating, the deposit is highly resistive, due to the low conductivity of the liquid in the deposit.
Figure 4 compares SEM images of the surface of coat ings deposited under 100 V during 3 minutes, using sus
pensions containing (a) [li) = 0 g/L; (b) [12] = 0.1 g/L; (c)
[12] = 0.3 g/L; and (d) [li)= 0.8 g/L. The deposited coatings
using suspension with low iodine contents ([li) = 0 g/L and
[12] = 0.1 g/L) present a uniform microstructure with fine par
ticles. From [12] = 0.3 g/L, agglomerates appear on the sur
face, but the microstructure remains dense with fine particles.
At higher iodine concentration ([12] = 0.8 g/L) a rougher sur
(A) 0,5
•
,.
E 0,4ï
•
•
l;-0.3 'ëi> ë 0.2 ::> (.) 0,1 0,0 0 (B) 100 200 300 400 lime (s)•
•
...
•
..
•
0g/L 0.1gfl 0.2g/L 0.3gfl 0.Sgfl 0.8 fl 500 600 7 ...---,-...,...---,...-�-.---.---r-...--...---.-...---,-...---. Ë 6 ci 5 � -� 4 0 3 Q) Ô 2 'ëi) � 0 • 0g/l • 0.1 g/1.. • 0.2 g/L • 0.3 g/1.. 0.5 g/1.. ♦ 0.8gfl -1 -1---,-....,....---,...-�-.---.---r-...--...---.-...---,-...---i 0 100 200 300 400 Time (s) (E) 1,6î
1,4 d � 1,28
j 1,0-�
� 0.85
0,6 'iii �0,4 (/) :::, en 0,2 500 600•
•
•
•
(C) JO l2s•
(1) (1) ·1§ 20*
::>...
•
Cl> -a.*
°'g 15 .t:: VI 0•
� 10 ëii 5 o.o (D) 50•
-40 0 � -o 30 i20 10 0 0 100•
• t=180st
• t=300s • t=600s•
1t
*
•
*
•
•
0.2 0.4 0,6 0,8 lodine concentration (g/L)•
•
...
•
•
•
200 300 400 500 lime (s)•
1,0 0g/l 0.1 g/1.. 0.2 g/1.. 0.3 g/l 0.5 g/l 0.8g/L 600 0,0 --�-�-�-�--.---.--.---.--�-� o.o 0,2 0,4 0,6 lodine concentration (g/L) 0,8FIGURE 3 A, Current density, (B) deposit resistance (C) variations in deposit weight as a function of iodine concentration for clifferent limes and (D) electric field measured during deposition, for different iodine concentrations as a function of tirne (Vapp = 100 V), and (E) the resistance of the suspension rneasured of iodine concentration determined using the Ohm's Jaw by dividing the applied voltage by the current through the circuit at Id= 0 s [Color figure can be viewed at wileyonlinelibrary.com]
� f,�f''i".!�
ci
Il r--;:3 ._._,
-
QOci
Il � ._._,
-
QOci
Il �is obtained. It can be noticed that the measured green density decreases with the iodine concentration, going from 4.5 g/
cm3 for the coating produced without iodine to 3.1 g/cm3 with
[12]
=
0.8 g/L. The density of ytterbium disilicate is equalto 6.13.7 The green density could also be correlated to the
packing factor p (Equations 9 and 10), which is a parameter
influencing the electrical resistance of the final coating.
As expected, the electrical resistance of the deposit in creases with the deposition time, due to the increase in the deposit thickness (d parameter in Equations 9 and 10). As the
resistivity of the dry ytterbium disilicate powder is very high, the deposit resistance Rœp is nearly equal to the resistance of
interparticles liquid in the deposit (Ri,dep).
(15) With o-1,dep, the conductivity of the interparticles liquid, which is slightly higher than the suspension conductivity,
FIGURE 4 Scanning electron microscopy images of the Yl½Sip7 coatings deposited at U = 100 V from the suspension containing (A) [I:i] = 0 g/L, (B) [I2] = 0.1 g/L, (C) [I:i] = 0.3 g/L, and (D) [I2] = 0.8 g/L, respectively [Color figure can be viewed at wileyonlinelibrary.com]
due to the containment of ions at the vicinity of the elec trode.24 As it is shown previously (Figure 3B), the lower the iodine concentration, the higher the electrical resistance of the coating (for a given deposition rime). So, considering the Equation (13), with a surface areaA identical for the coatings, and the rather similar thickness d of the deposited coatings at
100 V after 600 seconds (42 µm for [12]
=
0 g/L and 50 µmfor [12]
=
0.8 g/L), the packing factor and the conductivity of the interparticles liquid in the coating remain the more crit ical parameters on the electrical resistance. As it is proved previously, the packing factor decreases with the iodine con centration, whereas the conductivity increases, leading to the decrease in the electrical resistance.3.4
Kinetics of deposition
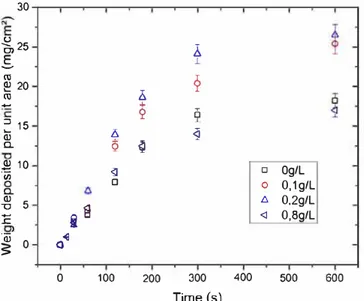
Figure 5 shows the deposition weight of YbiSi207 vs time depending on the iodine concentration ([12]
=
0-0, 1-0,2- 0, 8 g/L). According to Hamaker's relation, the depos ited weight increases as both deposition tirne t and applied voltage Vapp increase. However, in all cases, two distinct re gions can be pointed. In the first one, for t
<
1 20 seconds, the evolution is linear while as expected for long deposition rimes (t>
120 seconds), the real deposited mass deviates from Hamaker's law. A plateau in deposited mass is reached around t = 600 seconds for all compositions. The depletion of particles from the suspension can slow down the depo sition.22 However, the relatively loaded suspensions used in this work, showed that by using them repeatedly (up to eight rimes), there was no significant change in the mass depos ited at the electrode. In this case, the decrease of the electric30 "a,25
.s
CO � 20 CO -: 15 li. Q) o. Q 2 10 � ëii 0 o. Q) 5 -0 � 1:i
ïii 0 Cj�s
0 100X
.l l,.2
� � � � 200 300 400 Time (s) □ Og/L 0 0, 1g/L li 0,2g/L <1 0,8g/L 500 600FIG URE S Variation in deposited weight per unit area as a
fonction oftime for [lJ = 0-0.1-0.2 and 0.8 g/L at Vapp = 100 V [Color
figure can be viewed at wileyonlinelibnuy.com]
(A)0,020�---�--.---�---�--.--� 0,015
'i'
.( 0,010 � C ,_J 0,005 o IMtho,t todioe J o With 0, 1g/L of lodine --Linear fit --Linear fit a 0 0,000 --�---,.---,---,----,----,---t 0 50 100 Time (s) 150 200field is mainly responsible for the deposition rate's reduc tion. lndeed, as it is shown in Figure 4D, the electric field at t = 600 seconds is equal to 19 V /cm for [12] = 0 g/L and 6 V/ cm for [12] = 0.5 g/L while the initial electric field is around 50 V/cm.
According to Zhang,39 the changes in weight of de
pos
ited coatings over time could be represented by a parabolic equation according to the following ones (represented in Figure 6A):
(16)
with w0 the initial weight of particles in the suspension, td the deposition tirne and -. a kinetic constant which could be calcu lated with the following relation22:
V
-r=--, JAEµe (1 7)
where V (cm3) is the volume of suspension, A (cm2) the depos
ited area, µe (m2N s) the electrophoretic mobility, E (V/cm),
the electric field at the deposit/suspension boundary, and/the sticking factor. Not a11 the particles of Y½Si20, which move toward the substrate electrode during EPD, are deposited on the substrate. The/factor, also called sticking factor represents the fraction of deposited to suspended particles. According to the Equations (16) and (17), the/factor can be calculated. It is pre sented in Figure 6B as a function of tirne. The sticking factor is
calculated for two suspensions with [li) = 0 and 0.1 g/L, taking
into account the suspension volume (100 mL), the applied volt age (100 V) and the electrophoretic mobility (0.35 µm cmN s). The value of the sticking factor decreases with the deposition tirne. It could be related to the growth of the electrically re sistant layer on the surface electrode.40 The reduction is more
(B) 1,0 0 0 0,8
2
02
� 0.6 0t/5
0.4 0,2 09
2
100 a Without lodine o Witho,
1g/L of lodine 02
2
200 300 400 Tîme (s) 500 600FIG URE 6 Variation in deposited weight ofYb2Si2O7 (A), and calculated values for sticking factorf(F,quation 15), (B), as a fonction of deposition lime for and applied voltage of 100 V, for two suspensions: without iodine and contai oing [li] = 0.1 g/L [Color figure can be viewed at wileyonlinelibnuy .corn]
important for [12]
=
0.1 g/L than without iodine, following thetrend of the decrease of the effective electric field (Figure 3D). Until 180 seconds of deposition rime, the /factor is lower for the suspension without iodine, than the one with 0.1 g/L; this is due to the growth of the electrically resistant layer on the surface
substrate which is higher for the coating without iodine.
3.5
Coatings morphology evolution with
deposition time
The SEM cross sections of the deposited coatings of Yb2Si2Ü], for [12]
=
0, 0.3, and 0.8 g/L, after 180 and 600 seconds of deposition, are gathered in Figure 7. It can be seen on Figure 7C,E, a porous zone in the vicinity of the substrate, and a uniform coating without iodine. As discussed in the previous sections, this could be generated by the ions present in the suspension, with the charged Yb2Si2Ü] particles. As
en
0
CO
�
Il
....
en
0
0
'°
Ilthe iodine concentration increases, so does the unabsorbed ions concentration, as well as the porous zone near the sub strate. Another phenomenon could be responsible of the pores near the substrate: the production of hydrogen bubbles as a result of proton reduction at the cathode, as suggested by the following equation:41
+ transport process + _ charge transfer process 1
( 18)
H-=00 ➔ Hx-=0 +e ➔
2
H2,where the subscript x
=
0 corresponds to the position of the outer Helmholtz plane. The transport of protons from the bulk (x = oo) to the electrode-solution interface (x = 0) as well as the charge transfer process involve an activation energy. If the charge transfer is at virtual equilibrium, the process is controlled by the diffusion rate of protons from the bulk to the electrode. However, no gas evolution was observed during the EPD. This is confirmed by the decrease of the deposit resistance. lndeed,FIG URE 7 Scanning electron microscopy cross-section ofYb2Sii07 coating deposited at 100 V for (A, C, E) 180 s and (B, D, F)
roo
s fromin the case of ion depletion at the electrode, the coating resis tance should increase significantly.
On the second part of Figure 7B,D,F, the influence of the deposition time on the coating microstructure is underlined. In addition to the fact that the coating thickness is greater at 600s, especially for [12]
= 0.1-0.3 g/L (30 µm without iodine,
77 µm for [12] = 0.1-0.3 g/L, and 34 µm [12] = 0.8 g/L, respectively), which is explained previously, deposits are denser. This is both confirmed by the green density of the coating at 600 seconds: 5.2, 3.9, and 3.5 g/cm3 against 4.5, 3.7, and
3.1 g/cm3 at 180 seconds (Figure 4), respectively, and by the
global density after sintering. This is related to the decrease in the deposition rate, mainly due to the decrease of the electric field Eeff (Figure 3D). The coating formed without iodine is 20% denser at td = 600 seconds than at td = 180 sec onds. Coatings formed with iodine are about 10% denser at td
=
600 seconds. This is related to free ions present who set tle in the interparticles liquid and cause more heterogeneities.Finally, adding iodine in isopropanol suspension allows to increase the deposition rate of ytterbium disilicate pow der, as long as it does not exceed 0.3 g/L. Over this value the microstructure is more affected. In the case where both a dense and thick coating is sought, the best compromise be tween deposition rate and dense microstructure seems to be a suspension with 0.1 g/L of iodine (not too low to keep a suitable deposition kinetics and not too high to avoid porous microstructures). It allows coatings to be thicker than those from a suspension without iodine (Figure 3C), while retain ing a relatively high density (Figure 4).
3.6
Influence of applied voltage on green
density of the coatings
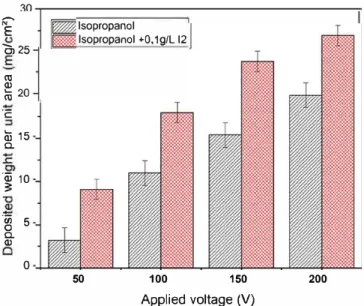
Figure 8 shows the deposited weight per unit area as a function of the applied voltage Vapp for suspensions with [li) = 0 g/L
and [li) = 0.1 g/L fort= 180 seconds. As expected, for both
suspensions, the deposited mass increases with the applied voltage. The green density of the coatings is calculated as mentioned in the section "2.4 Suspension and coatings char acterizations" and is reported on Figure 9. The green density decreases with the applied voltage for the coating deposited from the suspension with [12]
= 0.1 g/L. This is due to the
excessive motion of particles, at high applied voltage, which does not allow a good arrangement of the deposit. Negishi et al42 have shown that the current density becomes unstableas the applied electric field increases, mostly above 50 V/cm. On the contrary, in the case of the iodine-free deposit, the green density at 50 V (3.7 g/cm3) is still lower than the one at
100 V (4.4 g/cm\ This result involves that, when the motion of the particles is to low, the deposit exhibits more porosi ties. The energy transmitted to the particles is not sufficient in the case where 50 V is applied. So that, the applied voltage
of 100 V seems the most suitable value to obtain the denser coatings. Also, it can be deduced from Figure 9 that the green density of the coating deposited with [li) = 0 .1 g/L is lower than the one of the coating deposited without iodine. It can be related to the free ions concentration which is higher in the case of [li)= 0.1 g/L; they migrate toward the cathode and generate porosity.
Finally, taking into account ail these coupled parameters, Figure 10 exhibits cross-sections of the deposited coatings from suspension with [li) = 0 g/L and [12] = 0.1 g/L at applied
;:;- E o,25 <Il Q)
ro
20 ï:: ai 15 a. 110 -� 5 a. Q) 0 lsopropanol lsopropanol +O, 1g/L 12 50 100 150 Applied voltage (V) 200FIG URE 8 Deposited weight as a function of the applied voltage for suspension containing isopropanol and [Iil = 0 g/L and
[Iil = 0.1 g/L after 180 s of deposition [Color figure can be viewed at
wileyonlinelibnuy .corn] 6
�---r:a-;;a_;;;_,...-.:.:.::.::.::=======::;�
� lsopropanol -lsopropanol + 0, 1g/L 12 5 50 100 150 200 Applied voltage (V)FIG URE 9 Green density of the coating as a function of the applied voltage for suspension containing isopropanol and [I:J = 0 g/L and [I:J = 0.1 g/L after 180 s of deposition [Color figure can be viewed at wileyonlinelibrary.com]
[1
2]=0 g/L
>
g
>
g
voltage of 100 and 200 V. The effect of voltage magnitude on the coating is clearly shown in this figure. By increas ing the applied voltage, the deposit microstructure becomes more porous and less uniform, due to the high velocity of the particles in higher voltage. lndeed, there is not enough rime for particles to organize in the appropriate location to make the deposit denser. This result is in good correlation with the results of the Figure 9. The denser and very conformai coat ing was obtained with the suspension without iodine at an applied voltage of 100 V.
4
CONCLUSION
Ytterbium disilicate coatings were deposited on silicon substrate by EPD using iodine and isopropanol as addi tive and solvent, respectively. All suspensions prepared with various iodine concentrations, presented high stabil
ity (ç
=
+40 mV). It was proved that iodine acts as aneffective generator of free ions, leading to the increase of the suspension conductivity. It was found that the maxi mum deposition rate was obtained from the suspension with 0.2 g/L. This concentration corresponds to the bal ance between a moderate conductivity and a low concen tration of free ions in the suspension. It was observed that the coating microstructure becomes porous at high iodine concentration, because of the increase of free ions in sus pension. Mass of deposited coatings increases with both increasing time and applied voltage. Relative to the mi crostructure, it was proved that inhomogeneities increase
FIGURE 10 Scanning electron
microscopy cross-section of YbzSiP7 coatings at (A), (C) 100 V and (B), (D)
200 V, after 180 s of deposition, from suspension containing isopropanol and (A, B) [li] = 0 g/L and (C, D) [li] = 0.1 g/L, after heat treatment at 1300°C
with the increase of applied voltage, mainly due to the high velocity of particles at high voltage and a compaction occurs when the deposition time increases because of the decrease of the deposition rate due to the increase of the
electrical resistance of the deposit Rd, and consequently to
the decrease of the electric field Eeff· Furthermore, it was
shown that the sticking factor decreases with the deposi tion time. Finally, the denser coatings (20% of porosity) were obtained with suspension without iodine, at an ap plied voltage of 100 V .
ORCID
Manon Prioux
8
https://orcid.org/0000-0001-9780-1362Sandrine Duluard
8
https://orcid.org/�0002-8095-6170REFERENCES
1. Lee KN. Protective coatings for gas turbines. In: Dennis R (Ed.),
The gas turbine handbook. Cleveland: United States Department of Energy (DOE), 2006.419-436.
2. Fu HZ. Challenge and development trends of future aero engine materials. J Aeronaut Mater. 1998;18(4):52-61.
3. Opila EJ, Hann RE Jr. Paralinear oxidation of CVD SiC in water vapor. J Am Ceram Soc. 1997;80(1):197-205.
4. Opila EJ. Variation of the oxidation rate of silicon carbide withwa ter-vapor pressure. J Am Ceram Soc. 1999;82(3):625--36.
5. Robinson RC, SmialekJL. SiC reœssion caused by SiO2 scale vol atility under combustion conditions. I. Experimental results and empirical mode!. J Am Ceram Soc. 1999;82(7): 1817-25.
6. Jacobson NS, Fox OS, SmialekJL DC, Lee KN, GRC. Performance of ceramics in severe environments. Cleveland: NASA Glenn Research, 2005; p. 1-36.
7. Flesche J. Polymorphism and crystal data of the rare-earth disili cates of type R.E.2Sip7• J Less Common Met. 1972;21:1-14.
8. Auger ML, Sarin VK. The development of CVD mullite coatings for high temperature corrosive applications. Surf Coat Technol. 1997;94-95:46-52.
9. Harder BJ, Zhu D. Physical vapour deposition of thermal and envi ronmental protection system. ITSC 2012, Houston TX, May 21-24 2012.
10. Von Niessen K, Gindrat M. Plasma spray-PVD: a new thermal spary process to deposit out of the vapour phase. J Therm Spray Technol.2011;20(4):736-43.
11. Ramasamy S, Tewari SN, Lee KN, Bhatt RT, Fox OS.
Environmental durability of slurry based mullite-gadolinium sili cate on silicon carbide. J Eur Ceram Soc.2011;31:1123-30.
12. Al Nasiri N, Patra N, Pezoldt M, Colas J, Lee W E. Investigation of
a single-layer EBC deposited on SiC/SiC CMCs: processing and corrosion behaviour in high-temperature steam. J Eur Ceram Soc. 2019;39:2703-11.
13. Van der Siest 0, Vandeperre L, Put S, Anné G, Vleugels J.
Larninated and functionally graded cerarnics by electrophoretic deposition. Adv Sei Technol. 2006;45:1075-84.
14. Abdoli H, Zarabian M, Alizadeh P, Sadrnezhaad SK. Fabrication of aluminium nitride coatings by electrophoretic deposition: effect of particle size on deposition and drying behaviour. Ceram lot 2011;37(1):313-9.
15. Maleki-Ghaleha H, Rekabeslarni M, Shakeri MS, Siadati M, Javidi
M, Talebian S, et al. Nano-structured yttria-stabilized zirconia coat ing by electrophoretic deposition. App Surf Sei. 2013;280:666-72.
16. Besra L, Liu M. A review on fundamental and applications of elec trophoretic deposition. Prog Mater Sei. 2007;52(1): 1-61. 17. Koelmans H, Overbeek G. Stability and electrophoretic deposi
tion of suspensions in non-aqueous media. Discuss Faraday Soc. 1954;18:52-63.
18. Zhitornirsky I. Cathodic electrodeposition of cerarnic and organoc erarnic materials: fundamental aspects. Adv Colloid Interface Sei. 2002;97:279-317.
19. Das D, Basu RN. Suspension chernistry and electrophoretic depo sition of zirconia electrolyte on conducting and non-conducting substrates. Mater Res Bull. 2013;48:3254-61.
20. Saberi F, Shayegh B, Doostmohamdi A, Baboukani AR, Asadikiya
M. Electrophoretic deposition kinetics and properties of Zr02 nano
coatings. Mater Chem Phys. 2018;213:444-54.
21. Farrokhi-Rad M, Shahrabi T. EPD of titania nanoparticles: sticking parameter deterrnination. J Am Ceram Soc. 2012;95(11):3434-40. 22. Sarkar P, Nicholson PS. Electrophoretic deposition (EPD): mech anisms, kinetics, and application to cerarnics. J Am Ceram Soc. 1996;79(8): 1987-2002.
23. Ferrari B, Moreno R. EPD kinetics: a review. J Eur Ceram Soc. 2010;30: 1069-78.
24. Van der Siest 0, Vandeperre L. Electrophoretic deposition of ma terials. Anou Rev Mater Sei. 1999;29:327-52.
25. Hamaker HC. Formation of a deposit by electrophoresis. Trans Faraday Soc. 1940;36:279-87.
26. Smoluchowski M. Versuch einer mathematischen Theorie der Koagulationldnetik kolloider Loesungen. Z Phys Chem. 1917;92:129-32.
27. Sussman A, Ward TJ. Electrophoretic deposition of coatings from glass-isopropanol slurries. RCA Rev. 1981;42:178.
28. Van Der Siest 0, Put S, Anne G, Vleugels J. Electrophoretic deposition for coatings and free standing objects. J Mater Sei. 2004;39(3):779-85.
29. Yiang K, Shen JH, Yang KY, Hung IM, Fung KZ, Wang MC.
Characterization of the yttria-stabilized zirconia thin film electro phoretic deposited on Lao.8Sr0_2MnO3 substrate. J Alloy Compd. 2007;436:351-7.
30. Chen F, Liu M. Preparation of yttria-stabilized zirconia (YSZ) films on Lao.85Sr0.15MnO3 (LSM) and LSM± YSZ substrates using an electrophoretic deposition (EPD) process. J Eur Ceram Soc. 2001;21:127-34.
31. Dusoulier L, Cloots R, Vertruyen B, Moreno R, Burgos-Montes 0, Ferrari B. YBazCup7_x dispersion in iodine acetone for electro phoretic deposition: surface charging mechanism in a halogenated organic media. J Eur Ceram Soc.2011;31:1075-86.
32. Ji C, Lan W, Xiao P. Fabrication of yttria-stabilized zirconia coat ings using electrophoretic deposition: packing mechanism during deposition. J Am Ceram Soc.2008;91(4):1102-9.
33. Kadam MB, Sinha 88, Kalubarme RS, Pawar SH. Transformation of Mg82 powder into superconducting film via electrophoretic deposition technique. J Alloy Compd. 2009;478:467-73.
34. Lee YH, Kuo CW, Shih CJ, Hung IM, Fung KZ, Wen SB, et al.
Characterization on the electrophoretic deposition of the 8 mol% yttria-stabilized zirconia nanocrystallites prepared by a sol-gel pro cess. Mater Sei Eng. 2007;445:347-54.
35. Jia L, Lü Z, Huang X, Liu Z, Chen K, Sha X, et al. Preparation of YSZ film by EPD and its application in SOFCs. J Alloy Compd. 2006;424:299-303.
36. Bhat SN, Dwivedi R. Transference number of charge-transfer complexes in solutions: methanol-iodine and ethanol-iodine. Proc Indian Acad Sei (Chem Sei). 1980;89(4):337-40.
37. Shedbalkar VP, Bhat SN. Transport number of charge transfer complexes in solution. Electrochim Acta. 1983;28(3):359-61. 38. Stappers L, Zhang L, Van der Siest 0, Fransaer J. The effect of
electrolyte conductivity on electrophoretic deposition. J Colloid Interface Sei. 2008;328:436-46.
39. Zhang Z, Huang Y, Jiang Z. Electrophoretic deposition forming of SiC-TZP composites in a non-aqueous sol media. J Am Ceram Soc. 1994;77:1946-9.
40. Kavanlouei M, Akbari A. Electrophoretic deposition of titanium nitride coatings. J Am Ceram Soc. 2019;101:3288-98.
41. Fukada Y, Nagarajan N, Mekky W, Bao Y, Kim HS, Nicholson PS.
Electrophoretic deposition-mechanisms, myths and materials. J Mater Sei. 2007;39:787-801.
42. Negishi H, Yanagishita H, Yokokawa H. Proceedings of the elec trochernical society on electrophoretic deposition: fundamentals and applications. 2002;2002(21:):214-21.
How to cite this article: Prioux M, Duluard S, Ansart F, Pujol G, Gomez P, Pin L. Advances in the control of electrophoretic process parameters to tune the ytterbium disilicate coatings microstructure. J Am Ceram Soc. 2020;103:6724-6735. https://doi.org/10.1111/ jace.17365
![FIG URE 2 A, Effects ofl2 addition on electrical conductivity and pH on Yb 2 Sip 7 isopropanol suspension, and (B) the zeta potential versus iodine concentration [Color figure can be viewed at wileyonlinelibrary.com]](https://thumb-eu.123doks.com/thumbv2/123doknet/2940002.79027/5.892.75.818.785.1052/effects-electrical-conductivity-isopropanol-suspension-potential-concentration-wileyonlinelibrary.webp)
![FIGURE 4 Scanning electron microscopy images of the Yl½Si p 7 coatings deposited at U = 100 V from the suspension containing (A) [I:i] = 0 g/L, (B) [I 2 ] = 0.1 g/L, (C) [I:i] = 0.3 g/L, and (D) [I 2 ] = 0.8 g/L, respectively [Color fi](https://thumb-eu.123doks.com/thumbv2/123doknet/2940002.79027/8.892.72.568.66.691/scanning-electron-microscopy-coatings-deposited-suspension-containing-respectively.webp)