HAL Id: hal-01680752
https://hal.archives-ouvertes.fr/hal-01680752
Submitted on 7 Nov 2018
HAL is a multi-disciplinary open access
archive for the deposit and dissemination of
sci-entific research documents, whether they are
pub-lished or not. The documents may come from
teaching and research institutions in France or
abroad, or from public or private research centers.
L’archive ouverte pluridisciplinaire HAL, est
destinée au dépôt et à la diffusion de documents
scientifiques de niveau recherche, publiés ou non,
émanant des établissements d’enseignement et de
recherche français ou étrangers, des laboratoires
publics ou privés.
Analysis of strain stress state in roller compaction
process
Abderrahim Michrafy, Harona Diarra, John A. Dodds, Mohammed Michrafy,
Luc Penazzi
To cite this version:
Abderrahim Michrafy, Harona Diarra, John A. Dodds, Mohammed Michrafy, Luc Penazzi. Analysis
of strain stress state in roller compaction process. Powder Technology, Elsevier, 2011, 208 (2, SI),
pp.417-422. �10.1016/j.powtec.2010.08.037�. �hal-01680752�
Analysis of strain stress state in roller compaction process
A. Michrafy
a,⁎
, H. Diarra
b, J.A. Dodds
a, M. Michrafy
c, L. Penazzi
daRAPSODEE-FRE CNRS 3213, Ecole des Mines d' Albi, Campus Jarlard, 81013 Albi Cedex 09, France
bDepartment ArGenCo: Secteur MS2F, Chemin des Cheuvreuils, 4000 Liège, Belgium
cBEM, Bordeaux Management School, 680 cours de la Libération, 33405 Talence, France
dCROMeP, Ecole des Mines d' Albi, Campus Jarlard, 81013 Albi Cedex 09, France
a b s t r a c t
Keywords: Roll compaction Finite element modeling
The process of drawing and densification of powdered microcrystalline cellulose by roller press in a steady state operation is analyzed using a 2D modeling with the finite element method and the modified Drucker– Prager Cap model as material behavior. Distributions of process variables in contact surface between powder and roller such as pressure, shear stress and relative speed were predicted and used to analyze the basic mechanisms of the transport and the densification of powder between rolls. The results show clearly the existence of three contiguous zones: a phase where the powder is drawn between rolls by a sliding mechanism, a sticking phase where the powder is transported with the same velocity as the roll and where the densification by deforming the powder bed is achieved under the increase of roll pressure that reaches its peak before the neutral angle. The formed compact is then expulsed out of the gap by a slip mechanism resulting from the change of the sign of the shear stress. The predicted density distribution between the rolls, shows a gradual increase. The density reaches its maximum before the neutral point and shows values in agreement with the density of strips prepared with an instrumented roll press. The effect of varying the material parameters on the maximum pressure and the nip angle is also investigated.
Beyond the description of the basic mechanisms of roller compaction, this modeling shows a real potential of the optimization of the roller compaction process.
1. Introduction
The roller compaction process of powders is a process of dry granulation agglomeration of powders. This process is employed in different industries including pharmaceutical, mineral and chemical industries. In the pharmaceutical industry, the process is employed for granulating formulations from mixtures of drug substances and excipient powders to improve flow ability for direct compression. The action of the process leads to modifications of mechanical properties of powders on the particle scale.
The process is based on the transport of powders using a screw feeder which is required for poor flow ability powder mixtures. The powder is then drawn between two counter-rotating rolls in the compaction zone where a high pressure is applied for forming a strip of compacted powder. The formed strip is then milled or stored. Beyond the benefits of this process (continuous, economical and easy to use); it is far from being completely controlled. The difficulty comes mainly from the strong dependence between the process parameters and the properties of powders.
The process of drawing and densification by deforming the powders between rollers involves various complex mechanisms. First, the screw feeding which must achieve a uniform and continuous flow should be synchronous with the speed of the rolls to avoid the sub-feeding or the over-feeding problems[1]. A correlation between the screw and roll velocities is needed to determine the area of the good compaction rate of the press.
To predict the powder behavior between rolls, Johanson [2]
introduced a continuous model. The granular medium was considered compressible, cohesive and could be characterized with the Jenike– Shield yield function [3]. To describe the process by which the granular medium is drawn and compacted between rollers, the Johanson model introduced the concept of the nip angle which defines two contiguous zones. Before the nip angle, the granular medium is transported by relative sliding on the roll, and once the nip angle is achieved, the powder is assumed to be drawn by sticking to the roll surface and to be densified by deforming under the high roll pressure. Following these assumptions, two equations were used for the determination of the nip angle and the pressure distribution in the compaction area. In this model, the granular material is described by the internal friction angle, the wall friction angle and the compress-ibility coefficient. The merit of the Johanson model is to propose a semi-analytic description of the basic properties of a granular material and the rolling process variables. However, this model has limitations
⁎ Corresponding author.
E-mail addresses:michrafy@mines-albi.fr(A. Michrafy),
Harona.Diarra@ulg.ac.be(H. Diarra),dodds@mines-albi.fr(J.A. Dodds),
[4]and shows discrepancies between calculated and measured values for very compressible materials. The basic description of the powder behavior and the “a priori” definition of two zones with two types of properties of contact (slip and stick) to determine the nip angle are the most critical hypothesis. Various modeling approaches used for sheet and plate metal roll forming were adapted for the prediction of the roller compaction of a granular material. A review of some of them was published in[5].
The aim of this work is to study the drawing and densification process of powdered microcrystalline cellulose by roller press using a 2D finite element modeling. The modified Drucker–Prager Cap model is used as material behavior. The distributions of the process variables in contact surface between the powder and the roll are analyzed to gain better understanding of the slip–stick zones and the effect of material parameters on the maximum pressure, the nip angle and the maximum density. A comparison between the predicted and measured variables is discussed.
2. Experimental methods 2.1. Roll press
Experiments were carried out with a Komarek® B050PH labora-tory press with a horizontal feed screw. This press was fitted with 100 mm diameter and 38 mm wide smooth rolls. The roll speed can be varied in the range of 0–7.5 rpm, the feed screw varied in the range of 0–137 rpm and the hydraulic pressure varied up to 50 kN (13.2 kN/ cm).
The upper roll was instrumented with three strain gauges to measure the normal force along the width of the roll. The strain gauges were positioned at 10 mm from the roll surface and are aligned in the direction of the axis (one gauge at the centre and the two others at 5 mm from both sides of the roll). Thus, there is no direct contact of the sensor with the powder. The signals are transmitted to the computer using a slip ring assembly fixed to the press.
2.2. Powder
Microcrystalline cellulose (MCC) known commercially as Avicel PH102, with a mean particle size (d50) of 90 μm, and apparent and
true densities of 270 and 1600 kg/m3, was used in the experiments.
The low cohesion measured using an annular shear tester was 0.5 kPa and corresponded approximately to the density of 500 kg/cm3.
2.3. Characterization of the compaction
Both the roll speed and the roll gap affect the compacted strip density. However, in the roll compaction with horizontal feeding, the screw speed is a dominant parameter that controls the process[1,6,7]. It is then important to determine correlations between the screw and the roll speeds for obtaining compacts with good mechanical properties. In this study, the gap was fixed to 2 mm and a high hydraulic pressure of 34 kN was employed to avoid fluctuations in the thickness of the compacted strip.
To determine the speed conditions used to produce compacted strips and hence their resulting densities, three speed zones were identified which are associated with the under-feeding region where the powder material is not compacted, to the over-feeding zone where the machine becomes blocked, and to the good compaction area. This characterization will not be employed in the simulation presented here. The feeding system will be represented with a feeding pressure and only the roll speed will be considered. However, this characterization gives the operating conditions for the production of a satisfactory strip with the horizontal feeding system.
The process parameters such as roll pressure, nip angle and density of compacted strips are sensitive to the fluctuations of the screw and
the roll speeds. To moderate this effect, the analyzed strips were produced by maintaining substantially constant the ratio of the screw–roll speeds in the good compaction area. By varying the roll speed and keeping the ratio of the screw–roll speed approximately constant, small cubs were cut from the manufactured strips and their densities (mass/volume) were characterized. The result of the averaged density for different strips was plotted inFig. 1according to the roll speed. The density of strips was in the range of 1000– 1200 kg/cm3and shows an increase with the roll speed up to 6 rpm
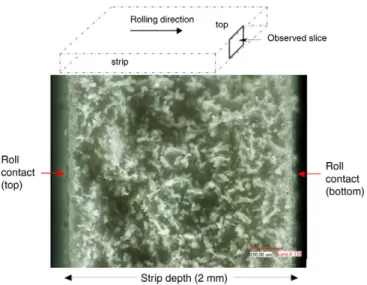
and decreases after. This decrease could be attributed to the time under the maximum pressure. However, the measured bulk density of the strips could not reflect the gradient density in the depth. As in die compaction, the transmitted pressure to the powder is higher in the areas in the contact with the rolls and decreases from the rolls to the middle of the strip. It results in a density gradient in the depth with higher values in the contact zone as it can be observed in the micrograph in Fig. 2 obtained using a numerical microscope from Keyence France.
3. Two-dimensional finite element modeling
Finite element modeling is a method often used in the optimiza-tion and the control of forming processes such as die compacoptimiza-tion[8]
and roller powders compaction[5]. A comparison of various modeling methods applied to roller compaction was published in[5] and it concluded about the advantages of the finite element method over the other methods describing the roller compaction process.
0 0,2 0,4 0,6 0,8 1 1,2 1,4 0 1 2 3 4 5 6 7 8 Roll speed, Vr (rpm)
Fig. 1. Bulk density measurements of strips versus roll speed (gap =2 mm).
Fig. 2. Microstructure of the MCC strip depth (micrograph obtained with numerical microscope — Keyence France).
In the context of this study, the goal is to develop a 2D finite element modeling (plan strain assumption) of roller compaction to examine the development of stress, strain, velocity and density at the contact surface between the roll and the powder in order to gain more understanding of the mechanisms of drawing and densification by deforming the powder between rolls. Also, the effect of the material parameters on the distribution of the process variables is investigated. 3.1. Powder behavior
The analysis of roller compaction was conducted by assuming that the powder behaves as a single phase porous medium (without air) described by the modified Drucker–Prager Cap model implemented in Abaqus®[9]. In the space (p, q) “p: hydrostatic pressure, q: equivalent stress”, the yield surface is essentially represented by the shear surface (shear failure line) and the cap yield surface. The constitutive equations of the model are not listed here and can be found in the references cited above.
The model parameters that have to be identified from the experiments, such as instrumented die compaction, simple compres-sion and diametrical comprescompres-sion, are: elastic properties E and ν, powder cohesion d, internal friction β, the eccentricity of the cap R which corresponds to the curvature of the cap and Pb, the evolution of
the cap surface (hardening function) according to the volumetric inelastic strain. For the MCC powder, these parameters depend on the material density. In the present study, the simulations were conducted using the constant parameters listed inTable 1and with the hardening function Pbplotted inFig. 3. The Drucker–Prager Cap
surface evolution resulting from the above parameters was plotted in
Fig. 4. To incorporate the effect of the variation of material parameters on the results, two parameters considered as potentially influential were examined: Young's modulus E and the cap eccentricity R. Different simulations were conducted to evaluate their impacts on the maximum roll pressure, the nip angle and the maximum density. 3.2. Wall friction
In sheet and plate metal forming, the friction between the piece and the roll is essential for the forming process. For metal powder rolling, Chekmarev et al.[11]measured the shear stress along the arc of contact between the powder and the roll and concluded that the friction could be represented using the Coulomb friction model. In our roll press, no instruments were available to measure the tangential force on the contact interface. To progress in study, the Coulomb
friction was assumed between the rolls and the powder as above and the friction coefficient was therefore characterized in cylindrical geometry from the die compaction experiment.
During die compaction, the tangential force to the contact area (die wall) Ft=(σu−σl)πr2 is proportional to the normal (radial) force
Fr=2πrhσr. This is also the case in metal powder rolling[11]. The
normal pressure is considered uniform along the compact height h. The friction coefficient μ(σr) was then estimated as:
μ σð Þ =r ðσu−σlÞπr 2
2πrhσr ð1Þ
where the height h is obtained from the initial height of the powder bed (10 mm) and the measured punch displacement uuand r = δ2
(δ=11.28 mm) is the internal diameter of the die.Fig. 5shows the evolution of the coefficient of wall friction with the normal (radial) pressure in un-lubricated conditions. As is seen inFig. 5, the friction coefficient decreases down to 0.24 for low radial pressure (b5 MPa) and increases progressively up to 0.35. This limit value was considered in the simulation of the steady state analysis of the rolling compaction. The friction coefficient along the arc between the roll and the powder depends on the pressure and shear stress distributions. Its predicted distribution between rolls will be discussed in comparison with the measured friction coefficient from the work of Chekmarev
[11].
3.3. Numerical procedure
The numerical simulation was performed using commercial software (Abaqus® explicit version 6.7.4). The behavior is assumed to be symmetrical between rollers and only half of the domain was considered. A roll of 100 mm in diameter and 38 mm in width was assumed to be a rigid body and rotates with a speed of 5.6 rpm (0.058 m/s). The domain occupied by the powder was meshed with
Table 1
Material parameters used in the 2D simulation. Young's modulus (MPa) Poisson ratio Initial cohesion (MPa) Internal friction (degree) Eccentricity 5000 0.3 0 65 0.6
Fig. 3. Hardening function Pbversus volumetric inelastic strain.
Fig. 4. Evolution of yield surfaces with relative density (friction angle=65°, initial
cohesion=0, eccentricity =0.6, and PbinFig. 5).
Fig. 5. Wall friction coefficient versus normal pressure (from die compaction experiments).
continuum elements CPE4R with reduced integration for plane strain conditions. The gap was adjusted to 2.0 mm and the entry height of the material corresponds to approximately 20° roll angle. The initial material density was fixed at 0.48·103kg/m3(corresponding to 0.3 of
the relative density).
To address the mesh distortion in the roller compaction problem, the arbitrary Lagrangian–Eulerian (ALE) procedure with adaptive meshing was employed with explicit integration using the Abaqus® Explicit code. The powder feed system was approximated by a uniform feed load (0.1 N which corresponds to a uniform pressure of 0.046 MPa). Eulerian inflow and outflow boundary conditions were employed to ensure the continuously delivered powder to the entry and the free exit of the material. For the computational efficiency of the quasi-static problem, a mass-scaling factor was used and optimized based on the examination of the level of the kinetic energy that must be without oscillations and be small compared to the internal energy. The Coulomb friction was assumed for contact behavior between the roll and the powder. The friction coefficient was μ=0.35.
A rigid surface was created in the feed zone to represent the feeder barrel with a frictionless condition. The presence of this surface avoids the severe distortion of meshes during the feeding.
4. Results and discussions 4.1. Predicted results
For simulations conducted with material parameters listed in
Table 1and the data of the hardening function plotted inFig. 3, the distribution of process variables such as pressure, shear stress, velocity, shear stress–pressure ratio and density at roll–powder contact surface were plotted inFigs. 6–10.
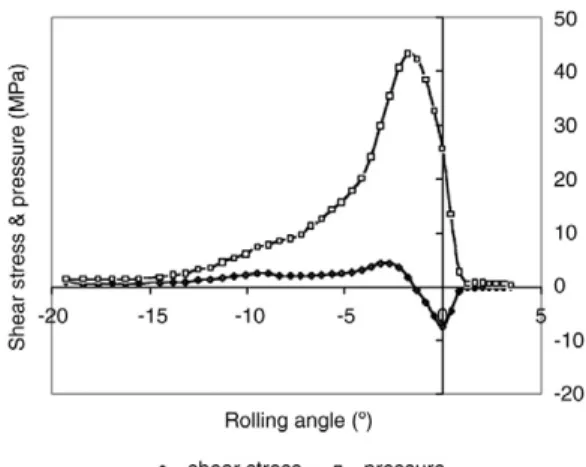
The shape of the predicted pressure plotted in Fig. 6 shows a gradual increase and reaches its maximum at the angle (−1.7°) just before the gap (angle 0°). The corresponding shear stress changes its sign at the angle−1.32° and achieves its maximum at −2.70° and its minimum at−0.01° (before the gap position). The shapes of the shear stress and the pressure are supported by the measurements obtained in[10]and[11]and those obtained by the simulations in[5]. For the determination of the slip–stick zones and the nip angle, the ratio of shear stress over pressure and the linear velocity at the roll–powder contact surface are considered.
Figs. 7 and 8show the velocity of the powder at the roll surface and the shear stress–pressure ratio.
In the context of the Coulomb friction, the shear stress τ and the normal stress σn(known as roll pressure) should verify τ≤μσn.Fig. 8
shows the slip region τbμ σnbetween−20° and −9° and the stick
region τ=μσnbetween−9° and 0°. The angle −9° characterizes here
the transition between the slip and the stick regions as in the Johanson modeling and corresponds to the nip angle. The powder is first drawn by the slip mechanism in the first region and is densified by deforming in the second time in the stick zone. Just after the 0° angle, the shear stress–pressure ratio reaches again the friction coefficient 0.35. This distribution is in agreement with the friction coefficient distribution along the metal/roll contact arc in[11].
The above zones could be also determined from the profile of the powder velocity in the rolling direction (Fig. 7). In the feed zone, the powder velocity is as 0.03 m/s and is uniform in the strip depth because no friction was assumed between the powder and the feeder barrel. From the contact angle with the roll to the nip angle, the
Fig. 6. Distribution of roll pressure and shear stress in the compaction area.
Fig. 7. Velocity in rolling direction versus rolling angle (on the contact surface and on the centreline).
Fig. 8. Shear stress–pressure ratio along the arc of contact between powder and roll.
velocity increases up to the roll speed and presents a vertical gradient that participates in the reorganization of the particles during the flow between rolls and contributes probably to the final density distribu-tion. In the stick region, the powder in contact with the roll flows with the same speed as the roll and the vertical gradient in the strip decreases down to zero at the gap angle. In the ejection phase, the strip is expulsed with a velocity faster than the roll.
Fig. 9shows the density distribution of the meshes in contact with the roll and in the meshes of the centreline. In the slip zone, the density of meshes in contact with the roll is higher than the density at the centreline. This is due to the low pressure applied on the middle line at this region. The maximum of the density is reached before the 0° angle. At this position where the pressure reaches its maximum, the predicted density on the contact zone and on the centreline is identical. This prediction does not reflect the observation of the internal structure shown in micrograph 2. This is a limitation of the model which does not take into account the effect of the air pressure in the powder.
Contour plots of the density in the rolling direction, were represented inFig. 10. The initial material density was at 448 kg/m3
(relative density=0.3). The powder is continuously fed, drawn and densified between the rolls. In the feed zone, the density is constant and is equal to the initial density except in the upper small zone just before the contact with the roller. In this zone a lower pressure is observed and seems to have the same numerical origin as in the fluid flow simulations in the presence of a stair. At the gap position (angle 0°), the predicted density in the strip depth was in the range of 1050– 1110 kg/m3 which presents a good agreement with the measured
bulk density (1000–1200 kg/m3) of compacts prepared using 2 mm of
the gap (Fig. 1).
Predicted process parameters such as pressure, shear stress, nip angle and powder velocity showed profiles in agreement with the measurements in[10,11]and with the numerical simulations in[5]. They give an acceptable image of the drawing and the densification of powders in the roller compaction process as it was proposed in the model of Johanson[2]. However, these predictions depend on the material parameters and feed conditions. In the work of Dec[5], the effects of the feed pressure and friction coefficient on the process parameters were investigated. Additionally to these, we focus here on
the effects of the material rigidity and the eccentricity of the yield surface cap on the process variables.
4.2. Effect of Young's modulus and eccentricity on process variables Simulations by varying material parameters such as Young's modulus E and cap eccentricity R were conducted to examine their effects on the process variables.
The effect of material rigidity on the results was investigated by varying Young's modulus in the range of 0.5–5 GPa and with keeping the other parameters constant (ν=0.3, d=0, β=65°, R=0.6 and Pb
plotted inFig. 5).
In a similar manner, the impact of the eccentricity R on the process variable was examined by varying R in the range of 0.4–1 as shown in
Table 2. The other parameters were given as E=5 GPa, ν=0.3, d=0, β=65° and Pbplotted inFig. 3.
Fig. 11shows the material rigidity on the roll pressure. The major changes introduced by varying Young's modulus concern the maximum roll pressure. The evolution of the maximum pressure according to the rigidity is plotted in the same figure. The maximum pressure evolves as a logarithmic function of the material rigidity. However, no significant changes of the pressure shape were observed. This invariability character of the pressure distribution was demon-strated in the work of Chekmarev[11]where the experimental data obtained by rolling metal powders showed that the pressure distribution does not depend on the type of the metal powder being rolled or the strip width and thickness.
The second material parameter investigated was the eccentricity of the cap yield surface. The cap yield surface has an elliptical shape and the eccentricity of the cap is defined as its curvature. This curvature depends on the material parameters such as the cohesion, the internal friction angle and the hardening function Pb. To simplify
the analysis, the cohesion was considered null and the variation of the eccentricity was made by keeping the same hardening function Pbas it
is shown inFig. 12.
By varying the eccentricity in the range of 0.4–1, effects were observed on the maximum pressure, the nip angle and the maximum
Fig. 10. Contour plots of the density in the powder bed.
Table 2
Effects of eccentricity on the maximum pressure, nip angle and maximum relative density.
Eccentricity (R)
Maximum roll pressure (MPa) Nip angle (degree) Maximum relative density 0.4 120.2 12.39 0.81 0.5 78.79 9.55 0.79 0.6 47.2 9.56 0.76 0.7 31.9 8.99 0.74 0.8 23.3 8.43 0.7 0.9 18.5 7.88 0.68 1 16.17 7.35 0.65
Fig. 11. Effect of the material rigidity on the roll pressure distribution.
density. InTable 2was summarized the predicted values according to the eccentricity. As it can be seen in Fig. 13, the increase of the eccentricity is accompanied by the decrease of the nip angle, the decrease of the maximum pressure and the decrease of the maximum density. These results are consistent and supported by the general observations where the increase of the nip angle (by decreasing the eccentricity or by increasing the wall friction, for example) increases the maximum pressure and the density of the strip. The effects introduced by the variation of the eccentricity demonstrate the importance of accurate material data in the modeling.
5. Conclusion
In this work, it was demonstrated that the mechanisms of drawing and densification by deforming the powder with rolls could be described using modeling based on the finite element method. This approach, which is similar to the modeling used for sheet and plate metal roll forming and where the behavior and feeding process of a powdered material were specified, showed the capabilities to predict the process variables such as roll pressure distribution, shear stress, and nip angle. The predictions are in agreement with the measure-ments and numerical simulations published in the literature. The prediction of the density in the gap zone was in accord with the measured bulk density of strips. However, the behavior of powder is complex and could not be completely described with this modeling, particularly the density gradient in the depth of the strip.
The effects of material parameters such as rigidity and eccentricity of the cap of yield surface on the predictions were analyzed. It could be concluded that the need to obtain accurate material parameters with gradual dependencies with material density and their incorpo-ration in the modeling render this approach more predictive and attractive for the optimization and the control of the process. A perspective of this approach will concern its extension to the 3D in order to examine the observed heterogeneity of properties over the strip width resulting from the effect of the screw feeder. It will be then required to model the feeding system, which is responsible for the heterogeneous behavior of the strip.
Nomenclature σ=(σij) Stress tensor ε=(εij) Strain σr Radial stress p Hydrostatic pressure q Equivalent stress
σn,τ Normal stress and shear stress
Ft,Fr Tangential and radial forces (die compaction)
d,β Cohesion and friction angle of powder E,ν Young's modulus and Poisson ratio
μ Wall friction coefficient
ρ Density
R Cap eccentricity
pb Hydrostatic yield stress
δ Diameter of the die
H Tablet height (die compaction)
References
[1] P. Guigon, O. Simon, Roll press—influence of force feed systems on compaction, Powder Technology 130 (2003) 41–48.
[2] J.R. Johanson, A rolling theory for granular solids, ASME Journal of Applied Mechanics 32 (1965) 842–848 Series E.
[3] A.W. Jenike, R.T. Shield, On the plastic flow of Coulomb solids beyond original failure, Journal of Applied Mechanics, 26, Trans. ASME, (1959) 599–602. [4] K. Sommer, G. Hauser, Flow and compression properties of feed solids for roll-type
presses and extrusion presses, Powder Technology 130 (2003) 272–276. [5] R.T. Dec, A. Zavaliangos, J.C. Cunningham, Comparison of various modeling
methods for analysis of powder compaction in roller press, Powder Technology 130 (2003) 265–271.
[6] Th. Lecompte, P. Doremus, G. Thomas, L. Perier-Camby, Le Thiesse, J.-C. Masteau, L. Debove, Dry granulation of organic powders—dependence of pressure 2D distribution on different process parameters, Chemical Engineering Science 60 (2005) 3933–3940.
[7] H. Diarra, PhD thesis, Université de Toulouse (2008).
[8] P.R. Brewin, 0. Coube, P. Doremus, J.H. Tweed, Modelling of powder die compaction, Springer-Verlag (Eds.), London, (2008).
[9] Hibbit, Karlsson and Sorensson, Inc., Abaqus Theory Manual Version 6.7. [10] K. Schönert, U. Sander, Shear stresses and material slip in high-pressure roller
mills, Powder Technology 122 (2002) 136–144.
[11] A.P. Chekmarev, P.A. Klimenko, G.A. Vinogradov, Investigation of specific pressure, specific friction and the coefficient of friction during metal powder rolling, Soviet Powder Metallurgy and Metal Ceramics (1963) 112–115.
0 2 4 6 8 10 12 14 Eccentricity
Nip angle (degre)
0 20 40 60 80 100 120 140 0 0.4 0.8 1.2 0 0.4 0.8 1.2 Eccentricity
Maximum pressure (MPa)