! ! " #
$%&'
(
) *
!
!
+
,
!
-
!
!
- )
.
+
!
/
0 ! 1 2 3 01 2*
4
0
!
5
6
!
147 30
2 0 ,
847 310 2
9 +
*
(
9 :
;
!
Acknowledgements
All the work presented in this manuscript was co-funded by Syngenta Seeds SA and the Région Midi Pyrénées. This PhD work was also part of the OLEOSOL project funded by French public funds for competitiveness clusters (FUI), the European Regional Development Fund (ERDF), the Government of the Région Midi-Pyrénées, the Departmental Board of Aveyron (France), and the Cities Cluster of Rodez (France). This work was also supported by the French Laboratory of Excellence project "TULIP" (ANR-10-LABX-41; ANR-11-IDEX-0002-02).
All this PhD project benefit from the technical support of the Platform GeT PlaGe from INRA Toulouse and from the help of the common services of the LIPM
More specifically, we deeply thank the Auzeville-Tolosane INRA Experimental Unit, Soltis and Syngenta Seed companies for the field trial implementations described in the chapter II and that allowed the biomarker construction. This work benefited greatly of the help of Loïck Aymard in the greenhouse, field and laboratory parts of the project and Julien Berceron, Valentin Boniface, Kenneth Gamas and Richard Bonnefoy for soil sampling in the field
We also thank Syngenta Seed Company for the field trial implementation described in the chapter III and that permitted the study of the sunflower core collection. We also thank Biogemma and Syngenta Seed companies for the genotyping data described and used in this same chapter III in order to perform the genome-wide association study. A big thank you to the people that helped us to collect leaf samples: David Rengel, Didier Varès, Nicolas Langlade, Elena Garcia Navarro, Eléna Cadic, Stéphane Muños, Marie Thouly, and Samuel Vincourt.
Finally, the work, described in chapter IV related to the systems biology approach and GRN inference, benefited from the support of the Genoscope project AP09/10.
En plus de ces remerciements concernant les financements et les supports techniques qui ont rendu possible la réalisation de ces différentes parties de mon travail de thèse, je souhaiterais remercier plus personnellement certaines personnes qui m’ont permis de mener à bien ce travail.
Je tiens tout d’abord à remercier mes directeurs de thèse, Patrick Vincourt et Nicolas Langlade pour m’avoir encadrée durant ces trois années. Leurs remarques, leurs conseils ainsi que les discussions à propos des résultats des travaux que nous avons menés ensemble et sur la génétique et l’amélioration du tournesol en général, m’ont permis non seulement de finaliser cette thèse mais
aussi d’acquérir (j’espère) la curiosité et l’ouverture d’esprit nécessaire aux chercheurs. Merci également à eux pour leur relecture attentive de ce manuscrit.
Un grand merci également à Baptiste Mayjonade qui a réalisé la quasi-totalité des manips de broyage d’échantillons, d’extraction d’ARN et d’expression de gènes sur lesquelles reposent la majorité des résultats présentés dans ce manuscrit. Je tiens également à le remercier pour son aide lors du phénotypage au champ et pour sa bonne humeur tout au long de ces différents projets.
Un énorme merci aussi à Didier Varès, Marie-Claude Boniface et Nicolas Blanchet pour leur aide précieuse pour la mise en place des expérimentations (serre, champs, chambre de culture) et pour tout leur travail, leur aide et leurs conseils lors des campagnes de phénotypage. Merci également à eux trois, ainsi qu’à Lolita Lorenzon pour leur soutien et encouragements durant ces années de thèse et pour m’avoir toujours remonté le moral au bon moment.
Je tiens à remercier aussi Stéphane Muños et Brigitte Mangin pour leur aide et leur implication dans le projet de génétique d’association. Merci aussi à eux pour leurs conseils avisés en génétique et statistiques.
Merci également à toutes les personnes, outre celles déjà citées, qui au fil de ces années ont partagées mon bureau dans la bonne humeur (et m’ont nourri en chocolat) : Nicolas Pouilly, Amandine Bordat, David Rengel, Yannick Lippi, Elena Cadic, Falah As-Sadi, Quentin Gascuel et Johan Louarn (pour son schéma de tournesol!). Merci aussi à tous les autres membres de l’équipe tournesol qui ont participé à la bonne ambiance général de cette équipe et avec qui j’ai pu partager durant ces trois années.
Je tiens également à remercier tous les membres de mon comité de thèse que je n’ai pas encore pu citer précédemment (Marie Coque, Joël Piquemal, Bénédicte Quilot) pour leur conseils lors de ces étapes clés de ma thèse. En particulier, un grand merci à Matthieu Vignes pour son travail sur l’inférence de réseau et à Philippe Debaeke et Pierre Casadebaig pour leur aide lors du travail sur le biomarqueur. Un merci un peu spécial à Marie Coque qui a été la première à me faire découvrir la génétique du tournesol lorsqu’elle m’a encadrée pendant mon stage de fin d’étude d’ingénieur agro et qui m’a, en tout premier lieu, encouragée à poursuivre en thèse.
Enfin, un grand merci à ma famille qui m’a encouragée durant ces années de thèse. Un merci tout particulier à Pierre Gossart, qui a vécu par procuration cette thèse (y compris les levés à 3h du matin pour les mesures de potentiel hydrique !) ainsi qu’à Matéi Chihaia qui a patiemment relu ce manuscrit pour y faire la chasse aux fautes d’anglais.
Table of Contents
Acknowledgements ... 3
Table of Contents ... 5
List of Figures and Tables ... 9
Abbreviations List ... 12
Chapter I: Introduction ... 15
I.1. Drought issues and challenges of agronomy in a context of global warming ... 15
I.2. Drought stress in plant physiology ... 17
I.3. Plant traits affected by drought stress ... 18
I.3.1. Whole plant scale ... 19
I.3.2. Tissue or cellular scales ... 19
I.4. Drought stress resistance mechanisms ... 20
I.5. Molecular mechanisms and regulatory networks for drought stress responses ... 23
I.5.1. Molecular mechanisms for cell protection during drought stress ... 23
I.5.2. Regulatory networks of drought stress responses ... 24
I.5.3. Generic genes expression pathway during a drought stress event ... 28
I.6. Genotype x Environment interactions during drought stress responses ... 31
I.7. Sunflower and drought stress ... 33
I.7.1. Sunflower crop and interest for drought tolerance breeding ... 33
I.7.2. Sunflower germplasm adapted to various environments with strong drought constrains . 34 I.7.3. Sunflower morphological and physiological responses to drought stress ... 36
I.7.4. Molecular and genetic responses to drought stress in sunflower ... 37
I.8. Objectives of the PhD works: ... 38
Chapter II: The expression of genes possibly involved in the perception of the drought stress signal can help to characterize the plant water status via a biomarker construction ... 41
II.1. Challenges and issues in the studies of genes receptors of the drought environmental signal 41 II.2. Article: A biomarker based on gene expression indicates plant water status in controlled and natural environments ... 43
II.2.1. Abstract ... 43
II.2.2. Keyword index ... 44
II.2.3. Introduction ... 44
II.2.4. Material and methods ... 46
II.2.4.1. Plant material and growing conditions ... 46
II.2.4.2. Estimation of the fraction of transpirable soil water (FTSW) in the greenhouse experiment ... 48
II.2.4.4. Estimation of the fraction of total soil water (FtotSW) in the greenhouse experiment
... 49
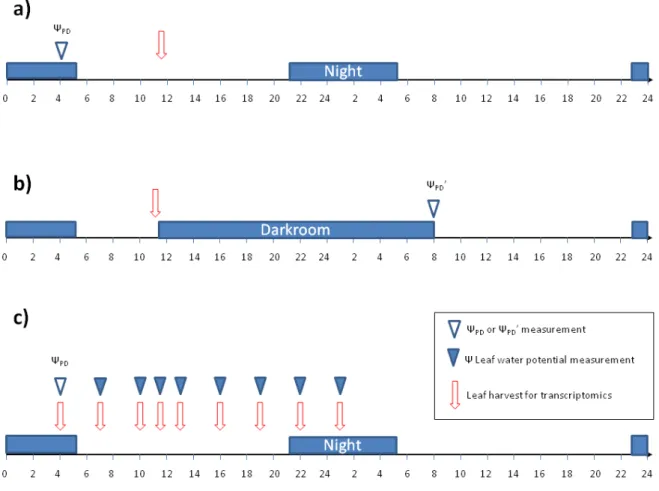
II.2.4.5. Measurement of leaf water potential (Ψ) in greenhouse and field experiments ... 49
II.2.4.6. Transcriptomic analysis ... 51
II.2.4.7. Statistical analysis ... 52
II.2.4.8. Genes with Genotype*WSB interaction ... 54
II.2.5. Results ... 54
II.2.5.1. Greenhouse results ... 54
II.2.5.2. Construction of Generalized Linear Models to estimate plant water status ... 58
II.2.5.3. Use of the Water Status Biomarker ... 63
II.2.6. Discussion ... 65
II.2.6.1. Description of the three genes selected for the water status biomarker ... 65
II.2.6.2. Comparison between the WSB and classical water status indicators ... 66
II.2.6.3. Advantage of WSB over environmental data ... 66
II.2.6.4. WSB genes and environmental signal integration ... 67
II.2.6.5. Validity of the WSB ... 67
II.2.6.6. Use of the WSB ... 68
II.2.7. Conclusions ... 70
II.3. Conclusion and outlooks regarding the Water Status Biomarker ... 71
II.4. Discussion about genes receptor of the environmental signal ... 72
Chapter III: Linking complex morpho-physiological traits involved in drought tolerance to the underlying genomic loci. Reconstruction of a regulatory network through a genome wide association study of gene expression levels. ... 75
III.1. Deciphering the genetic control of complex traits: Quantitative Trait Locus (QTL) analyses or association studies. ... 75
III.2 Association studies in sunflower ... 80
III.2.1 Three association mapping researches on sunflower ... 80
III.2.2 Association panel used and described in the work of Cadic et al., 2013 ... 81
III.3 Issues and challenges in the study of genes correlated to water stress responses ... 84
III.4. Article: Integration of the environment in gene regulatory networks. Identification of plastic regulations in the case of drought stress in sunflower via an association study on gene expression. ... 85
III.4.1.Abstract ... 85
III.4.2. Authors summary ... 86
III.4.3. Introduction ... 86
III.4.4. Results ... 88
III.4.4.1. Estimation of drought stress perceived by each genotype in the association panel .. 88
III.4.4.2. Selection of genes reporting drought responses ... 91
III.4.4.4. Association mapping ... 92
III.4.4.5. QTL detection and identification of cis- and trans-regulations ... 96
III.4.4.6. Comparison of genotypic effect between G and GE models ... 100
III.4.4.7. Building a gene regulatory network ... 100
III.4.4.8. Association to the Water Status Biomarker WSBΨPD ... 102
III.4.5. Discussion ... 102
III.4.5.1. Sunflower controls water status of its micro-environment ... 102
III.4.5.2. Identification of plasticity QTL thanks to the G and GE models ... 103
III.4.6. Materials and Methods ... 107
III.4.6.1. Plant material ... 107
III.4.6.2. Tissue harvest and RNA extraction ... 107
III.4.6.3. Gene expression quantification by qRT-PCR ... 107
III.4.6.4. Two models to analyze gene expression data ... 108
III.4.6.5. Genotyping of the association panel ... 109
III.4.6.6. Association analyses ... 109
III.4.6.7. G and GE models comparison ... 110
III.4.6.8. Building genetic maps ... 110
III.4.6.9. SNP mapping by Linkage Desequilibrium ... 111
III.4.6.10. SNP mapping using marker context-sequence alignment ... 111
III.4.6.11. Genes mapping ... 112
III.4.6.12. QTL definition from the association results ... 112
III.5 Conclusion and outlook concerning eQTL detection with gene correlated to drought responses ... 113
III.5.1 Genes grouped in regulatory pathways for two drought tolerance traits ... 113
III.5.2 Utilization of the Water Status Biomarker ... 113
III.5.3 Association study with an association panel using hybrids: advantages and drawbacks . 114 III.5.4 Expending the study to the whole sunflower transcriptome ... 115
III.6 Discussion about drought responsive genes correlated to traits of drought stress tolerance 115 III.6.1 Attempt in the distinction between the genetically-variable part of plasticity and the genotype-constitutive response to drought ... 115
III.6.2 Genotypic control of the plants micro-environment ... 116
Chapter IV: Drought Gene Regulatory Network and implication in the evolution of Helianthus annuus and its relatives, a systems biology approach. ... 119
IV.1 Brief overview of systems biology approach ... 120
IV.2 Main goals in the study of gene regulatory network ... 121
IV.3 Article: Bridging physiological and evolutionary time scales in a gene regulatory network ... 122
IV.3.1. Summary ... 123
IV.3.2. Keywords ... 123
IV.3.4. Material and methods ... 125
IV.3.4.1. Plant Material and growth conditions ... 125
IV.3.4.2. Gene selection ... 126
IV.3.4.3. Molecular analysis ... 126
IV.3.4.4. Genetic differentiation among populations ... 127
IV.3.4.5. GRN reconstruction ... 127
IV.3.4.6. Topological parameters ... 128
IV.3.4.7. Correlation between topological parameters and genetic differentiation... 129
IV.3.5. Results ... 129
IV.3.5.1. Gene selection to infer the drought GRN ... 129
IV.3.5.2. Inference of the drought GRN from the GGM and RF methods ... 132
IV.3.5.3.Node connectivity defines different gene classes ... 136
IV.3.5.4.Canonical correlations between the topological parameters of the drought GRN and genetic differentiation statistics ... 138
IV.3.6. Discussion ... 140
IV.3.6.1. Network inference highlights the importance of nitrate transport in guard cells .... 141
IV.3.6.2. Drought GRN topology and Helianthus evolution ... 144
IV.4 Main conclusions about the drought GRN and transcription regulation ... 148
IV.5 Outlooks for the drought GRN study ... 148
IV.5.1 Functional characterization of the inferred drought GRN ... 148
IV.5.2 Toward a more complete systems biology study... 149
IV.6 Conclusions and outlooks about Helianthus evolution study thanks to GRN ... 150
Chapter V: Conclusions and perspectives ... 153
V.1. A more complex picture of the genetic control of drought stress responses ... 153
V.1.1. Genes involved in the perception of the drought signal and cross-talk between the plant and its environment ... 153
V.1.2. Existence of feedback loops between regulatory genes and effectors genes ... 155
V.1.3. Genetic architecture of genes underlying morphological and physiological traits conferring drought tolerance ... 157
V.1.4. From a “simple” gene cascade to a more complex picture of the drought gene regulatory network ... 157
V.1.5. Limits of our approach and future perspectives ... 158
V.2. From physiological acclimation of a genotype to the species evolution and adaptation ... 158
V.3. Perspectives of utilization in a crop model ... 159
References ... 161
List of Figures and Tables
Figure I.1: Projections of rainfall and sunflower yield for the Mediterranean Basin. ... 16
Figure I.2: Principal components of the evapotranspiration ... 18
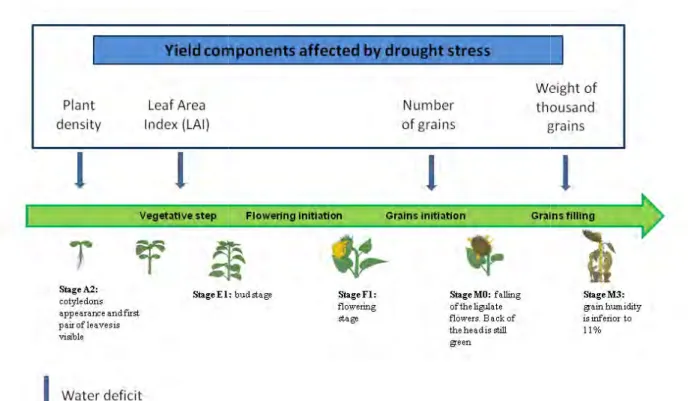
Figure I.3: Whole-plant level traits affected by water deficit and leading to yield losses under water deficit ... 19
Figure I.4: Morphological and phenological responses to drought stress involved in the escape, avoidance, and phenotypic plasticity strategies ... 21
Figure I.5: Physiological mechanisms for drought tolerance ... 22
Figure I.6: Four regulatory pathways for drought responsive genes. ... 27
Figure I.7: Generic pathways for plant responses to drought stress ... 30
Figure I.8: Reaction norm plots for various patterns of phenotypic plasticity ... 31
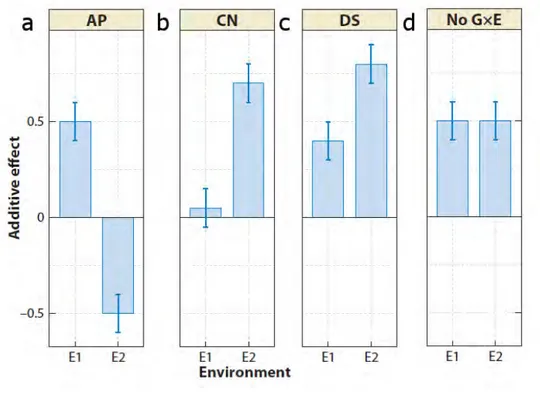
Figure I.9: Patterns of quantitative trait loci additive effects for trait that show genotype x environment interactions (GxE) can fall into four main categories ... 33
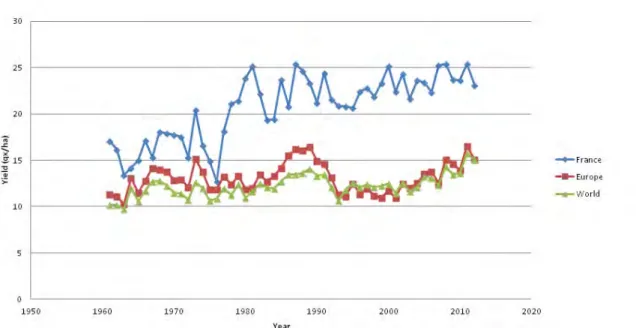
Figure I.10: Evolution of sunflower yield since 1961 to 2012 ... 34
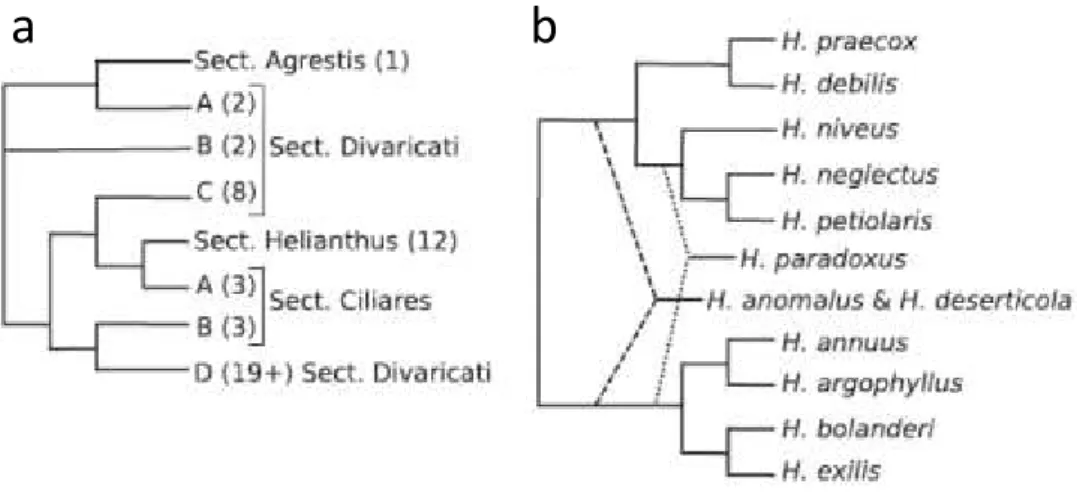
Figure I.11: Phylogenetic trees for Helianthus ... 35
Figure II.1: Genes studied for the water status biomarker construction and hypothesis about their gene expression independent of the genotype. ... 42
Figure II.2: Sampling and leaf water potential measurements timing. ... 50
Figure II.3: Comparison ln(-ΨPD ) with biomarker prediction of ln(- ΨPD ) for the four best models. ... 53
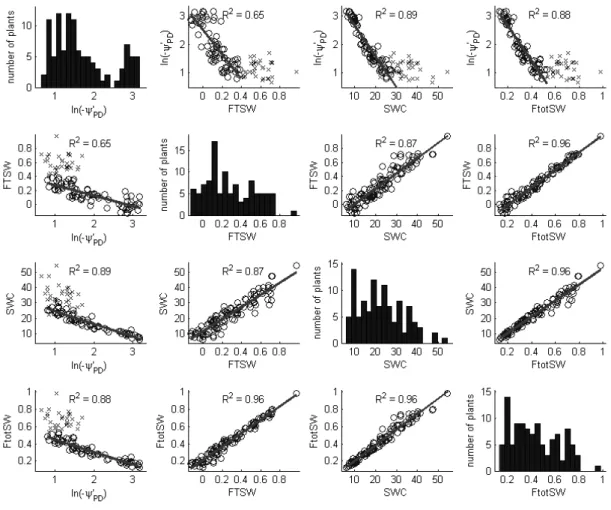
Figure II.4: The distributions and correlations between the four water status indicators measured in the greenhouse experiment ... 55
Table II.1: The number of genes correlated (p<0.01) to each water deprivation indicator and genotype effects to be used in gene combinations for biomarker fitting. ... 56
Figure II.5: A schematic description of the water status biomarker construction. ... 57
Table II.2: The range of adjusted R² and RMSEc for the 50 best linear models with 3, 4, 5 and 6 genes fitting the ΨPD' in the greenhouse experiment. ... 58
Table II.3: Soil analyses. AUZ: Auzeville; FLE: Fleurance; SAM: Samatan. ... 59
Figure II.6: Correlations between corrected field data ln(-ΨPD’) and predicted ln(-ΨPD’) ... 60
Figure II.7: Diurnal variation of biomarker genes expression and correction efficiency for biomarker prediction from samples harvested at different times of the day. ... 62
Figure II.8: Kinetic curves of circadian genes expressions during 24 hours. ... 63
Table II.5: Results of covariance analysis for five selected genes. ... 64
Figure II.9: Gene expression showing genotype*WSB interactions in ANCOVA study (p<0.05). ... 65
Figure II.10: Localization of WSB genes and hypothesis of two regulatory cascades for drought stress responses regarding genotype dependency of the gene expressions. ... 74
Table III.1: Mechanisms that influence LD level and decay ... 76
Figure III.1: Schematic comparison of linkage analysis and association mapping ... 77
Figure III.2: Schematic diagram of genome-wide association mapping. ... 78
Figure III.3: Crossing scheme to produce multi-parent advanced generation inter-cross (MAGIC) population ... 80
Figure III.4: Distribution of LD decay across chromosomes for the entire panel and for each breeding pool ... 81
Figure III.5: Structure of the association panel used in Cadic et al., 2013. ... Erreur ! Signet non défini. Figure III.6: Genes studied for their response to drought stress and inducing morpho-physiological response to water deficit. ... 83
Figure III.7: Variability of the water status perceived by the genotypes in the field trial ... 90
Figure III.8: G and GE models explanation. ... 92
Table III.2: Summary of associations and QTL detected ... 95
Figure III.9: Manhattan plot representing FDR adjusted p-values for the association between gene expression levels corrected or not by the environment and mapped SNPs. ... 97
Figure III.10: Distribution of p-values adjusted by FDR of cis- and trans-regulations. ... 99
Figure III.11: Gene regulatory network for drought responses reconstructed from associations for gene expression levels corrected or not for the environment. ... 101
Figure III.12: Results about genes correlated to morphological and physiological traits for drought tolerance. ... 117
Figure IV.1: Genes studied are involved in transcription regulation and functional responses in the generic cascade induced by water deficit. ... 119
Figure IV.2: Selection of genes likely to be involved in the drought GRN. ... 131
Figure IV.3: Drought GRN and selection of its edges. ... 133
Table IV.1: Number of edges detected for each hormone ... 134
Figure IV.4: Origin of the selection for the inferred genes of the drought GRN. ... 135
Figure IV.5:Degree distribution ... 136
Figure IV.6:Percentage of genes within the drought GRN in each class of gene connectivity, with the GO representation in each class indicated by different colored bars. ... 137
Table IV.2: Results of the Principal Component Analysis on the topological parameters for the drought GRN: standard deviation and proportion of cumulative variance of components ... 138
Figure IV.7: Bi-plot of the effects of the topological parameters in a Principal Component Analysis. 139 Table IV.3: Coefficients of canonical correlations ... 140 Figure IV.8: Functional network involving the two hubs of the inferred drought GRN, their sources, and their targets. ... Erreur ! Signet non défini. Figure IV.9: Representation of genetic differentiation between H. annuus Landraces and H. annuus Elite Lines in function of the gene positions in a schematic gene regulatory network. ... 146 Figure IV.10: Two gene regulatory cascades for drought stress responses in different helianthus annuus species. ... 151 Figure V.1: Generic cascade of genes involved in drought stress responses with a summary of all results pointed out throughout the PhD work. ... Erreur ! Signet non défini. Figure V.2. Functional schema of the crop model SUNFLO. ... 160
Abbreviations List
ABA: abscisic acid ABF: ABRE-binding factor ABRE: ABA-responsive element ACC: Ethylene
ANCOVA: Analysis of Covariance ANOVA: Analysis of variance ASPL: Average shortest path length BLAST: Basic Local Alignment Search Tool BLUP: Best Linear Unbiased Predictors Brass: Brassinol
CCA: Canonical correlation analysis CDPK: Calcium dependent protein kinases CETIOM: Centre technique Interprofessionnel
des Oleagineux
CID: Carbon isotopic discrimination CMS: cytoplasmic male sterility
CNRS: Centre National de Recherche Scientifique
Ct: Threshold Cycle
DNA: Deoxyribonucleic acid E: Transpiration
EN: Normalized transpiration eQTL: Expression QTL
ERF: ethylene-responsive element binding
factor
EST: Expressed Sequence Tag ET: Evapotranspiration
ET0: reference evapotranspiration
ETM: Maximal crop evapotranspiration
FAO: Food and Agriculture Organization FtotSW: Fraction of Total Soil Water
FTSW: Fraction of Transpirable Soil Water GA3: Gibberellic acid
GGM: Gaussian graphical model GO: Gene ontology
GRN: gene regulatory network
GWAS: Genome wide association study GxE: Genotype x environment
IAA: Auxine
INRA: Institut National de Recherche Agronomique
IPCC: Intergovernmental Panel on Climate
Change
ITW: Integrated Transpired Water LAI: Leaf Area Index
LD: Linkage disequilibrium LEA: Late Embryogenic Abundant LG: Linkage group
MAF: Minor allele frequency
MAGIC: Multiparent Advenced Generation
Inter-Cross
MAPK: Mitogen activated protein kinase MeJA: Methyl Jasmonate
NAM: Nested association mapping OP: Osmotic potential
ORF: Open Reading Frame
PCA: Principal component analysis
q-RT-PCR: Quantitative Real Time Polymerase
Chain Reaction
QTL: Quantitative Trait Locus RF: Random Forest
RMSE: Root Mean Square Error RNA: Ribonucleic acid
ROS: Reactive oxidative species RWC: Relative water content SA: Salicylic acid
SLA: Specific Leaf Area
SNP: Single Nucleotide Polymorphism Stri : Strigolactone
SWC: Soil Water Content
TAIR: The Arabidopsis Information Resource TLA: Total Leaf Area
TTSW: Total Transpirable Soil Water WD: Water deprived
WSB: Water Status Biomarker WUE: Water Use Efficiency
Chapter I: Introduction
I.1. Drought issues and challenges of agronomy in a context of global
warming
In 2013, the Food and Agriculture Organization (FAO) estimated that 842 million people (around one in eight people in the world) suffer from chronic hunger (report 40 of the Committee on world Food Security, 2013). Increase of demography has for consequences that food demand and therefore risks of hunger will also rise. Moreover, climate change will also affect at least two dimensions of the food security i.e availability and stability. Indeed, global climate change not only involves temperature increase and precipitation diminution, which lead to changes in land suitability and crop yield but also increases in the frequency and severity of extreme events such as droughts (Schmidhuber & Tubiello, 2007). Drought is one of the most important constraints to plant productivity (Farooq et al., 2009). Hence, increasing population pressures and climate change is likely to emphasize the effects of drought (Somerville & Briscoe, 2001).
Depending on the climatic scenario studied by the Intergovernmental Panel on Climate Change (IPCC), the number of people at risk of hunger in the world in 2080 would increase by 5 to 26% due to climate change (Schmidhuber & Tubiello, 2007).
Moriondo et al., (2010) projected a scenario of European agriculture in +2°C (above pre-industrial levels) world in order to estimate potential effects of climate change and variability on crop production in this region. With this scenario, in the area of the Mediterranean basin, the summer period is projected to exhibit a rainfall decrease up to 35% (Figure I.1.A) and an increase of higher temperatures implying more frequent drought stress events. These changes in average climate and climate variability would affect yields according to crop type and geographical areas. Some northern regions are expected to benefit from this average increase of temperature; however, southern zones could largely suffer of the impact of climate change. For example, sunflower crop in the Mediterranean basin, in the period 2071-2100, is expected to have a yield reduced by 13% in average with respect to the baseline 1961-1990. Depending on the scenario for future climate defined by the IPCC (A2: medium-high greenhouse gases emission and B2: low-medium greenhouse gases emission) this loss of yield could rise to 35% (Figure I.1.B) due in particular to higher drought stress frequency at anthesis (Moriondo et al., 2011).
Figure I.1: Projections of rainfall and sunflower yield for the
(a) Projection of rainfall changes in levels) world (Moriondo et al., 2010)
and B2 scenarios (2071-2100) with respect to the baseline period (1961 considered not suitable for cultivation
1: Projections of rainfall and sunflower yield for the Mediterranean Basin
ion of rainfall changes in a scenario of European agriculture in +2°C (above pre
, 2010). (b) Projection of the average change in sunflower yield in A2 2100) with respect to the baseline period (1961-1990). Grey areas are d not suitable for cultivation (Moriondo et al., 2011).
Basin.
a scenario of European agriculture in +2°C (above pre-industrial of the average change in sunflower yield in A2 1990). Grey areas are
Therefore, many efforts have been made to improve crop productivity under water-limiting conditions. The negative impacts of drought stress on yield have been reduced thanks to, firstly better crop management and secondly breeding activities. However, there is still a large gap between yields in optimal and in water stress conditions (Cattivelli et al., 2008). For instance for sunflower crops in France, potential of production due to genetic gain increases regularly since 1970 at the rate of 1.3% per year (Vear et al., 2003). However, while the potential sunflower yield can reach 40 qx/ha, the actual average yield in 2012 was 23 qx/ha in France and only 15 qx/ha in Europe (FAOstat, 2014). In this context, selection of drought tolerant varieties remains an important goal for breeders and is of strategic importance to minimize hunger risks for the future. In order to achieve this goal, a better understanding of plant drought stress responses is necessary at physiological, molecular and genetic levels.
I.2. Drought stress in plant physiology
Soil water is used by plants during their development to transport nutrients and to produce biomass through the mechanism of photosynthesis. However, plants lack the capacity to perform photosynthesis without water losses. Therefore, depending on the species, the variety and the environmental conditions, their water use efficiency (WUE), i.e the ratio of CO2 assimilation or biomass accumulation to water losses, varies. For example, sunflower and soybean have been shown to have a WUE of 54 and 30kg.ha-1.cm-1 respectively (Anderson et al., 2003). Plants lose water through the phenomenon of the evapotranspiration (ET). This last one, for crops, takes into account water evaporation at soil and leaf surfaces and also transpiration of free water in plant tissues through stomata (Figure I.2). Evapotranspiration is dependent on climatic and environmental conditions such as the evaporative demand of the atmosphere as well as on plant characteristics. The part of the evapotranspiration due to weather conditions (radiation, air temperature, humidity and wind speed) is called reference evapotranspiration ET0 and can be calculated with the Peinman-Monteith equation (Peinman-Monteith, 1965). Evapotranspiration of a crop can be estimated from ET0 to which cultural and stress coefficients are applied in order to take into account plant characteristics and crop management that influence evapotranspiration (Figure I.2). Indeed, water demand of a crop will vary depending on the crop species, variety, and phenological stage. Maximal crop evapotranspiration (ETM) evaluates these plant characteristics and refers to the evaporating demand of a crop that grows in large fields under optimum soil water, excellent management, and environmental conditions, and that achieves full production under the given climatic conditions (FAO, Irrigation and drainage paper 56). Moreover, plant physiology and crop management factors
such as soil salinity, fertilizers application content affect the crop development and
Therefore, adopting an eco
difference between the soil water available for the plant and water losses due to evapotranspiration (Tardieu & Tuberosa, 2010). Drought stress
occurs (i.e if the water losses are m
this definition of drought stress is not only dependent precipitation frequency, evaporativ
characteristics.
Figure I.2: Principal components of the evapotranspiration (adapted from drainage paper 56)
ET0: reference evapotranspiration; cultural coefficient; ks: stress coefficient;
I.3. Plant traits affected by drought stress
Drought stress affects the plant at different levels: morphological, physiological molecular. Moreover, it can occur
on crop yield. In the following sections, we will
fertilizers application, penetrability of soil horizon, diseases contro the crop development and therefore the real evapotranspiration (ET)
Therefore, adopting an eco-physiological point of view, water status can be defined as the soil water available for the plant and water losses due to evapotranspiration
Drought stress is perceived by the plant when an important occurs (i.e if the water losses are more important than the soil water availability)
his definition of drought stress is not only dependent on the environmental conditions precipitation frequency, evaporative demand or amount of available soil water but also on pla
2: Principal components of the evapotranspiration (adapted from
: reference evapotranspiration; ETM: maximal evapotranspiration; ET: real evapotranspiration; : stress coefficient;
Plant traits affected by drought stress
Drought stress affects the plant at different levels: morphological, physiological occur at all the phenological stages of the crop and
on crop yield. In the following sections, we will broach the different plant traits affected by drought. diseases control or soil water
(ET).
can be defined as the soil water available for the plant and water losses due to evapotranspiration an important water deficit ore important than the soil water availability). Most importantly, the environmental conditions such as le soil water but also on plant
2: Principal components of the evapotranspiration (adapted from FAO Irrigation and
evapotranspiration; kc:
Drought stress affects the plant at different levels: morphological, physiological, and at all the phenological stages of the crop and have a final impact broach the different plant traits affected by drought.
I.3.1. Whole plant scale
At the whole plant scale
stage of the crop. At the early stage, drought affects stages, it reduces plant growth, increase
reduce leaf area. During reproductive stages, grain germination rate, grains initiation
is why many drought-induced yield reductions have been reported in though it depends upon the severity and duration of the stress period
example, in sunflower a drought stress during the reproductive stage can lead to a yield reduction of 60% (Farooq et al., 2009).
Figure I.3: Whole-plant level traits affected by water deficit and leading to yield losses under water deficit (adapted from CETIOM).
I.3.2. Tissue or cellular
scalesUnderlying morphological traits or whole plant level traits several physiological processes observ
During drought stress, changes
modifications of relative water content, leaf water potential, stomatal resistance, or canopy temperature (Farooq
scale, drought stress affects different traits according to the phenological stage, drought affects seed germination. Later, during
increases leaf wilting and senescence. All these phenomena reduce leaf area. During reproductive stages, grain initiation and filling can be impacted.
initiation and filling are directly correlated to the crop yield induced yield reductions have been reported in several it depends upon the severity and duration of the stress period (Farooq
example, in sunflower a drought stress during the reproductive stage can lead to a yield reduction of
plant level traits affected by water deficit and leading to yield losses under water
scales
orphological traits or whole plant level traits affected by drought, there are observable at tissue or cellular scales.
During drought stress, changes appear in plant water relationships. They are consequences of relative water content, leaf water potential, stomatal resistance,
(Farooq et al., 2009). Therefore the tissue and cellular water
, drought stress affects different traits according to the phenological seed germination. Later, during the vegetative phenomena lead to a and filling can be impacted. Moreover, and filling are directly correlated to the crop yield (Figure I.3). That several crop species even (Farooq et al., 2009). For example, in sunflower a drought stress during the reproductive stage can lead to a yield reduction of
plant level traits affected by water deficit and leading to yield losses under water
affected by drought, there are
are consequences of relative water content, leaf water potential, stomatal resistance, transpiration rate Therefore the tissue and cellular water statuses in
leaves are affected during drought. It can lead to a loss of turgor and therefore to a diminution of the growth and to an increase of leaves wilting described at the whole plant level (Taiz & Zeiger, 2006). Another point is that decreasing water availability under drought generally results in limited total nutrient uptake. Therefore nutrient tissue concentrations diminish. Even though plant species and genotypes may vary in their responses to mineral uptake under water stress, in general, it induces an increase in nitrate, a decline in phosphate and no clear effects on potassium (Garg et al., 2004). Moreover, the nutrient utilization efficiency is also lower under drought stress (Farooq et al., 2009).
During drought stress, the photosynthesis is affected too. Several factors are in cause in this loss of photosynthetic activity: decrease in leaf expansion and premature leaf senescence, stomatal oscillations (Mansfield et al., 1990) and decline in photosynthetic enzymes activity (Bota et al., 2004) (Loreto et al., 1995).
Respiration is also increased during a drought event. One of the consequences to this respiration rate augmentation is the imbalance in the utilization of carbon resources (Farooq et al., 2009).
All together, limitation in nutrient utilization efficiency, decrease in photosynthetic activity and augmentation of the respiration rate can lead to a decrease in biomass production and changes in assimilate partitioning. For example, drought stress frequently enhances allocation of dry matter to the roots (Leport et al., 2006). This phenomenon can lead to the limitation in grain initiation and filling observed at the whole plant level (Asch et al., 2005).
Finally, as other abiotic stresses, drought leads to the production of reactive oxygen species. They can cause oxidative damage and prevent the normal functioning of the cells (Foyer & Fletcher, 2001).
I.4. Drought stress resistance mechanisms
To cope with drought stress, plants develop mechanisms and defense strategies to prevent water deficit and maintain their ability to grow, flower, and produce seeds that are commonly the main valuable production in crops. However, economic yield can be dramatically affected by a deficit in water supply conditions (Chaves & Oliveira, 2004).
A first strategy to deal with water deficit is referred as the escape strategy. Drought escape occurs when phenological development is successfully altered to match with the periods of soil moisture availability (Araus et al., 2002). Therefore tolerance to cold during the early stages, flowering time and length of life cycle appear as key traits that can lead to drought escape. However, yield is generally correlated with the length of crop duration under favorable growing conditions
(Turner et al., 2001). This is why, yield.
A second strategy to cope with water stress is the
tend to maintain high tissue water potential through different mechanisms. At one end of the water flux, there is the increase of the water uptake through an extensive and more efficient root system. At the other end of the flux, there
to reduce the transpiration rate.
Finally, plants can develop a range of mechanisms involving water deficit: the phenotype of the plant will be modified and then yield crop under drought stress.
preventing the water deficit events (inte to a strategy of adaptation. The strategy of
physiological mechanisms. For example morphological mechanisms, under drought stress, lead som plants to reduce their leaf area by leaf shedding
transpiration. Figure I.4 shows morphological and phenological mechanisms that lead to drought tolerance.
Figure I.4: Morphological and phenological avoidance, and phenotypic plasticity strategies
, a strategy as the escape can also lead to a reduction of the potential
A second strategy to cope with water stress is the avoidance. Plants that follow this strategy end to maintain high tissue water potential through different mechanisms. At one end of the water
is the increase of the water uptake through an extensive and more efficient root system. there are a small leaf area and the control of the stomatal conductance
. Both of these mechanisms help avoid water losses Finally, plants can develop a range of mechanisms involving phenotypic plasticity water deficit: the phenotype of the plant will be modified and then increase its ability yield crop under drought stress. In contrast to the first two strategies described above
preventing the water deficit events (intensity, duration and frequency), this last strategy corresponds The strategy of phenotypic plasticity includes both
physiological mechanisms. For example morphological mechanisms, under drought stress, lead som plants to reduce their leaf area by leaf shedding (Farooq et al., 2009) in order to limit plant
Figure I.4 shows morphological and phenological mechanisms that lead to drought
4: Morphological and phenological responses to drought stress involved in the escape, and phenotypic plasticity strategies (Adapted from CETIOM). LAI: Leaf Area Index
can also lead to a reduction of the potential
. Plants that follow this strategy end to maintain high tissue water potential through different mechanisms. At one end of the water is the increase of the water uptake through an extensive and more efficient root system. the control of the stomatal conductance
avoid water losses
phenotypic plasticity to adapt to
increase its ability to maintain two strategies described above that aim at nsity, duration and frequency), this last strategy corresponds both morphological and physiological mechanisms. For example morphological mechanisms, under drought stress, lead some in order to limit plant Figure I.4 shows morphological and phenological mechanisms that lead to drought
responses to drought stress involved in the escape,
At the physiological level, several mechanisms occur to produce Osmotic adjustment is one of the
injuries by maintaining high cell water potential through active accumulation of solutes in the cytoplasm (Turner et al., 2001). It delays damage due to dehydration through the maintenance of cell turgor and physiological cell processes
help prevent drought damages in the cell. The reactive oxygen species in plants are removed by a large range of antioxidant enzymes, lipid
et al., 2000). This includes β-carotenes, ascorbic ac
enzymatic antioxidant molecules and peroxide dismutase, peroxidase, catalase and glutathione reductase for the enzymatic compartment. Finally, it is generally accepted that the maintenance of cell membrane integrity and stability under a water st
at the cellular level (Bajji et al., 2002)
understood, it increases the chances of protein denaturation and membrane fusion due to molecular interactions (Farooq et al., 2009)
effects of membrane disruption as for example, proline, glutamate, glycinebetaine, polyols, trehalose and oligosaccharides (Hoekstra et al.
drought tolerance through a phenotypic plasticity
Figure I.5: Physiological mechanisms for drought tolerance
catalase, APX: ascorbate peroxydase; AA: ascorbic acid; GR: gluthatione reductase (adapted from Farooq et al., 2009).
At the physiological level, several mechanisms occur to produce phenotype plasticity one of these mechanisms that may confer tolerance against cell drought injuries by maintaining high cell water potential through active accumulation of solutes in the It delays damage due to dehydration through the maintenance of cell processes (Taiz & Zeiger, 2006). In a similar way, antioxidant defenses help prevent drought damages in the cell. The reactive oxygen species in plants are removed by a
zymes, lipid-soluble and water soluble scavenging molecules carotenes, ascorbic acid, α-tocopherol, reduced glutathione fo
enzymatic antioxidant molecules and peroxide dismutase, peroxidase, catalase and glutathione reductase for the enzymatic compartment. Finally, it is generally accepted that the maintenance of cell membrane integrity and stability under a water stress is a major component of drought tolerance , 2002). Although the causes of membrane disruption are not well understood, it increases the chances of protein denaturation and membrane fusion due to molecular
, 2009). A range of compounds have been identified that
effects of membrane disruption as for example, proline, glutamate, glycinebetaine, polyols, trehalose
et al., 2001). Figure I.5 illustrates physiological mech phenotypic plasticity at the cell level.
5: Physiological mechanisms for drought tolerance. SOD: superoxide dismutase; CAT:
catalase, APX: ascorbate peroxydase; AA: ascorbic acid; GR: gluthatione reductase (adapted from
phenotype plasticity.
mechanisms that may confer tolerance against cell drought injuries by maintaining high cell water potential through active accumulation of solutes in the It delays damage due to dehydration through the maintenance of cell a similar way, antioxidant defenses help prevent drought damages in the cell. The reactive oxygen species in plants are removed by a molecules (Hasegawa tocopherol, reduced glutathione for the non-enzymatic antioxidant molecules and peroxide dismutase, peroxidase, catalase and glutathione reductase for the enzymatic compartment. Finally, it is generally accepted that the maintenance of ress is a major component of drought tolerance causes of membrane disruption are not well understood, it increases the chances of protein denaturation and membrane fusion due to molecular of compounds have been identified that can prevent the effects of membrane disruption as for example, proline, glutamate, glycinebetaine, polyols, trehalose I.5 illustrates physiological mechanisms leading to
SOD: superoxide dismutase; CAT: catalase, APX: ascorbate peroxydase; AA: ascorbic acid; GR: gluthatione reductase (adapted from
To conclude about the strategy of phenotypic plasticity, plants can tolerate drought stress by developing physiological and morphological mechanisms that aimed at the conservation of cell and tissue water by reducing water losses by transpiration reduction, osmotic adjustment, scavenging of reactive species, and keeping the cell membrane stabilized (Farooq et al., 2009). However, these physiological mechanisms as well as the stomatal aperture are under a complex genetic and molecular control that needs to be deciphered in order to clearly understand how drought tolerant species and genotypes accommodate to water limiting conditions.
I.5. Molecular mechanisms and regulatory networks for drought stress
responses
During a drought stress event, changes in the expression of various genes take place. The transcriptional regulations of these genes in response to drought induce molecular mechanism involved in drought tolerance. However, drought tolerance is a complex phenomenon involving the combined regulation and action of many genes (Cattivelli et al., 2008).
In this section, we will first describe genes which, according to the literature, encode cell effectors proteins involved in generic molecular mechanisms that allow drought tolerance. In this case and throughout this work, we use the term “effectors proteins” as opposed to “receptors and signal transducer proteins”. These proteins are largely involved in cell protection mechanisms. Then we will discuss a second type of genes which are differentially expressed during drought event and contribute to signal transduction and encodes for regulatory proteins.
I.5.1. Molecular mechanisms for cell protection during drought stress
Aquaporins are membrane proteins that can be involved in generic molecular mechanisms for drought tolerance. They facilitate and regulate passive exchange of water across membranes. Although their role in plant drought stress tolerance has not been clearly understood yet, it is generally admitted that they can regulate the hydraulic conductivity of membranes and increase water permeability (Maurel & Chrispeels, 2001). They probably play a role in soil water uptake by the roots as they are abundantly expressed in this tissue.
Synthesis of stress proteins is also a generic molecular response to drought stress. Among these stress proteins, the heat shock proteins that belong to a larger group of molecules called chaperones is of particular importance. Many heat shock proteins have been found to be induced by different abiotic stresses and in particular by drought (Coca et al., 1994). They play a role in stabilizing the structure of other proteins to maintain their activities in adverse biophysical conditions. Late Embryogenic Abundant (LEA) proteins are another important group of stress
proteins. Also known as a class of dehydrins, they are accumulated in the tissues during the desiccation stage of the seed but also in vegetative tissues during periods of water deficit (Farooq et
al., 2009). Their particular structure with the highly conserved Lysin-rich domain allows them to be
involved in hydrophobic interactions and in macromolecule stabilization (Nylander et al., 2001). They also play a major role in the concentrations of ions that are accumulated during desiccation events in the cell (Gorantla et al., 2007).
All these molecular drought responses are triggered by complex signaling and regulatory pathways that involve the interaction of various genes between them.
I.5.2. Regulatory networks of drought stress responses
During drought stress, various genes have been shown to be induced or repressed at the transcriptomic level using different tools such as microarray and RNA sequencing analysis on
Arabidopsis thaliana and rice (Shinozaki & Yamaguchi-Shinozaki, 2007; Hirayama & Shinozaki, 2010;
Todaka et al., 2012). Transcriptional changes could be induced by drought stress, in particular, via the action of several phytohormones. An important and well-described plant hormone for drought stress is the abscisic acid (ABA). Its production is triggered by water deficit which in turn causes stomatal closure and regulates expression of drought responsive genes. Indeed, many genes involved in ABA biosynthesis were shown to be up-regulated during dehydration in Arabidopsis (AtNCED3, AAO3,
AtABA3 and AtZEP). Over-expression of AtNCED3 in transgenic plants improved drought tolerance
while, on the contrary the knockout mutants for this gene showed drought sensitive phenotypes. This suggests that NCED3, in particular, plays an important role in ABA accumulation during a drought event (Endo et al., 2008). Accumulation of ABA in guard cells of mature leaves not only induces stomatal closure, as already mentioned, but also plays a role in stomata initiation in young leaves (Chater et al., 2014) and help prevent water losses.
ABA role and signal transduction during drought stress has been studied thanks to mutants, in particular in the plant model Arabidopsis. Mutants for the genes abi1 and abi2 (ABA insensitive 1 and 2) present a wilty phenotype, that let think that ABI1 and ABI2 genes have important roles in ABA-dependent signal transduction pathways during a water deficit (Shinozaki & YamaguchiShinozaki, 1997; Shinozaki et al., 2003). They encode type 2C protein Ser/Thr phosphatases (PP2C). This suggests that a phosphorylation/ dephosphorylation cascade might be involved in ABA signal transduction.
ABA-induced stomatal closure, as a model of plant cell responses to a water stress, has been largely studied. This phenomenon is due to a multiple chain of cellular events involving second messengers. To sum up, ABA is perceived by receptors in the guard cells. ABA-perception induces Ca2+ cytosolic concentration and pH increase. It causes first K+ and anion efflux and then water efflux.
Finally, water efflux induces guard cell volume reduction and stomatal closure (Zhu et al., 2012). This is why Ca2+ is considered to be likely the most important second messenger in the water-stress responses in plant cells. Then, ABA signal transduction of a drought event is mediated by second messengers and various phosphorylation events in the vegetative tissues.
A fraction of drought responsive genes have been shown to be induced by the application of exogenous ABA whereas another group of genes were not affected. This demonstrates the existence of both ABA-independent and ABA-dependent regulatory pathways to regulate drought-inducible genes. Moreover, Shinozaki and Yamaguchi-Shinozaki (1997) hypothesized that four pathways play a role in the activation of stress inducible-genes: two ABA-dependent and two ABA-independent. The first ABA-dependent pathway gathers together genes which contain ABA-Responsive Elements (ABRE) in their promoter regions. Therefore the ABRE functions as a cis-acting regulation. cDNAs for ABRE-binding (AREB) proteins, also called ABRE-binding factors (ABF) have been isolated (Choi et al., 2000) and show a basic region adjacent to a Leu-zipper motif (bZIP). The ABRE motif is PyACGTGGC. The specificity of the bZIP protein binding to ABRE is due to nucleotides around the core motif ACGT. However, for ABA-responsive transcription, a single copy of ABRE is not sufficient (Yamaguchi-Shinozaki & (Yamaguchi-Shinozaki, 2006). For example, ABA-responsive expression of the Arabidopsis gene
RD29B in vegetative tissue requires two ABRE sequences (Uno et al., 2000). Activation of AREB/ABF
genes by ABA is not completely understood. However, phosphorylation/dephosphorylation events seem to play a key role in this ABA signaling pathway. In Arabidopsis, five of the nine type-2 SNF1-related protein kinases (SnRK2) are activated by ABA (Boudsocq & Lauriere, 2005). These ABA-activated SnRK2 protein kinases were shown to phosphorylate the conserved regions of AREB/ABF and therefore possibly activate them in Arabidopsis (Furihata et al., 2006). Similar observations were made for the rice (Kobayashi et al., 2005).
There are other types of ABA-dependent expressive genes involved in response to drought which could be grouped in a second ABA-dependent pathway: genes induced by MYB and MYC factors. For example, RD22 expression is induced by ABA and is not activated through ABRE cis-acting regulation. A MYC and a MYB transcription factors (AtMYC2/RD22BP1 and AtMYB2) bind MYC and MYB recognition sites in the RD22 promoter. These recognition sites act as cis-acting elements and cooperatively activate expression of RD22 under drought stress (Abe et al., 2003). Various other cis-acting elements have been found in drought and ABA-responsive genes. Arabidopsis RD26 encodes a NAC protein. Microarray analysis showed that ABA and stress inducible genes were up-regulated in
RD26-overexpressing plants and on the contrary down-regulated in RD26-repressed plants indicating
that the NAC recognition sites may function as a cis-regulatory factor in ABA-dependent gene expression under drought stress conditions (Fujita et al., 2005). Another example is the Arabidopsis gene AtERF7 which binds to a cis-acting element of ABA-drought responsive genes and acts as a
repressor of their expressions. Indeed, over-expression of AtERF7 in transgenic plants decreased drought tolerance by a reduction of ABA responses in guard cells (Yamaguchi-Shinozaki & Shinozaki, 2006).
Some genes are differentially expressed during drought events in deficient (aba) or ABA-insensitive (abi) Arabidopsis mutants, indicating that they are regulated by ABA-independent pathways (Shinozaki & YamaguchiShinozaki, 1997). The first ABA independent pathway gathers together genes with cis-acting elements in their promoters called DRE (TACCGACAT). DRE-binding proteins, called DREB1 and DREB2, contain the conserved DNA-binding domain found in the ERF (ethylene-responsive element binding factor) and AP2 proteins cells (Yamaguchi-Shinozaki & Shinozaki, 2006). The DREB1 proteins are mainly involved in cold stress responses, whereas DREB2 proteins are more involved in responses to drought stress. DREB2A has been shown to be a major transcription factor that functions in particular under water deficit stress. However, simple over-expression of DREB2A in transgenic plants, does not improve drought tolerance. Activation mechanisms of DREB2A are not clearly understood and could involve phosphorylation processes (Liu
et al., 1998). Finally there is a class of drought inducible genes that show no differential expression
under cold or ABA application. It suggests that these genes belong to a second ABA-independent pathway. These genes are called ERD1 (early response to dehydration1). Promoter analysis of ERD1 allows identifying two novel cis-acting elements: a MYC like sequence and a RPS1 site 1-like sequence that are involved in induction of ERD1 during cell dehydration (Simpson et al., 2003). cDNAs encoding MYC-like and a RPS1 site 1-like sequences binding proteins are NAC sequences and transcription factor with zinc-finger homeodomain (ZFHD) respectively. They are both necessary to activate expression of ERD1 (Yamaguchi-Shinozaki & Shinozaki, 2006).
The ABA-dependent and ABA-independent pathways present cross-talks between them. For example, the well studied drought differentially expressed gene RD29A has a promoter sequence with both ABRE and DRE cis-acting elements. This gene is governed by both ABA-dependent and ABA-independent regulations. It was confirmed by its induction by ABA and drought in non-transformed plants and by its induction by drought only in aba or abi mutants.
Figure I.6 schematizes the four regulatory pathways for drought responsive genes presented above.
Figure I.6: Four regulatory pathways for drought responsive genes.
Pathways I and II are ABA-dependent. Pathways III and IV are ABA Responsive Element; SNRK2: type
ABRE-binding factors; ABRE: ABA Responsive Element; DREB2: one DRE acting element with the conserved sequence
RD29A is a drought responsive gene with ABRE and DRE cis ABA-dependent and ABA-independent pat
YamaguchiShinozaki, 1997; Yamaguchi
6: Four regulatory pathways for drought responsive genes.
dependent. Pathways III and IV are ABA-independent. ERF: Ethylene Responsive Element; SNRK2: type-2 SNF1-related protein kinase; AREB: ABRE-binding
binding factors; ABRE: ABA Responsive Element; DREB2: one DRE-binding protein; DRE: c acting element with the conserved sequence TACCGACAT; ERD1: early response to dehydration1. RD29A is a drought responsive gene with ABRE and DRE cis-sequences and therefore induced by
independent pathways I and III. (Adapted from Yamaguchi-Shinozaki & Shinozaki, 2006)
independent. ERF: Ethylene binding protein; ABF: binding protein; DRE: cis-TACCGACAT; ERD1: early response to dehydration1.
sequences and therefore induced by ways I and III. (Adapted from Shinozaki &
Besides cross-talks between ABA and non ABA pathways during drought stress regulation, some interactions with other hormonal pathways are very likely to happen. An example is the interaction between ABA and ethylene pathways. It has been shown that ethylene can antagonize drought and ABA-induced stomatal closure (Wilkinson et al., 2012). On the contrary, jasmonate is, like ABA, a positive regulator of stomatal closure (Zhu et al., 2012). Again, cytokinins are a class of plant hormones that are known to prevent leaf senescence (Davies et al., 2005) and therefore help maintain photosynthetic activity during drought stress. Brugiere et al. (2003) demonstrated that expression of genes coding for cytokinin oxydase and enzymes involved in cytokinins degradation were induced by ABA. Antagonistic signal between ABA and brassinosteroid have also been recently demonstrated. Effectively ABA slows leaf expansion rates during a water soil deficit event (Tardieu, 2013), whereas brassinosteroid biosynthesis promotes leaf cell division and expansion (Zhiponova et
al., 2013). However, in most of the cases, knowledge on how the different hormonal pathways
interact is lacking.
As for hormonal signals, direct environmental signal is transduced by a various set of genes such as those encoding for calmodulins, G-proteins, protein kinases and transcription factors. This is the case for example, with the Arabidopsis genes AtCDPK1 and AtCDPK2 (Calcium Dependent Protein Kinases), which are rapidly induced by drought and therefore are involved in the transduction cascade under drought stress. Another example is the genes involved in the MAPK (Mitogen-activated protein kinase) cascade.
I.5.3. Generic genes expression pathway during a drought stress event
Finally, we have seen that various genes are induced during drought stress: genes encoding for effectors proteins that are involved in cell protection against water-deficit damages and genes involved in signal transduction and regulatory pathways. Main regulatory pathways linking all these genes begin to be understood thanks to studies conducted mainly in the plant model Arabidopsis. However, in general, relationships between drought stress inducible genes remain largely unknown.
From the analysis of the various drought responsive genes described above, we can however draw a generic pathway of genes involved in responses to water stress and more generally in response to abiotic stresses (Shinozaki & YamaguchiShinozaki, 1997; Wang et al., 2003). Figure I.7 illustrates this cascade. We can class genes in different groups. The first group brings together genes acting as the receptor of environmental signals. Mechanisms and genes involved in drought perception are not clearly known. Several hypotheses can be raised involving osmosensors, an oxidative burst or a change in cytoskeletons tension that could trigger the MAPK cascade and signal transduction. However their functioning in water stress perception by the cell is not entirely demonstrated (Shinozaki & Yamaguchi-Shinozaki, 2007). After the stress perception by the receptor
genes, the environmental signal is transduced by a second class of genes or molecular components (see figure I.7). As described before, transduction of the environmental signal involves secondary messengers such as Ca2+, phosphorylation cascades and/or plant hormones. In a third step, the signal transduction leads to a regulatory network that controls gene transcription. Examples of ABA-dependent and ABA-inABA-dependent regulatory pathways have been largely described in the previous sections. The fourth class represented in figure I.7 comprehends genes coding for effectors proteins involved in cellular and molecular drought cell responses such as the dehydrins and the aquaporins presented previously. Finally, this generic pathway, triggered by drought stress, results in various physiological and morphological responses to water deprivation that can be read into cellular, tissue and plant phenotypes.
It appears that gene expression corresponds to an important link between the environmental signal perception and the morphological and physiological responses that confer drought stress tolerance. Therefore the study of the gene regulatory networks (GRN) and their cross-talk appears to be a main goal in order to clearly understand drought stress tolerance. Systems biology approaches could be interesting and provide a better knowledge of the implication of the different signaling pathways (Ahuja et al., 2010). Indeed, these approaches at the systems level permit to examine the structure and dynamics of the cellular and organismal functions instead of studying the characteristics of isolated parts of a cell or of an organism (Kitano, 2002) such as the work presented previously from Arabidopsis studies. The application of this new strategy has been allowed by the recent and simultaneous progresses in genotyping technologies on one hand, transcriptomic tools (such as microarray technology) on the other hand, and high-throughput phenotyping.
Figure I.7: Generic pathways for plant 2012).
Ca2+: calcium; ROS: Reactive oxidative species; InsP: Inositol Phosphate;CDPK: Calcium dependent protein kinase; MeJA: Methyl Jasmonate; LE
7: Generic pathways for plant responses to drought stress (adapted from
: calcium; ROS: Reactive oxidative species; InsP: Inositol Phosphate;CDPK: Calcium dependent protein kinase; MeJA: Methyl Jasmonate; LEA: Late Embryo genesis-Abundant
(adapted from Huang et al.,
I.6. Genotype x Environment interactions during drought stress
responses
In the previous sections, we have seen that the plants are able to adapt to various environments, as for example, environments with limited water resources. It is done by changing their phenotype, a phenomenon called “phenotypic plasticity” (El-Soda et al., 2014) and that allows implementation of tolerance mechanisms for drought stress. Genotypes do not have identical phenotypic responses for the same environmental constrains. This can be clearly demonstrated by the comparison of a drought-sensitive genotype with a drought-tolerant genotype but also of different drought tolerant genotypes which have different strategies. Although, the plant phenotype is dependent on the genotype and on the environmental factors, phenotypic plasticity itself also depends on the genotype, i.e two genotypes do not present the same variation of phenotypes between two environments (Des Marais et al., 2013). This last phenomenon is called genotype x environment interaction (GxE interaction) and can be identified by the variation of the reaction norms. Reaction norms are graphical representation of phenotypes expressed by a genotype under varied environmental conditions. Figure I.8 illustrates the different cases that reaction norms could highlight: phenotypic plasticity only and phenotypic plasticity with different types of GxE interaction models.
Figure I.8: Reaction norm plots for various patterns of phenotypic plasticity (Des Marais et al.,
2013).
Thin lines show the plastic response of a single genotype, whereas the thick line represents the population average plasticity. The x-axis represents different environmental conditions and the y-axis represents the trait of interest; the series represent different genotypes. (a) Plasticity without genotype x environment interaction (GxE); (b) plasticity with variance changing GxE; (c) plasticity with rank changing GxE.
As described above, drought stress responses run under a complex genetic control involving various genes that interact between them and whose expressions depend on the environment. Another important aspect of this gene regulatory network is the GxE interaction effects that play a role in the variations of these gene expressions. Up to now, molecular geneticists have studied GxE interactions using the traditional tools of forward and reverse genetics and the evaluation of condition-dependent mutants (Des Marais et al., 2013). This has led to the identification of important signaling pathways for key environmental interactions, as the drought regulatory network discussed in the previous section, and the establishment of hypotheses about crosstalk and pleiotropy of responses across various environmental signals (Todaka et al., 2012). However, many questions remain concerning GxE interactions, their different patterns (illustrated in figure I.8) and their underlying genetic control.
Different genetic architectures cause GxE interactions (Des Marais et al., 2013). First, a change in phenotypic rank between two genotypes can be interpreted as a genetic trade-off through antagonistic pleiotropy. It means that an allele may have an additive effect that increases the phenotypic trait value in one environment and decreases it in another (figure I.9.A). In a second case called differential sensitivity, the magnitude of the allelic effect on phenotype depends on the environment (figure I.9.B). Conditional neutrality is a particular case of differential sensitivity: an allele has a phenotypic effect in one environment and no effect in another (figure I.9.C). Finally, GxE interactions can be also due to a various range of non-additive effects. Among these non-additive effects, we can cite dominance, epistasis, genetic linkage and epigenetics (El-Soda et al., 2014).
Knowledge of GxE interactions of genes involved in the drought regulatory network is important. It can help refine the interaction between genes involved in those responses to the environment. It can also be useful for breeders if they want to select for tolerance in a precise environment (therefore GxE interactions will be important) or if they search for an ideotype tolerant in a various range of environmental scenarios.