Open Archive TOULOUSE Archive Ouverte (OATAO)
OATAO is an open access repository that collects the work of Toulouse researchers and
makes it freely available over the web where possible.
This is an author-deposited version published in : http://oatao.univ-toulouse.fr/
Eprints ID : 14022
To link to this article : DOI:10.1016/j.matchar.2014.06.021
URL :
http://dx.doi.org/10.1016/j.matchar.2014.06.021
To cite this version : Theuwissen, Koenraad and Lacaze, Jacques and
Véron, Muriel and Laffont, Lydia Nano-scale orientation mapping of
graphite in cast irons. (2014) Materials Characterization, vol. 95. pp.
187-191. ISSN 1044-5803.
Any correspondance concerning this service should be sent to the repository
administrator: [email protected]
Nano-scale orientation mapping of graphite in
cast irons
Koenraad Theuwissen
a, Jacques Lacaze
a, Muriel Véron
b, Lydia Laffont
a,⁎
a
Institut CARNOT CIRIMAT, Université de Toulouse, ENSIACET, CS 44362, 31030 Toulouse Cedex 4, France b
SIMAP, CNRS-Grenoble INP, BP 46 101 rue de la Physique, 38402 Saint Martin d'Hères, France
A B S T R A C T
A diametrical section of a graphite spheroid from a ductile iron sample was prepared using the focused ion beam-lift out technique. Characterization of this section was carried out through automated crystal orientation mapping in a transmission electron microscope. This new technique automatically collects electron diffraction patterns and matches them with precalculated templates. The results of this investigation are crystal orientation and phase maps of the specimen, which bring new light to the understanding of growth mechanisms of this peculiar graphite morphology. This article shows that mapping the orientation of carbon-based materials such as graphite, which is difficult to achieve with conventional techniques, can be performed automatically and at high spatial resolution using automated crystal orientation mapping in a transmission electron microscope.
1. Introduction
Mechanical properties of cast iron strongly depend on the structure of the graphite precipitates within the iron-rich matrix. In the 1950s, a spheroidization treatment led to a new range of mechanical properties for cast irons. Graphite, which would crystallize in a flake type without this treatment, grows as spherulitic crystals leading to improved ductility of cast irons. Although the production of spheroidal graphite cast irons is well-mastered, the spheroidization mechanism is yet unclear. Understanding of graphite growth mechanisms is of high importance to ultimately prevent the formation of degen-erate graphite morphologies which lead to decreased mechanical properties of spheroidal graphite iron castings[1,2]. In order to do
so, crystal orientations in graphite spheroids have been investi-gated by several authors by means of selected area electron diffraction and convergent beam electron diffraction[3,4]and the results have led to the development of various growth models for spherulitic growth of graphite. Nevertheless, generalising these local measurements to propose accurate growth models requires a global view of graphite's crystal orientations in a spheroid. The most common technique to map crystal orientations, that is to say electron backscatter diffraction in a scanning electron microscope, is not suitable for the study of carbon materials mainly due to carbon's low backscattering efficiency. For this reason, it is still very difficult to obtain orientation maps of carbon using this technique: only single point measurements have been reported[5]but these are not sufficient to fully determine crystal
⁎ Corresponding author.
orientations of a whole sample. This limitation can be overcome by using different techniques, such as the recently developed electron diffraction based automated crystal orientation mapping (ACOM) in a transmission electron microscope.
The aim of this article is to present the crystal orientation of graphite within spheroidal precipitates in cast irons and to illustrate the potential of studying the crystallography of carbon-based materials using ACOM-TEM technique[6,7].
2. Materials and Methods
2.1. Sample Preparation Using a Focused Ion Beam
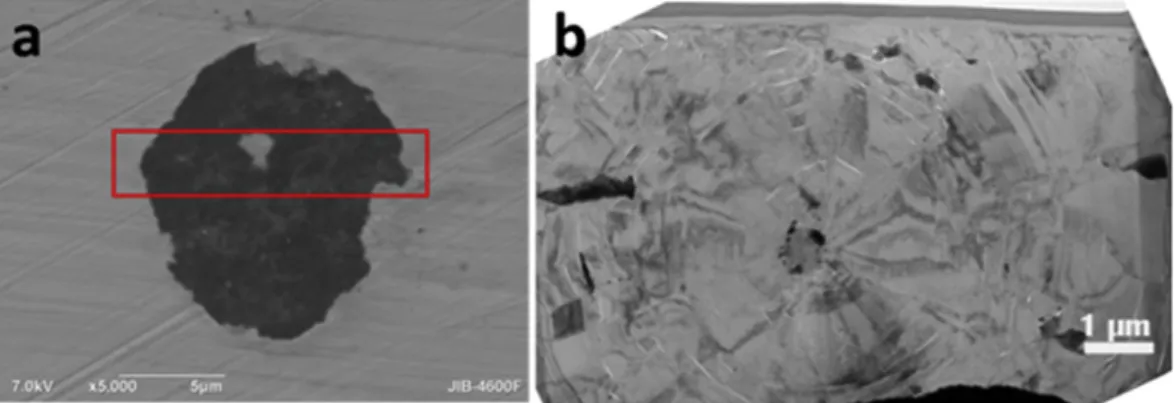
A commercial grade spheroidal graphite cast iron was used in this study. Its composition and microstructural features have been described elsewhere[8]. A section of this material was mechanically ground and then mirror polished with a 0.05μm alumina suspension. A transmission electron microsco-py specimen, containing a diametrical section of a spheroid, was extracted from the area shown inFig. 1a using the focused ion beam-lift out technique in a JEOL JIB-4600F focused ion beam (FIB) scanning electron microscope.
This preparation technique was chosen because it enables precision cross-sectioning at the area of interest. Unlike other preparation methods, which lead to specimens with limited electron transparent areas, FIB sectioning facilitates homoge-neous thinning thus producing a relatively large specimen which can be investigated by transmission electron microscopy. This is essential to the present work in which the growth features of a graphite spheroid are investigated.
2.2. Transmission Electron Microscopy Investigation
A JEOL JEM-2100F transmission electron microscope, operated at 200 kV, was used for imaging the sample. Energy dispersive X-ray spectroscopy was carried out using a Bruker Quantax silicon drift detector. A photomontage of bright field images (Fig. 1b) presents an overview of the sample's microstructure. Automated crystal orientation mapping (ACOM) was car-ried out in a JEOL 3010 transmission electron microscope, operated at 300 kV, equipped with a DigiSTAR external source
device. The electron beam scans the selected area of the sample and electron diffraction patterns are collected using an external CCD camera. The system compares the experi-mental diffraction patterns to pre-calculated templates and selects the best-matching patterns. The matching quality is measured by two parameters: the correlation index and the reliability. The first one evaluates the correspondence be-tween the experimental pattern and those in the database. The calculated pattern giving the highest correlation index is selected and its corresponding orientation is assigned to the investigated spot. The reliability is determined by comparing the two orientations having the highest correlation indexes (best and second best matches). If the two calculated dif-fraction patterns have similar correlation indexes, more than one solution is possible and the reliability is low. It is important to keep these parameters in memory when orientation maps are presented.
3. Results and Discussion
Fig. 1b shows that there is a slightly darker area in the cen-tral part of the specimen, from which conical sectors seem to radiate. Variations in the sample's contrast suggest that graphite presents multiple orientations. Selected area diffrac-tion patterns were repeatedly taken at different locadiffrac-tions of the sample and showed that, within these sectors, the [0001] directions of graphite (c axes) are roughly parallel to the spheroid's radius. Following this procedure to study the orienta-tion of graphite in large areas proved to be tedious and time consuming. Therefore, ACOM measurements were performed automatically over the whole sample with steps of 33 nm so as to obtain complete mapping of phases and crystal orientations, as shown inFig. 2a and b. 44 diffraction patterns were taken every second resulting in a scanning time of roughly 30 min for an area of 66μm2.
As this system is based on electron diffraction patterns, the different phases of a sample can be distinguished as long as they have been declared in the template database. An example of this is shown by the dark areas at around 3μm from the sample's centre seen inFig. 1b. It is well-known that graphite spheroids can contain iron-rich inclusions and therefore, the
Fig. 1– (a) Scanning electron micrograph showing the area where the sample was extracted; (b) photomontage of bright field images of the sample.
experimental diffraction patterns were also compared to tem-plates of ferrite and austenite.
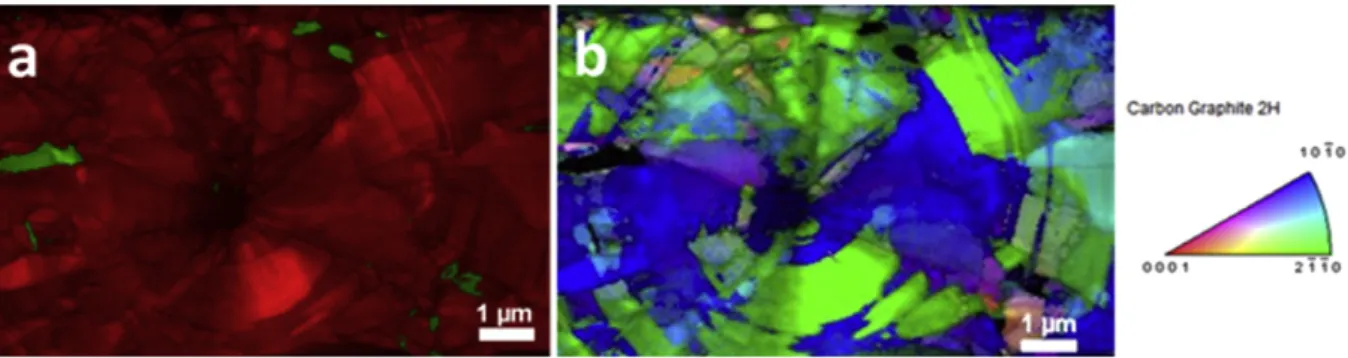
After measurements and data analysis, the system clearly identifies both phases as shown in Fig. 2a where graphite appears in red and ferrite in green. It is important to mention that the central area, though indexed as graphite, shows low correlation indexes. Indeed, the ACOM technique always leads to an orientation selection: the software will always select the highest correlation index, as low as it may be. Further investigations using EDX analysis showed that the central area contains a variety of elements from treatments applied to liquid iron during its production, confirming, at least to some extent, past theories of heterogeneous nucle-ation[9].
Fig. 2b is an orientation map of graphite projected along the direction normal to the sample, combined with the corresponding correlation indexes. Areas with low correlation indexes appear shaded. In this map, the orientation of the iron-rich particles is not studied so these are intentionally shown in black. This map shows that the inner structure of the spheroid consists indeed of conical sectors that grow from the nucleus. This can be related to the often reported maltese cross, observed when sections of graphite spheroids are exposed to polarised light[10], which gives a rough indication of the c axis orientation in the spheroid. Nevertheless, the orientation map ofFig. 2b shows that sectors have different angular apertures and the orientations of graphite within them are variable.
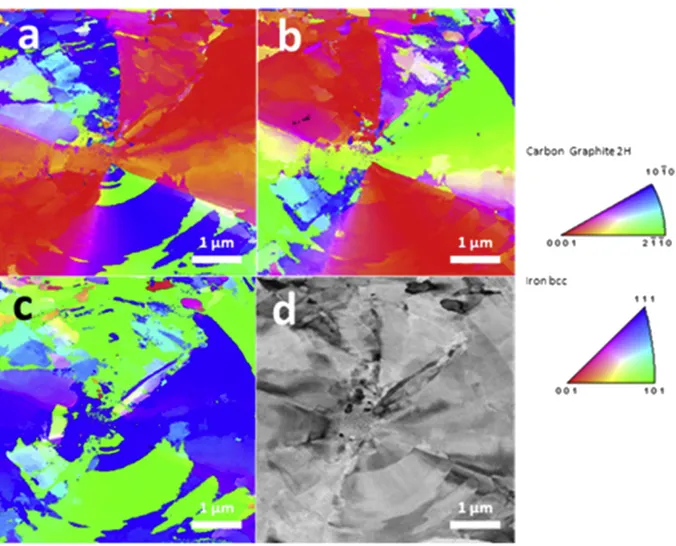
In order to have higher resolution and more accurate maps, a second experiment focused on the graphite structure around the central part of the specimen, i.e. the nucleus, where electron diffraction patterns were taken every 16 nm. With 44 frames collected per second, a scanning time of 37 min resulted in a map of approximately 25μm2. As a single crystal orientation map is not sufficient to adequately describe the orientations in the sample, three maps with respect to the sample's reference axes are presented inFig. 3. It is shown that the [0001] direction of graphite is always in-plane, oriented radially. It tilts progressively within each sector as revealed by the gradual fading of colours from the centre of the sectors towards the outer areas. The grayscale reliability map ofFig. 3d shows that areas where the diffraction pattern indexing is less reliable correspond to the outlines of the Fe-rich particles (top right) and some areas around the exogenous nucleus. Some
darker areas in the reliability map are also found around the nucleus and this is due to the fact that multiple sectors of different orientations grow out of this central particle. Correla-tion indexes are expected to be low at interfaces between sectors because they separate misoriented areas and this results in lower reliability values around the central particle. With the growth of sectors, reliability of the measurement increases as areas of similar orientations grow wider.
The ACOM data can be analysed with the specific “Map Viewer” software as well as with different EBSD data analysis software so as to characterize misorientations in the sample. The user can draw lines and monitor the relative orientations of points along them. Boundaries can be imaged automatically and sorted according to the misorientation angles as presented inFig. 4. The selection of angular classes made here shows that small angle misorientations, lower than 10°, are present and define various orientation domains within single sectors. These observations disregard Faivre's model of spherulitic growth by regular branching[11]as it is highly unlikely that successive twinning of fibrous crystals lead to such conical sectors with a radial orientation of the _c _axis. Moreover, the extent of misorientations due to twinning as described by these authors would distinctively cover the surface of the sample but this is clearly not the case.
Rotations of about 27° around the c axis of graphite occur on a regular basis as shown by the alternating green/blue areas in the lower part ofFig. 3. These rotations correspond to twists which, as described in the past[3], provide steps for atom attachment. The measured values are in accordance with the rotation angles measured elsewhere[3,12]and predicted theoretically using the coincidence site lattice theory[13]as low energy stacking faults of graphite. It is important to note that these rotations do not occur systematically between successive layers as suggested by Double and Hellawell but rather define domains of similar orientation. Neighbouring sectors are separated by large angle misorienta-tions, often larger than 30° and this is in agreement with the angles measured of 39° and 53° reported by Miao et al.[14].
These results prove that conical sectors in graphite spheroids present several orientation domains. Graphite growth within a single sector is not always regular and defects such as rotations and misorientations occur. These results validate some argu-ments of earlier growth models but also challenge others and bring new light to the understanding of the growth mechanisms of this peculiar graphite morphology.
Fig. 2– (a) Phase identification showing graphite in red and ferrite in green, (b) crystal orientation map of graphite in the specimen, combined with the correlation index.
Fig. 3– Crystal orientation maps of graphite in the central area of the specimen, projections (a) along X, (b) Y and (c) Z directions and (d) reliability map.
4. Conclusions
The internal structure of a spheroidal graphite precipitate was studied using automated crystal orientation mapping in a transmission electron microscope. The results reveal that conical sectors radiate from a central nucleus. The orientation maps reveal high angle misorientations between neighbouring sectors as well as smaller angle misorientations within single sectors. These data provide important information for the understanding of graphite growth mechanisms in cast iron as they lead to challenge some of the earlier models. Furthermore, this study shows that ACOM-TEM, which has been used to characterize crystal orientations of metals at a very fine scale; can also provide accurate characterization of the structure of carbon-based materials, thus opening a wide new range of applica-tions to this technique.
Acknowledgements
The authors are grateful to TEMSCAN Service of University Paul Sabatier where part of the TEM was carried out. The authors wish to acknowledge T. Suzuki and H. Matsushima at JEOL Japan for the FIB sample preparation.
R E F E R E N C E S
[1] Karsay SI, Campomanes E. Control of graphite structure in heavy section ductile iron castings. AFS Trans 1970;78:85–92.
[2]Källbom R, Hamberg K, Björkegren LE. Chunky graphite in ductile iron castings. WFC 2006; 2006 184/1–184/10.
[3]Double DD, Hellawell A. The structure of flake graphite in Ni–C eutectic alloy. Acta Metall 1969;17(8):1071–83.
[4]Miao B, Northwood DO, Bian W, Fang K, Fan MH. Structure and growth of platelets in graphite spherulites in cast irons. J Mater Sci 1994;29:255–61.
[5]Holmgren D, Källbom R, Svensson IL. Influences of the graphite growth direction on the thermal conductivity of cast iron. Metall Mater Trans A 2007;38:268–75.
[6]Rauch EF, Veron M, Portillo J, Bultreys D, Maniette Y, Nicolopoulos S. Automatic crystal orientation and phase mapping in TEM by precession diffraction. Microsc Anal 2008;22:S5–8.
[7]Rauch EF, Veron M. Coupled microstructural observations and local texture measurements with an automated crystallographic orientation mapping tool attached to a TEM. J Mater Sci Eng Technol 2005;36:552–6.
[8]Theuwissen K, Lafont MC, Laffont L, Viguier B, Lacaze J. Microstructural characterization of graphite spheroids in ductile iron. Trans Indian Inst Metals 2012;65(6):627–31.
[9]Skaland T, Grong O, Grong T. A model for the graphite formation in ductile cast iron: part I. Inoculation mechanisms. Metall Trans A 1993;24A:2321–45.
[10] Morrogh H. The examination and identification of inclusions in metals and alloys. In: Conn GKT, B. F.J., editors. Polarized Light in Metallography. London: Butterworth; 1952.
[11] Faivre G. On the mechanisms of spherulitic growth in polymer and iron melts. Adv Mater Res 1997;4–5:17–30.
[12] Minkoff I, Lux B. Ribbed growth of graphite in Ni–C solutions containing boron. Nature 1970;225(5232):540–2.
[13] Bollmann W, Lux B. Grain Boundaries in Graphite; 1975 461.
[14] Miao B, Fang K, Bian W, Liu G. On the microstructure of graphite spherulites in cast irons by TEM and HREM. Acta Metall Mater 1990;38(11):2167–74.