2011 edition
M e t h o d o l o g i e s a n d
W o r k i n g p a p e r s
Fewer, older and multicultural? Projections of the
EU populations by foreign/national background
Giampaolo Lanzieri
Table of contents
INTRODUCTION ...4
DATA AND METHOD ...7
The choice of the input data...7
Population estimates... 10
The four models... 10
Model 1... 11 Model 2... 13 Model 3... 13 Model 4... 16 RESULTS ... 17 CONCLUSIONS ... 23 REFERENCES ... 25 ANNEX ... 27
Introduction
For several years, migration has been the main driver of population growth in many European countries. In some of them, where natural growth has become
negative, migration has even
counterbalanced the otherwise declining population, sustaining population growth (Lanzieri, 2008). At the beginning of the third millennium, migration in the European Union (EU) reached considerable levels, which rapidly modified the composition of the population in Member States exposed to large migratory flows.
In five years, from 2002 to 2007, the
estimated stock of foreign-born
population (Kupiszewska and Bijak, 2009) increased by 1.2 percentage points (p.p.), rising from 7.7 % to 8.9 % of the total EU population. However,
the rise was higher in some
Mediterranean countries: over the same period, the foreign-born population in Spain and Italy nearly doubled, reaching 12 % and 7 % respectively in 2007. Coleman (2006) pointed out some potential consequences of these trends and developed the theory of a third demographic transition in Western countries with low fertility and high immigration that would affect their population composition and national identity. This may in the long term lead to divergent patterns of ethnic
composition between European
countries and other areas of the world (Coleman, 2009). Coleman’s analysis is based on the results of selected national projections (carried out independently of each other), mostly based on the
concept of citizenship. To my
knowledge, no comprehensive set of projections is available to provide data
disaggregated by variables related to migration issues (such as citizenship) and thus international comparisons between results of different projections may be affected by methodological diversity.
Furthermore, analysis of population
totals broken down by ethnic
composition may not be enough to display the full contribution of migration to population dynamics. The typically younger age profile of migrants in particular modifies selected age classes. Looking at available estimates of population by country of birth and age group (Table 1) it may be noted that major changes have occurred in the age class 20-49, especially in the class of persons aged from 25 to 34 years, where changes in stocks of the foreign-born population have exceeded 2 p.p. in five years. In particular, in the EU, the number of foreign-born persons in the age class 25-29, that most affected by migratory flows, has increased from 3.6 to 4.4 million. However, this increase of 2.3 p.p. in the stock of those who were foreign-born and are 25-29 years old, from 10.7 % to 13.0 % of the total population of the same age, is also due to the parallel shrinking of the number of native-born persons, which has gone down, from 30.3 million to 29.5 million. There have also been relevant shrinkages in the native-born population in other age classes. From Table 1 it can be noted that most migrants are of non-EU origin.
Table 1: Aggregation of the whole European Union of the Member States population
composition by country of birth (%)
On 1 January 2002 On 1 January 2007 of which: of which: Age classes Native-born persons Foreign-born persons in other MS not in the EU Native-born persons Foreign-born persons in other MS not in the EU Total 92.3 7.7 2.7 5.0 91.1 8.9 3.1 5.8 0-4 97.9 2.1 0.7 1.4 97.9 2.1 0.8 1.3 5-9 96.7 3.3 1.0 2.3 96.3 3.7 1.3 2.5 10-14 95.7 4.3 1.2 3.1 95.3 4.7 1.4 3.3 15-19 94.3 5.7 1.5 4.1 93.7 6.3 1.8 4.5 20-24 91.6 8.4 2.6 5.8 90.1 9.9 3.2 6.7 25-29 89.3 10.7 3.3 7.4 87.0 13.0 4.1 8.9 30-34 89.0 11.0 3.5 7.5 86.9 13.1 4.0 9.0 35-39 89.4 10.6 3.4 7.2 87.5 12.5 4.0 8.4 40-44 90.3 9.7 3.1 6.6 88.4 11.6 3.7 7.9 45-49 90.8 9.2 3.1 6.1 89.4 10.6 3.5 7.1 50-54 91.3 8.7 3.3 5.4 90.2 9.8 3.3 6.5 55-59 91.8 8.2 3.5 4.7 91.3 8.7 3.3 5.4 60-64 92.0 8.0 3.3 4.7 91.3 8.7 3.7 5.0 65-69 93.1 6.9 2.9 4.0 91.8 8.2 3.3 4.8 70-74 93.5 6.5 2.9 3.6 92.9 7.1 3.0 4.1 75-79 93.6 6.4 3.1 3.3 93.2 6.8 3.0 3.8 80-84 93.5 6.5 3.2 3.2 93.1 6.9 3.3 3.7 85+ 93.7 6.3 3.2 3.1 93.2 6.8 3.3 3.5
Source: calculations of the author on data from Kupiszewska and Bijak (2009).
Even though the rise of the share in selected age classes of foreign-born persons in general is not yet very apparent, it is likely to become much more relevant in the future, as it is seen as probable that migratory flows will continue to augment the EU population in years to come. In the so-called
EUROPOP2008, the Eurostat
Population Projections 2008-based (Lanzieri, 2009), net migration is assumed to cumulate up to 59 million over the period 2008-2060. Comparing the variant with migration with that without migration (purely theoretical), it is possible to assess the multiplicative effect of the net migration assumptions.
From Table 2, it can be noted that the projected total increase of 91 million for the EU population can be decomposed into 59 million of (net) migration, plus its indirect contribution of 32 million to natural change. This highlights an element sometimes overlooked: the overall contribution of migration is not limited to the assumptions themselves, but includes a relevant quota of indirect
effects (roughly +54 % in
Table 2: Cumulated vital events and demographic changes 2008-2060 for the EU in
the two variants (with and without migration) of EUROPOP2008 (million)
Births Deaths Natural change Net migration Total change Population 1.1.2061 With migration 255 305 -50 59 9 505 Without migration 219 301 -82 0 -82 414 Difference 36 4 32 59 91 91
Source:replication of Table 3 in Lanzieri (2009).
Although the comparison between the
two variants (with and without
migration) is a helpful way of quickly assessing the impact of the migration assumptions, it does not provide all the information necessary to estimate the entire contribution of migration to the population structure and dynamics. Such an analysis does not include the existing stock of migrants and their role in demographic dynamics. Furthermore, it does not make clear the contribution of migrants of first or further generations.
To do so, the scope of the analysis needs to be extended to the set of persons with a foreign background.
According to international
recommendations (UNECE, 2006;
§398), persons with a foreign
background are‘…those persons whose parents were born outside the country. The persons in this group may or may not have directly experienced an international migration.’ Further to the group of persons with a foreign
background, these international
recommendations define two other groups (UNECE, 2006; §399): persons with a national background, defined as persons whose parents were born in the country, and persons with a mixed background, defined as persons who have one parent born in the country and the other born abroad. Considering the
country of birth, it is thus possible to define ‘descendants of foreign-born persons’, that is, those born in the country whose ascendants were born abroad. Normally, the focus is on the so-called ‘second generation’, meaning those whose parents were born abroad (UNECE, 2006; §364). Thus, limiting the analysis to two generations, foreign-born persons whose parents were foreign-born abroad (the so-called ‘first generation’ of migrants), together with native-born persons whose parents were born abroad (the ‘second generation’) we can define a group of persons with a foreign background. The population of a country could thus be classified as follows (1):
(1) In principle, also native-born persons may be
international migrants if they have resided in another country for at least one year. Adding this category to foreign-born persons forms the group of ever-international migrants. For sake of simplicity, the international migrants are here defined as foreign-born persons. For the same reason, persons whose one or both parents were of unknown country of birth are not explicitly considered.
Table 3: Classification of resident population by country of birth and background Country of birth of the parents Country of birth Both parents born in the country
One parent born in the country, the other abroad
Both parents
born abroad Total
Abroad Foreign-born with national background Foreign-born with mixed background Foreign-born with foreign background (1st generation) International migrants In the country Native-born with national background Native-born with mixed background Native-born with foreign background (2nd generation) Native-born persons Total Persons with national background Persons with mixed background Persons with foreign background
To make a comparative analysis of the extent to which the demography of
single Member States may be
influenced by future migration flows, it is necessary to use a comparable set of projections. The purpose of this paper is to assess the contribution of migration
to future population dynamics by
computing projections by
foreign/national (f/n) background. Section 2 describes the method and the data used for this study; Section 3 presents the results, and in Section 4 a few conclusions are drawn.
Data and method
The choice of the input data
From the point of view of the
projections calculations, the
classification of Table 3 is rather difficult to implement as information on some categories is scarce. In particular, data on the country of birth of both parents are hard to find, if not impossible. It is then necessary to seek other data as a proxy for the f/n background. To assess the demographic effect of migration on the hosting population, a common approach is to consider the citizenship (see, e.g., Tsimbos, 2008), the main reason being the larger availability of data classified by this variable.
However, the use of citizenship in population projections has several
drawbacks. First, citizenship is not an immutable characteristic of a person, and can change over time: projections makers should therefore explicitly formulate assumptions about future naturalizations. Secondly, due to increasing numbers of international agreements, it is now more likely that persons may hold two (or even more) citizenships. Information collected by citizenship should then be clear about the rules of allocation in the categories, and/or projections should consider the case of double citizenships. Third, as citizenship is a varying characteristic, all events which can be replicated (such as fertility and migration) can see age patterns modifying over time due to
changes of citizenship (2). Last but not least, the citizenship attributed to offspring of foreign citizens may be
different country by country,
depending, for instance, whether it is
ius soli or ius sanguinis which is the
legal criterion. As this may depend on the citizenship of both parents, additional information and assumptions would then be necessary.
Ethnicity is probably one of the best proxies for the f/n background, as,
according to the international
recommendations, it ‘…is based on a shared understanding of the history and territorial origins (regional, national) of an ethnic group or community as well as on particular cultural characteristics: language and/or religion and/or specific customs and ways of life...’ (UNECE, 2006; §419). However, besides the fact that the collection of data by ethnicity is not carried out in all EU Member States, and consequently the data
necessary for the purposes of
projections are (for most countries) not available, inconveniences due to the presence/absence of ethnic categories in census questionnaires and to the fact that it is a subjective dimension, subject to changes over time, hinders the use of this variable for analysis by f/n background as defined above. In fact, it could be argued that responses to census questions about ethnicity in reality measure identity, and not ancestry, the former being influenced by the number of generations since the arrival of a person’s ancestors, knowledge of ancestral origins, etc. (Perez and Hirschman, 2009).
The use of information broken down by country of birth is a possible option.
(2) For instance, a person may immigrate a first time in a
country as foreigner and a second time as national, or may deliver a first birth being foreigner and a second birth after acquiring the citizenship, etc.
The country of birth does not change over time, and it thus overcomes some of the shortcomings of the use of
citizenship for the purpose of
projections. Obviously, the basic assumption is that the country of birth determines the demographic behaviour of the person. In practice, adopting the
country of birth as proxy for
background means using the
classification in Table 3 by row and not by columns. It is therefore necessary to introduce simplifying assumptions for the beginning of the projections period.
Foreign-born persons may indeed
include some with a national
background, born abroad of parents whose country of birth was actually that under consideration. In the same way, native-born persons may be descendants of persons born abroad. Hence, by only using data by country of birth, it must be assumed that these two ‘crossed’ categories (native-born from foreign-born parents and foreign-foreign-born from native-born parents) are not present, or that they are of perfectly equal size and structure, such as to exactly compensate for one another. This also applies in cases where only one of the two parents has a country of birth different to that of the descendant, so mixed background also disappears from the statistical view.
The base population broken down by background can finally be estimated as follows: the number of foreign-born persons is taken (or estimated) from available statistics and considered as representative of the population with a foreign background; the population with a national background is calculated as residual from the total population. Although the errors work in both directions (national background persons included in the foreign background category and vice versa), it is reasonable to think the bias to be
unfavourable for the population with a
foreign background, as for EU
countries, it is likely that the group of native-born descendants of foreign-born persons is bigger than the group returning to the country of birth of their parents. However, these simplifying assumptions on the breakdown of the base population are necessary only for the beginning of the projections period, as during the computation of the projections, it is possible to control the background by attributing newborns to the proper category. Moreover, it is best to limit in time the concept of background itself. The more generations are considered regarding ancestors, the more likely it is that (at least) mixed background will be found, not to
mention changes of a country’s
geographical borders, or even their dissolution (3). From this point of view, it could make sense to implement a rule
according to which the foreign
background is limited to a fixed number of generations. If instead the purpose is to assess the overall future contribution of migration to demographic dynamics, then the background — once attributed — could be considered unchangeable. In this case, for the reasons mentioned above, it may be acceptable to start from a ‘time zero’ in which there is no present stock of descendants, and therefore the influence of migration is limited to that of current migrants and their descendants, as if these migrants had just arrived in the country. For projections, this ‘time zero’ may correspond to the time of reference of the base population.
(3)For instance, how to classify the persons born in
Czechoslovakia, within the territory of the current Czech Republic from parents born in the current Slovakia? In general, according to international recommendations, census data should refer to the current borders; however, it is not certain that such practice is applied during the collection of information about vital events.
The projections by f/n background of this study will thus be based on information by country of birth and cover the period from 1 January 2008 to 1 January 2061. The countries (4) included in this study are the 27 Member States (MS) of the European Union (EU): Belgium (BE), Bulgaria (BG), Czech Republic (CZ), Denmark (DK), Germany (DE), Estonia (EE), Ireland (IE), Greece (EL), Spain (ES), France (FX), Italy (IT), Cyprus (CY),
Latvia (LV), Lithuania (LT),
Luxembourg (LU), Hungary (HU), Malta (MT), the Netherlands (NL), Austria (AT), Poland (PL), Portugal (PT), Romania (RO), Slovenia (SI), Slovakia (SK), Finland (FI), Sweden (SE) and the United Kingdom (UK). In particular, data for France refer to Metropolitan France, thus excluding the French Overseas Departments (DOM) and Overseas Territories (TOM), and
data for Cyprus refer to the
government-controlled area.
These projections are nested within the Eurostat Population Projections 2008-based (EUROPOP2008), covering all EU Member States for the same period. The EUROPOP2008 are often used for official purposes and can thus be considered as a reference for projections for EU countries. Its methodology and main results are presented elsewhere (Lanzieri, 2009) and are therefore not replicated here. For each country, the base population of EUROPOP2008 has been adopted as the total base population to be broken down by f/n background. Its assumptions for fertility have been used where they were not assumed to be different by background. Those for mortality and migration were
(4) The countries are sorted following the official EU
protocol order (based on the alphabetical order of the country name in the country-specific language) and with the official abbreviations. It is by this order that data on these countries are usually listed in the EU publications.
also taken from EUROPOP2008. The choice of nesting within the Eurostat projections has some methodological implications, which will be described later in this paper.
The description of the method used to disaggregate the total base population by f/n background is given below; assumptions by the same breakdown have been considered for fertility and migration, but not for mortality. In order to compute projections by f/n background, four models have been developed, corresponding to different assumptions. As clarified above, in this study, due to lack of data, mixed background is not considered. Thus, as these projections consider live births only from the mother’s side, the case of a person born of a foreign-born father and a native-born mother is considered equal to the case of a birth in which both parents are native-born, and vice versa. The calculations have been executed using LIPRO 4.0 software (van Imhoff, 1999).
Population estimates
Although a provisional estimate of the number of persons born of parents born abroad was available from the Labour Force Survey ad-hoc module 2008 for the EU, it was not possible to have reliable information by age and sex. Considering that the structure of this sub-population may be different to the foreign-born population, and given concerns about the robustness of these estimates, this information has been used for only one model.
Therefore, as explained above, the country of birth has been adopted as a proxy of the f/n breakdown, and only the two major categories have been considered: native-born and foreign-born persons. Eurostat has recently started collecting data on population
stocks by country of birth, in compliance with a recently-issued EU regulation. The first official data, available for most EU Member States, refer to 1 January 2009. However, in order to preserve consistency with EUROPOP2008, it is necessary to disaggregate on 1 January 2008. The estimate of the foreign-born population on 1 January 2008 has been made by cohort interpolation between the foreign-born population as available from the MIMOSA project (5) for the year 2007 and the very first available figures that countries transmitted to Eurostat on population by country of birth on 1 January 2009. Estimating with data from two different sources may be less accurate, and therefore results should not be considered uncritically.
The four models
The projections by f/n require some simplifying assumptions. In order to assess the differential effect for some of them, various sets of assumptions have been implemented, each of them adding a further/different element to the previous model. The first model
assimilates migrants from the
3rd generation onwards to the native-born population. Thus, persons with a national background are all native-born persons, except for those whose mother was born abroad. However, such a model does not entirely show the long-term contribution of migration to population change. To meet this need, model 2 considers all descendants from foreign-born mothers, regardless of their generation, as persons with a foreign background. For these two
(5) The ‘MIMOSA: Modelling of statistical data on
migration and migrant populations’ Research Project is funded by the European Commission. Project 2006/S 100-106607/EN. Project’s website: http://mimosa.gedap.be.
models, assumptions on vital events are taken entirely from EUROPOP2008, with no distinction by background. Yet it is a common view that the two population subgroups (f/n background) have different demographic behaviour, although there are different opinions regarding the speed of the demographic convergence — if any — of the foreign-background persons to the hosting
population. Then, model 3 adds
different fertility assumptions for the
national and foreign-background
subgroups; unfortunately, here the scarcity of data does not allow full coverage of the EU Member States. The last model, number 4, tries to provide a comprehensive appraisal of the full contribution of migrants by including in the base population available estimates of the irregular foreign resident population and of the stock of second generation migrants. Therefore, model 1 and model 2 differ only in the way the descendants of migrants are classified, model 3 incorporates differential fertility in model 2, and model 4 adjusts the base population of model 3: each model is a potential improvement on the previous one but, at the same time, brings in further weaknesses due to concerns about the reliability of the input data. Details about data and assumptions in each model are given below.
Model 1
In the first model, the population in each country is broken down into three categories: persons with a national background, foreign-born persons and second generation migrants. The main assumptions in this model are the following:
a) there are no second generation migrants on 1 January 2008; b) there are no persons with mixed
background;
c) the sum of foreign-born persons present on 1 January 2008 and following second generation migrants composes the group of
persons with a foreign
background;
d) the sum of the native-born persons present on 1 January 2008, their descendants and
descendants from second
generation migrants composes the group of persons with a national background;
e) the same assumptions on
fertility and mortality, borrowed
from EUROPOP2008, have
been applied to each category; f) immigrants are assumed to be
90 % foreign background and 10 % national background; g) emigrants are assumed to be
67 % foreign background and 33 % national background; h) second generation migrants do
not migrate.
Assumption a) is due to lack of proper information on the structure of this subpopulation. Assuming that there are no second generation migrants has the
effect of reducing the overall
contribution of migration to the population change. Assumption e) allows disentangling of the effect of the population structure and migration assumptions from fertility and mortality differentials. The difference in size
between foreign and national
background groups is thus the combined effect of the age and sex structure of the related base populations plus the cumulative impact of the migratory flows. Assumptions f) and g) distribute the migration flows between the sub-populations. The proportions proposed are based on average EU values of migratory flows by country of birth observed in 2008.
Although these proportions may be rather different for specific countries, common values have been chosen to avoid adding a further element of differentiation across countries without solid bases. In addition, even if the
latest observed proportions are
different, it could be assumed that in future, the bulk of the migratory flows will be composed of persons with a foreign background, because their propensity to mobility may be higher than that of the native population. However, the reader should be aware that the results are rather sensitive to
these assumptions on migratory
flows (6): extreme caution should therefore apply when using the results
of these projections. Some
complications arise from the treatment of second generation migrants, and the choice of foreign-born vs. foreign
background in the migration
assumptions deserves a clarification. Let us consider the case of a second generation migrant (thus born in the country under analysis): if (s)he migrates, is an emigrant with a foreign
background but native-born; if,
afterwards, (s)he immigrates back into the same country, (s)he may be considered to be an immigrant with a national background (as (s)he was born there). Indeed, if immigration flows are distributed by country of birth, a second generation migrant would be attributed
to the group with a national
background, inflating the size of this group.
If immigration is instead correctly distributed by background, the projected
(6) A test carried out for a few countries has shown that
simply changing the proportion of emigrants belonging to the native-born group from 50 % to 33 % (and obviously vice versa for the foreign-born persons, from 50 % to 67 %) may reduce the proportion of persons with foreign background of several percentage points at the end of the projections period.
live births from second generation migrant women should be classified as being of national background and not with a foreign background. Therefore, it makes a difference if immigrants with a foreign background are of the first or second generation. As there is no stock of 2nd generation migrants for 2008, considering the potential implication described above and the fact that no information is available on the migratory behaviour of this group, assumption h) simplifies the framework without harming the overall results. In fact, assumption c) gathers in one single group the two categories and no distinction is apparent between them in the final results; assumption d) is simply complementary to the previous assumption.
Still, foreign-born migrants may include persons born abroad from native-born mothers, thus persons actually of national background (7). Hence,
migration assumptions based on
empirical data by country of birth need
to be formally translated into
assumptions by background, although originally expressed in terms of native- and foreign-born. Alternatively, it could
be assumed that foreign-born
immigrants are all of foreign
background (8). A final simplification is necessary for persons with mixed background: given the lack of proper data about them, it is indeed assumed in b) that there is no person with such characteristics and therefore all live births belong to the same group as the mother (with the exception of the 3rd generation of migrants, see assumption d).
(7) The inverse case is not possible, as a native-born
immigrant with foreign background is by definition a second generation migrant, who does not migrate by assumption.
(8) The corresponding assumption for native-born persons is
Model 2
In the second model, the population in each country is broken down into only two categories: persons with a national background and persons with a foreign background. The main assumptions of this model are similar to those of model 1 and are listed here below:
a) there are no persons with mixed background;
b) there are no descendants from foreign-born persons born in the country before 1 January 2008; c) the sum of foreign-born persons
present on 1 January 2008 and all their descendants composes the group of persons with a foreign background;
d) the sum of native-born persons present on 1 January 2008 and all their descendants composes the group of persons with a national background;
e) the same assumptions on
fertility and mortality, borrowed
from EUROPOP2008, have
been applied to each category; f) immigrants are assumed to be
90 % of foreign background and 10 % of national background; g) emigrants are assumed to be
67 % of foreign background and 33 % of national background. The main difference with model 1 is in the classification of descendants of second generation migrants, who are here considered to belong to the population with a foreign background. To put it more simply, in model 2, persons with a national background are those who have no ascendants (9) born abroad, while persons with a foreign background have at least one ascendant
(9) Although this rule should formally apply only to
mothers, the assumption on the absence of persons with mixed background makes irrelevant this further
specification: any mother would indeed be accompanied by a father of the same group.
born abroad. Therefore, model 2 allows analysis of the full contribution of
migration to the demographic
development of a country. For instance, a person whose grandmother was born abroad would not be there if migration had not taken place two generations earlier.
Model 3
The next step is based on the acknowledgment that the two categories (f/n background) may have different demographic behaviours. Information regarding this is unfortunately scarce and sometimes of questionable quality. Eurostat has recently started to collect annually vital events by country of birth
and/or citizenship of European
countries. Being on a voluntary basis, unfortunately this data collection does not cover all EU Member States. Furthermore, as it has been run only very few times, it is still too early to make a well-founded assessment of the reliability of these data.
Bearing these caveats in mind, Table 4 presents estimates of the total fertility rate and of the mean age at childbirth by country of birth group in 2007 for countries for which these are available. Where this information was not available, these indicators have been calculated by citizenship group. As can be noted, only for 10 countries was it possible to use the classification by country of birth, and for a further nine,
the proxy based on citizenship
(national/foreigner) has been computed instead; for the remaining eight
countries, none of the two
classifications was available, or the results were considered too unlikely. It must be said that where the information was available by both country of birth and citizenship, the indicator by citizenship was not always a close proxy of the indicator by
country of birth. Therefore, great prudence should be used with these data. Looking at the total fertility rate, in general, the values for the foreign-born persons are higher than for the native-born; however, for a few countries, this rule does not apply: Denmark, Estonia, Hungary and Malta reveal a higher fertility for native-born persons. Unfortunately, always under
the assumption that the input data used were fair estimates, the data available did not allow testing as to whether this was an occasional outcome, or the result of a structural (positive) difference. Similarly, the mean age at childbirth in 2007 is lower in the foreign-born (or foreigner) population, with a few exceptions.
Table 4:Total fertility rate (TFR) and mean age at childbirth (MAC) by group of country of birth or citizenship (*) TFR native-born TFR foreign-born MAC native-born MAC foreign-born TFR native-born TFR foreign-born MS Type 2007 2007 2007 2007 2060 2060 BE Country of birth 1.58 3.04 29.8 29.1 1.68 2.60 BG Citizenship 1.41 2.65 26.6 28.9 1.57 2.35
CZ None n.a. n.a. n.a. n.a. n.a. n.a.
DK Country of birth 1.86 1.76 30.5 30.9 1.86 1.79
DE Citizenship 1.33 1.64 30.0 29.2 1.52 1.72
EE Country of birth 1.64 1.57 28.7 28.1 1.72 1.67
IE None n.a. n.a. n.a. n.a. n.a. n.a.
EL Citizenship 1.33 1.99 30.8 26.7 1.52 1.94
ES Citizenship 1.33 1.79 31.8 28.2 1.52 1.81
FX None n.a. n.a. n.a. n.a. n.a. n.a.
IT Citizenship 1.28 2.40 31.7 28.0 1.49 2.19
CY Citizenship 1.32 1.70 30.5 28.6 1.52 1.76
LV None n.a. n.a. n.a. n.a. n.a. n.a.
LT Country of birth 1.35 1.44 27.9 28.1 1.53 1.59 LU Citizenship 1.64 1.67 31.1 29.7 1.72 1.74 HU Citizenship 1.32 1.26 28.8 28.6 1.51 1.48 MT Country of birth 1.38 1.27 28.6 28.5 1.55 1.49 NL Country of birth 1.71 1.85 31.0 30.1 1.76 1.85 AT Country of birth 1.25 1.90 29.7 28.6 1.47 1.88
PL None n.a. n.a. n.a. n.a. n.a. n.a.
PT Citizenship 1.28 2.15 29.6 29.4 1.49 2.04
RO None n.a. n.a. n.a. n.a. n.a. n.a.
SI Country of birth 1.38 1.53 30.0 28.3 1.55 1.65
SK None n.a. n.a. n.a. n.a. n.a. n.a.
FI Country of birth 1.82 2.04 30.1 29.5 1.83 1.97 SE Country of birth 1.82 2.20 30.9 29.9 1.83 2.07
UK None n.a. n.a. n.a. n.a. n.a. n.a.
(*) n.a.: not available.
The age patterns by country of birth/citizenship summarised in Table 4 have been assumed to be representative of the age profiles by background. To
build assumptions for future
developments of fertility, the age patterns of fertility rates for 2007 have been modelled with Schmertmann’s method (Schmertmann, 2003, 2005) and then assumed to slowly converge to common values in the future. The assumption of convergence is central in
the EUROPOP2008 projections
(Lanzieri, 2009, 2010) and it is therefore consistently applied to their breakdown by f/n background. The values assumed for the total fertility rate in 2060 are shown in Table 4. To ensure consistency with the results of EUROPOP2008, a constraint (10) has been implemented in the projections calculation. This imposes the number of live births by sex from national and foreign background persons to be equal to the projected number of live births by sex as from EUROPOP2008. In other words, the overall number of projected live births is in fact given by
EUROPOP2008, and the current
projections provide their breakdown by background in accordance with the assumed age fertility patterns.
Information on mortality differentials by country of birth is even more limited and probably less reliable. Considering the number of potential difficulties, both conceptual and empirical, it was considered preferable not to develop specific assumptions broken down by f/n background and to apply instead the
assumptions developed in
EUROPOP2008 to both groups.
(10) For details about the implementation of consistency
rules in LIPRO, see Van Imhoff and Keilman (1991).
The assumptions for model 3 can thus be summarised as follows:
a) there are no persons with mixed background;
b) there are no descendants from foreign-born persons born in the country before 1 January 2008; c) the sum of foreign-born persons
present on 1 January 2008 and all their descendants composes the group of persons with a foreign background;
d) the sum of native-born persons present on 1 January 2008 and all their descendants composes the group of persons with a national background;
e) specific assumptions on fertility
by background have been
developed for each group, based on the idea of convergence and with results consistent with EUROPOP2008;
f) the same assumptions on
mortality, borrowed from
EUROPOP2008, have been
applied to each category;
g) immigrants are assumed to be 90 % of foreign background and 10 % of national background; h) emigrants are assumed to be
67 % of foreign background and 33 % of national background. The only difference to model 2 is thus the adoption of different fertility assumptions for the national and foreign
background populations. Although
intended to be closer to reality, the scarcity of information makes these assumptions even more subject to errors, and results should be used with caution. Model 3 is computed only for those countries for which fertility assumptions by f/n background are available.
Model 4
It is sometimes claimed that official figures on migrants underestimate the real size of the phenomenon. The CLANDESTINO (11) research project, concluded in 2009, made an attempt to provide estimates of the irregular foreign resident population in the EU and aggregated values for 2008 are available from Kovacheva and Vogel (2009). Model 4 therefore tries to be based on a more comprehensive estimate of the current stock of migrants. For the purposes of these
projections, the minimum and
maximum estimates published in the report have been averaged and equally divided by sex. These totals by sex have then been distributed in the foreign-born base population in proportion to the corresponding age structure. Native-born populations have been adapted accordingly to maintain consistency with the total base population as in EUROPOP2008.
The base population has been further tailored to include a partial estimate of the stock of second generation migrants in 2008. Very provisional data from the Labour Force Survey ad hoc module 2008 on migrants estimate the share of persons with one or both parents born abroad at about 5 % in the total population aged 15-64 years for the EU (12). That proportion has been applied in each country to the pertinent population to obtain the size of the stock of second generation migrants aged between 15 and 64 years. This incomplete estimate has been added to the foreign-born persons (as calculated
(11) The ‘CLANDESTINO: Counting the Uncountable —
Data and Trends across Europe’ Research Project is funded by the European Commission, DG Research, 6th
Framework Programme, Priority 8 — Scientific Support to Policies. Project’s web site: http://clandestino.eliamep.gr . (12) More precisely, the provisional estimate is 5.4 % for
males and 5.3 % for females.
above, including the irregular migrants) to obtain a stock of the population with foreign background including at least some second generation migrants; again, the native-born populations have been adapted accordingly to maintain consistency with the total base population as from EUROPOP2008. The assumptions for model 4 are thus the following:
a) the base population for persons with a foreign background includes irregular migrants and second generation migrants aged 15-64 years;
b) there are no persons with mixed background;
c) the sum of foreign-born persons present on 1 January 2008 and all their descendants composes the group of persons with a foreign background;
d) the sum of native-born persons present on 1 January 2008 and all their descendants composes the group of persons with a national background;
e) specific assumptions on fertility
by background have been
applied to each group;
f) the same assumptions on
mortality, borrowed from
EUROPOP2008, have been
applied to each category;
g) immigrants are assumed to be 90 % of foreign background and 10 % of national background; h) emigrants are assumed to be
67 % of foreign background and 33 % of national background.
The difference from model 3 is
therefore only in the different base populations. However, calculations have also been carried out for countries for which no differential fertility was available, to show at least the impact of this assumption on the projected share
of persons with a foreign background.
For these countries, fertility
assumptions are borrowed from
EUROPOP2008 as in model 2.
Results
As the projected values for the total population, calculated as the sum of the populations with national and foreign background, are — by methodology — equal to those of EUROPOP2008, results will be given for the population with a foreign background, which is the main point of interest in this study. Readers interested in the outcomes for the total population may refer to Lanzieri (2009).
Results from the various models are reported in the Annex, in Table 5 and 5bis, focusing on the share of persons with a foreign background at the beginning of each decade over a time span of 50 years. By using data from
EUROPOP2008 (13), due to the
consistency with that set of projections, the reader can easily calculate the size of the two groups of subpopulation, even broken down by broad age group (14). When the share of persons with a foreign background is greater or equal to 50 %, the value is reported in red bold.
Table 6 and 6bis present the
demographic balances of the population with a foreign background for each country over the period 2008-2061 according to each of the four models. The column reporting the cumulated values of net migration is shown on the left and is not duplicated, as these values do not change from one model to another. Demographic balances for the population with a national background
(13)Freely available at Eurobase, the Eurostat database: http://epp.eurostat.ec.europa.eu.
(14) Detailed results by country, single year, single age, sex
and background for any of the four models are available upon request.
can be easily derived by subtracting the
values in Table 6 from the
corresponding values for
EUROPOP2008 (as, for instance,
reported in Table 2 in Lanzieri, 2009). On the results from model 4, it should be kept in mind that for Czech Republic, Ireland, France, Latvia, Poland, Romania, Slovakia and the United Kingdom, the same fertility assumptions have been applied for both foreign and national backgrounds, so the outcomes for these countries are not strictly comparable to the others. In fact, only for 10 countries (Belgium, Denmark, Estonia, Lithuania, Malta, the Netherlands, Austria, Slovenia, Finland and Sweden) are the input data used across the four models fully consistent (with due concerns about the reliability of the estimates). For the other nine countries, i.e. Bulgaria, Germany,
Greece, Spain, Italy, Cyprus,
Luxembourg, Hungary and Portugal, fertility assumptions by f/n background have been calculated on the basis of fertility rates by citizenship as proxy. For the sake of brevity, the description of the main results here is mostly limited to model 1. In the EU, the share of persons with a foreign background, as composed by first and second generations of migrants, is projected to increase by 16 percentage points in half a century, reaching over 133 million persons in 2061. However, the results are rather different by country.
In general, those with low fertility and higher migration flows will experience larger increases; while countries with limited or negative migration flows will have modest increases or even a decrease in the share of persons with a foreign background. Indeed, though these results are obviously influenced by the size and structure of the population of foreign-born persons present in the countries at the beginning of the projections period, future
migratory flows make the real
difference (15).
The wide variation across countries is evident looking at the increase of their share of the total population between 2011 and 2061, as displayed in Figure 1.
For 2011, Cyprus has a share
comparable to those of Ireland and Estonia, but, unlike them, it has a ‘sky-rocket’ increase of the population with a foreign background. Looking at the migration assumptions, for each person of foreign background in 2008, in 53 years, Cyprus is assumed to receive a cumulative net surplus of 3.9 migrants, against 2.1 for Ireland and 0.2 for Estonia (see Table 6). For 2011, there is only one country (Luxembourg) with more than 30 % of persons with a foreign background. By 2061, nine countries are projected to cross this threshold. By the same year, in only six countries will there be less than 10 % of
the population with a foreign
background.
Figure 1: Projected share of foreign background persons in the EU Member States
according to model 1, sorted by size of the difference between 2011 and 2061 (%)
0 10 20 30 40 50 60 70 CY LU AT ES DE IT PT DK EL UK IE BE CZ SI SE Avg MT NL HU FI LT BG FX RO SK PL EE LV 2011 2061
Source: calculations of the author.
(15) In the model 1, fertility (like mortality) is assumed to be equal for both the population with national background and foreign
However, analysing the results for intermediate years, it emerges that in most countries, growth in the share of
the population with a foreign
background slows down during the projection period. This is the case for Belgium, Denmark, Ireland, Greece,
Spain, France, Italy, Cyprus,
Luxembourg, Malta, the Netherlands, Austria, Portugal, Slovenia, Finland, Sweden and the United Kingdom. In Cyprus and Luxembourg, persons with a foreign background are projected to become the absolute majority, in the latter much earlier than in the former. In Germany, Ireland, Spain and Austria, their share in 2061 is more than one third of the total population (16). As noted above, in these six countries, as in all others considered here, the increase in the population with a foreign background is mainly fed by migratory
flows (see Table 6), as their
subpopulations will experience — in this scenario — negative natural changes during the projection period (with the exception of Denmark and the
United Kingdom) and their net
migration is bigger each year than natural change. Estonia and Latvia are the only two countries where the share (and size) of the population with a foreign background is projected to decrease. For both countries, most of these persons are estimated to belong to older age classes, and therefore do not contribute (or contribute less) to fertility, while they enter age classes with a higher risk of death relatively early in the projection period.
The distribution by age shows the greater impact on the younger age
(16) It should be noted that, for the majority of the EU Member States, the total population is projected to decline in the next 50 years: in Germany this is already occurring, in Spain the decline is projected to start in 2045 and in Austria in 2046 (see the Table 4 in Lanzieri, 2009).
classes. In about half the countries (Belgium, Denmark, Ireland, Spain, France, Italy, Cyprus, Luxembourg, the Netherlands, Austria, Finland, Sweden and the United Kingdom), the size and the share of persons with a foreign background increases in the first part of the projections period in the age group 0-14 years old and then decreases. It reaches more than one third of the total population aged 0-14 years in Ireland, Spain, Cyprus, Luxembourg (where it represents the absolute majority for a long period) and Austria.
Looking at the age group 15-39 of persons with a foreign background, the younger working-age population group, its relevance decreases only in the last period of projections in Belgium, Denmark, Ireland, Spain, France, Cyprus, Luxembourg, the Netherlands, Finland, Sweden and the United Kingdom. In all the remaining countries except Lithuania, the increase in their share slows down in the same period. This age group reaches higher shares in 2061 than the others. In Belgium, Denmark, Germany, Ireland, Greece, Spain, Italy, Portugal, Slovenia and the United Kingdom, the population with a foreign background is well over a third of the total population in 2061. In Austria it is the majority, and in Cyprus and Luxemburg, it is close to two-thirds.
The age group 40-64 follows a different pattern. With the exception of a few countries, the share of persons with a foreign background in the total population grows more slowly in the first part of the projections period and then accelerates in the latter part. Again, Belgium, Denmark, Germany, Ireland, Greece, Spain, Italy, Austria, Portugal, Sweden and the United Kingdom show shares above one third of the total population in 2061, and Cyprus and
Luxembourg reach 60 % and 72 % respectively. In several countries of Eastern Europe and in the Baltic countries, the oldest age group, composed of persons aged 65 years and over, reduces its share, constantly or for at least a part of the projections period. Only in Ireland, Spain, Cyprus and Austria does it become more than one third of the total population. In Luxembourg, the elderly with a foreign
background are projected to be two-thirds of the total population in 2061. The projected trends for the whole EU show (Figure 2) the increase of the share of the population with a foreign background in the total population for all the age groups. Of the 133 million of first and second generation migrants, 33 million are projected to be aged over 65 years in 2061, and 87 million will be of working age.
Figure 2:Projected share of the population with foreign background in the EU by age group — model 1 (%) 0 5 10 15 20 25 30 35 2008 2012 2016 2020 2024 2028 2032 2036 2040 2044 2048 2052 2056 2060 0-14 15-39 40-64 65+
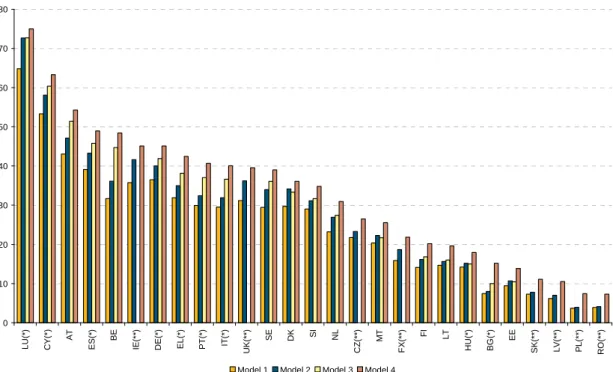
Figure 3:Projected share of the population with foreign background on 1 January 2061 by country and model, sorted by value according to model 4 (%)
0 10 20 30 40 50 60 70 80 L U (* ) C Y (* ) A T E S (* ) B E IE (* *) D E (* ) E L (* ) P T (* ) IT (* ) U K (* *) S E D K SI N L C Z (* *) M T F X (* *) FI LT H U (* ) B G (* ) E E S K (* *) L V (* *) P L (* *) R O (* *)
Model 1 Model 2 Model 3 Model 4
(*): results for model 3 using fertility by citizenship (**): results for model 4 without fertility differentials Source: calculations of the author.
Figure 3 introduces results from the other models. In general, passing from one model to the next increases the share of persons with a foreign background, except in the case of model 3 for the countries where this subpopulation has fertility rates lower than the population with a national
background (Denmark, Estonia,
Hungary and Malta). If one were to adopt model 4, only two countries would present shares lower than 10 %, and 15 would be above 30 %, of which three even go above 50 %. At EU level, the number of persons with a foreign background would then be more than 174 million, 40 million more than the value projected by model 1. In model 4, 10 countries present one or more of the younger broad age groups composed for the majority of persons with a foreign background. In fact, most of the
differences in these age groups already emerge in passing from the model 1 to the model 2, where it changes the statistical treatment of the descendants of foreign-born persons. After a couple of decades, differences become evident for the age group 0-14, and after 3-4 decades for the age group 15-39. However, no changes occur for the shares of the older age groups between the two models, due to the time horizon of the projections. Persons with a foreign background would contribute 42 % of live births in 2060, against 26 % in 2008.
Explicitly considering the f/n
background allows the contribution of migration to be shown more clearly. Taking Austria as example, assuming a flow of net migration of about 28 000 persons per year, this cumulates to 1.5 million persons by 2060, representing
only 18.0 % of the base population in 2008. If the indirect effects (as estimated by means of the No-Migration variant of EUROPOP2008) are taken into account, then these migrants generate an additional gain of 1 million persons, for an overall total effect of 2.5 million persons at the end of the period, which represents 30.1 % of the base population in 2008 and 27.8 % of the population in 2061. However, when the estimated stock of 1.2 million foreign-born persons in 2008 enters the picture, the share of persons with a foreign background at the end of the projection period rises to about half the Austrian population. This highlights the fact that in setting
assumptions for the projections
exercises, care should be taken regarding the implications and effects of the hypothesis on future migration flows. For instance, the migration assumptions in EUROPOP2008 project a reduction in net migration into Austria in the future, from a level around 33 000 in 2008 to a level around 22 000 in 2060. At a first glance, this may look less plausible than an upward trend, especially considering the ongoing ageing process, the shrinkage in the working-age classes and the (expected)
negative natural change. These
assumptions project the negative natural change in the Austrian population as postponed to 2016, and its decline to 2046. When the overall impact is taken into account, then it may be noted how
even prudent assumptions may,
combined with the assumptions on fertility and mortality, imply relevant challenges for hosting societies: in Austria, the share of persons with a foreign background in the total
population aged 15-39 years is
estimated to be 19 % in 2008 (17) (15 % in 2002) and is projected to reach values between 51 % and 64 % by 2061, depending on the model.
Overall, the increase in the number and share of persons with a foreign background may take place at different speeds and to different extents in different Member States. As may be noted in Table 5 and 5bis, certain countries may experience over several decades what other countries may already have to deal with in the near future. This would give them the potential advantage of benefiting from best practices at international level in terms of integration policies. On the other hand, other countries may need to develop proper policies quickly to deal
with ‘higher-than-expected’
contributions from migrants to
demographic developments.
The particularly high results obtained for some countries may raise the question about how realistic such outcomes are. Projecting the population with a national background to change to a position of minority in its own country, or even estimating relevant quotas of persons with a foreign background, means to portray a situation that has never occurred in the past (at least, not in the recent past), with unforeseeable social consequences. Yet the framework assumptions (those referring to the total population) may be considered as plausible, and the assumptions formulated specifically for the breakdown by background are based on the available observed data. For
instance, in model 1 (the most
conservative as far as results are concerned), the only elements which could be modified are the estimates of
(17) Value for the first three models; 25 % if model 4 is
the base population by background and the proportion of migratory flows attributed to the national and foreign background populations. The results seen are rather sensitive to this latter factor and therefore, for countries where the share of persons with a foreign background is considered to grow implausibly, they could be a lever on which to play to make adjustments to more conventional values.
Apart from the general consideration that the future may not necessarily look like the present (e.g., a few decades ago, several EU countries were essentially emigration countries and fertility was at much higher levels), the values assumed for the present study do not present large margins of action: higher quotas of immigration of persons with a national background would in principle be interpreted as return migration, and therefore their age structure would be older than that of ‘common’ migrants, probably with a limited effect on fertility. Smaller quotas of emigration with a national background could be acceptable (although emigration is
necessary to ‘feed’ the return
migration), but must have some empirical basis.
Looking at the countries with the highest shares in 2061, Cyprus and Luxembourg, the former does not have empirical data for 2008, and the latter has an (estimated) lower emigration quota for persons with a national background, but a lower immigration
quota as well. Considering the
weaknesses of information available on migration flows, and especially on emigration, it has been chosen to set a common assumption valid for all countries based on the average EU values estimated for 2008. While it is clear that the results have to be interpreted with caution, due to their sensitivity to the assumptions, at the same time they should hopefully be slightly more robust as they have the widest possible empirical basis. It should not be forgotten that these projections are the outcomes of what-if scenarios; thus, they show what would happen if certain conditions hold.
Conclusions
Whichever model is adopted, from the results it emerges that the European
Union is going to experience
unprecedented changes from the point of view of population composition. Without the contribution of migration, the population dynamic in several countries would be much less positive. On the other hand, the ever-increasing share of persons with a foreign background will represent a challenge for integration policies in hosting countries. However, the growth of populations with a foreign background is not self-sustained, as the assumed migratory flows (and their breakdown
by f/n background) still play a major
role for their demographic
developments in the period under consideration. Although for some specific groups this may no longer be the case (Finney and Simpson, 2009), at aggregated level and with all necessary simplifications (18), the prominent role of natural change for the growth of populations with a foreign background does not emerge.
While it should not be forgotten that these are the outcomes of a number of
(18) For instance, fertility rates may be very different from
assumptions sometimes based on data of uncertain reliability, these (overall) migration assumptions have sometimes been considered too conservative. From the methodological point of view, these projections by f/n background also show that consideration should be given to the full effects (direct and indirect) of
migration flows when building
assumptions. Furthermore,
complications arising from the use of proxy variables for the concept of
background should not be
underestimated.
The renewal of the labour force is undoubtedly expected to come from migration. The European Union would see its group of persons aged 15-39 years with a national background decreasing in size to about 50-60 million (19) from about 140 million; at the same time, the number of those with a foreign background would more than double, without fully compensating for that loss. The younger age classes are those where the most relevant changes are projected, but this is also explained by the time window considered in this study: in 53 years, from 2008 to 2061, most newborns will not have completed their life cycle, and their impact on the composition of the older age classes is not yet visible. Another consequence is that the process of ageing, which obviously concerns persons with a foreign background, does not fully display its effects, so only the positive demographic bonus of migration is considered.
The above applies for the European Union as a whole. At country level, a clear geographical divide emerges (see Figure 4 and Figure 5). The weight of
the population with a foreign
(19) The precise value depends on the model and it has thus
just been indicated a broad range.
background will grow to a very different extent in different EU Member States: most of the Mediterranean and Central-Northern Europe countries will see their share rising to values above one third, and in some cases, much higher. On the other hand, Eastern EU and Baltic countries will hardly go above the levels that some are already
experiencing today. A striking
exception in the first group of countries is France, which due to (relatively) high fertility and low migration sees the share of persons with a foreign background growing only by about 4-7 percentage points. Therefore, similarly to ageing, the increase of population diversity seems certain, but its extent and speed vary considerably among different countries. A few Member States are projected to have the absolute majority of the population (or of some age groups) composed of persons with a foreign background.
Considering the recent past, this is definitely a new demographic situation for these countries. How likely these results are and whether this may give origin to xenophobic reactions from hosting populations is not discussed here; neither is the fact that migrants tend to be distributed unevenly within national territories (20); nor the important (and increasing) role of mixed unions. Nevertheless, it can be concluded that, according to this projections scenario, in a few decades, several countries will have to deal with relevant social changes. The growing diversity of the European population could therefore be considered a major socio-demographic challenge for the
current century. As seen in
EUROPOP2008, some European
(20) For an application at regional level, see, for instance,
populations may decline, but they are certain to age, and the current set of projections by background reveals the multicultural character of the future for most EU countries.
References
Coleman, D., 2006: ‘Immigration and Ethnic Change in Low-Fertility Countries: A Third Demographic Transition’. Population and Development Review, 32(3):401-446.
Coleman, D., 2009: ‘Divergent Patterns in the Ethnic Transformation of Societies’.
Population and Development Review, 35(3):449-478.
Finney, N., and L. Simpson, 2009: ‘Population Dynamics: The Roles of Natural Change and Migration in Producing the Ethnic Mosaic’. Journal of Ethnic and
Migration Studies, 35(9):1479-1496.
Kovacheva, V., and D. Vogel, 2009: ‘The size of the irregular foreign resident population in the European Union in 2002, 2005 and 2008: aggregated estimates’. Hamburg Institute of International Economics, Database on Irregular Migration, Working Paper No 4/2009.
Kupiszewska, D., and J. Bijak, 2009: ‘Estimation of population stocks by country of birth, sex and age for 1st January 2002–2007’. MIMOSA Project 2006/S 100-106607/EN, LOT 2: Modelling of statistical data on migration and migrant populations.
Lanzieri, G., 2008: ‘Population in Europe 2007: first results’. Eurostat Statistics in
Focus 81/2008.
Lanzieri, G., 2009: ‘EUROPOP2008: a set of population projections for the European Union’. Paper for the XXVIth IUSSP International Population Conference, Marrakech, October 2009.
Lanzieri, G., 2010: ‘Is fertility converging across the Member States of the European Union?’. In "Work Session on Demographic Projections, Lisbon 28-30 April", p.137-154. Eurostat Methodologies and Working Papers, 2010 edition. DOI: 10.2785/50697
Perez, A.D., and C. Hirschman, 2009: ‘The Changing Racial and Ethnic Composition of the US Population: Emerging American Identities’. Population and
Development Review, 35(1):1-51.
Planelles, J., S. Bermúdez and J.A. Hernandéz, 2010: ‘Sub-national and foreign-born population projections. The case of Andalusia’. In "Work Session on Demographic Projections, Lisbon 28-30 April", p.407-417. Eurostat
Methodologies and Working Papers, 2010 edition. DOI: 10.2785/50697
Schmertmann, C.P., 2003: ‘A system of model fertility schedules with graphically intuitive parameters’. Demographic Research, 9:81-110.
Schmertmann, C.P., 2005: ‘Quadratic spline fits by nonlinear least squares’.
Demographic Research, 12:105-106.
Tsimbos, C., 2008: ‘Immigrant and Native Fertility in Greece: New Estimates and Population Prospects’. Population Review, 47:67-84.