HAL Id: hal-02474486
https://hal.archives-ouvertes.fr/hal-02474486
Submitted on 13 Feb 2020
HAL is a multi-disciplinary open access
archive for the deposit and dissemination of
sci-entific research documents, whether they are
pub-lished or not. The documents may come from
teaching and research institutions in France or
abroad, or from public or private research centers.
L’archive ouverte pluridisciplinaire HAL, est
destinée au dépôt et à la diffusion de documents
scientifiques de niveau recherche, publiés ou non,
émanant des établissements d’enseignement et de
recherche français ou étrangers, des laboratoires
publics ou privés.
Comparison of telephone recordings and professional
microphone recordings for early detection of Parkinson’s
disease, using mel-frequency cepstral coefficients with
Gaussian mixture models
Laetitia Jeancolas, Graziella Mangone, Jean-Christophe Corvol, Marie
Vidailhet, Stéphane Lehericy, Badr-Eddine Benkelfat, Habib Benali, Dijana
Petrovska-Delacretaz
To cite this version:
Laetitia Jeancolas, Graziella Mangone, Jean-Christophe Corvol, Marie Vidailhet, Stéphane Lehericy,
et al.. Comparison of telephone recordings and professional microphone recordings for early detection
of Parkinson’s disease, using mel-frequency cepstral coefficients with Gaussian mixture models.
IN-TERSPEECH 2019: 20th annual conference of the International Speech Communication Association,
Sep 2019, Graz, Austria. pp.3033-3037, �10.21437/Interspeech.2019-2825�. �hal-02474486�
Comparison of Telephone Recordings and Professional Microphone Recordings
for Early Detection of Parkinson's Disease, using Mel-Frequency Cepstral
Coefficients with Gaussian Mixture Models
Laetitia Jeancolas
1, Graziella Mangone
2,3,4, Jean-Christophe Corvol
2,3,4, Marie Vidailhet
2,3,4,
Stéphane Lehéricy
2,4, Badr-Eddine Benkelfat
1, Habib Benali
5, Dijana Petrovska-Delacrétaz
11
SAMOVAR, CNRS, Télécom SudParis, Institut Polytechnique de Paris, Evry, France
2Sorbonne Université, UPMC Univ Paris 06 UMR S 1127; INSERM U 1127 and CIC 1422; CNRS
UMR 7225, Paris, France
3
Département de Neurologie, Groupe Hospitalier Pitié-Salpêtrière, AP-HP, Paris, France
4ICM - Institut du Cerveau et de la Moelle Épinière, Paris, France
5
PERFORM Centre, Electrical & Computer Engineering Department Concordia University,
Montreal, Canada
laetitia.jeancolas@free.fr
Abstract
Vocal impairments are among the earliest symptoms in Parkinson’s Disease (PD). We adapted a method classically used in speech and speaker recognition, based on Mel-Frequency Cepstral Coefficients (MFCC) extraction and Gaussian Mixture Model (GMM) to detect recently diagnosed and pharmacologically treated PD patients. We classified early PD subjects from controls with an accuracy of 83%, using recordings obtained with a professional microphone. More interestingly, we were able to classify PD from controls with an accuracy of 75 % based on telephone recordings. As far as we know, this is the first time that audio recordings from telephone network have been used for early PD detection. This is a promising result for a potential future telediagnosis of Parkinson's disease.
Index Terms: Parkinson's disease, speech disorder, telephone
recordings, telediagnosis, acoustic analysis.
1. Introduction
Parkinson’s disease is a neurodegenerative disease which affects 1% of people over 60 years, and up to 4% of those over 80 [1]. Symptoms are mainly motor resulting from a loss of dopaminergic neurons in the substantia nigra (a structure located in the midbrain area). The standard diagnosis, based on motor examination, looks for the classical triad of akinesia, rigidity and rest tremor. Unfortunately, these motor symptoms appear once 50% to 60% of dopaminergic neurons are destroyed in the substantia nigra [2]. For this reason, PD detection at an earlier stage is a big challenge of medical research in order to better understand the early phase of the disease and to test treatments before the occurrence of large irreversible brain damages.
Speech impairments, characterized by hypokinetic dysarthria, are among the first to appear. They include disruptions in prosody, articulation and phonation [3]–[5] . Many studies have sought to detect PD by using voice analysis, and most of them analyzed PD subjects at a medium or advanced stage. Some used phonatory features [6]–[8] (such as shimmer, jitter, harmonic to noise ratio), vowel articulatory
features [9], [10] (such as formants, vowel space area), consonant articulatory features [11] (such as voice onset time) and prosodic features [5] (such as number of pauses and standard deviation of pitch and intensity). Since 2012 [12] short-term parameters like MFCC, which characterize spectrum envelope, have also been used for PD detection [13]–[17].
Some studies explored the possibility of PD telediagnosis using recordings done with smartphone or tablet applications in high quality (sampling rate of 44 or 48kHz) and send later to a remote server [18]–[21]. Audio recordings were sometimes combined to other modalities like tremor or gait analysis to detect the disease [22], [23]. Some other studies explored the effect on PD detection (or other voice pathologies) of voice transmission through telephone channel, simulating it from high quality recordings ([24]–[26]).
In this study, we aimed to detect PD at an early stage from voice through real telephone transmissions. To the best of our knowledge this is the first work dedicated to automatic early PD detection based on the analysis of real recordings from telephone network. For comparison, we will also present early PD classification results we obtained from recordings made with a high-quality microphone. In a previous study [27], we presented results from a subset of our high-quality microphone database. The results of this previous study were slightly biased by not completely matched noise environments between PD and control groups. The problem was solved in the present study by a pretreatment step of denoising and enhanced analyses. The analysis methodology was adapted from a classical method used during several decades in speaker recognition, based on MFCC and GMM modeling of their distributions. Thus, we built GMM models for PD group and control group. Then we classified the test subjects comparing the loglikelihood of their MFCC against the PD and control models. We assessed the influence of the training data contents on the classification results for each tested speech tasks. We finally performed a score fusion to enhance the classification performance.
The second part of our analysis consisted in comparing these results with the ones coming from our telephone recordings. To better understand the causes of the performance differences, we also compared them to a telephone simulation
Copyright
© 2019 ISCA
INTERSPEECH 2019
September 15–19, 2019, Graz, Austria
http://dx.doi.org/10.21437/Interspeech.2019-2825
3033
performed by subsampling our professional microphone recordings and considering a narrower frequency bandwidth for the analysis.
The rest of the paper is organized as follows: Section 2 describes our two databases (recorded with a high-quality microphone and mobile or landline telephones). Section 3 presents the method we used, including preprocessing, feature extraction, classification and validation. Section 4 shows the results obtained and gives possible interpretations, followed by a short discussion and conclusion in Section 5.
2. Voice acquisitions
2.1. Participants
129 male French speakers participated in this study. 75 were recently diagnosed with PD (mean age 63.8 ± 9.3 years) and 54 were healthy controls (mean age 60.0 ± 10.6 years). We chose not to mix genders because it leads to more precise results in speaker recognition and in voice impairments detection [28]. Female speakers will be analyzed in a future analysis. All the PD patients and 28 healthy controls belonged to the ICEBERG cohort (an INSERM longitudinal study that investigates biomarkers for early PD detection) and the others 26 controls were recruited additionally specifically for the speech analyses. The mean stages of PD patients at the Hoehn & Yahr scale [29] was 2.0 ± 0.1 and all controls were at stage 0. The mean values of their evaluation according to MDS-UPDRS III scale [30] was 34.2 ± 7.1 for PD patients (OFF-state) and 4.6 ± 3.4 for controls. The average disease duration prior to recordings was 30.0 ± 17.0 months. PD patients were pharmacologically treated and recorded on ON-state (less than 12 hours after their morning medication). All participants provided written informed consent and local ethical committee and regulatory agencies approved the study.
2.2. Laboratory setting recordings
Among the participants, 122 (74 PD, 48 controls) performed speech tasks recorded with a professional head mounted omnidirectional condenser microphone (Beyerdynamics Opus 55 mk ii) placed approximately 10 cm from the mouth. This microphone was connected to a professional sound card (Scarlett 2i2, Focusrite) which provided phantom power and pre-amplification. Speech was sampled at 96000 Hz with 24 bits resolution, and with a spectrum of [50Hz, 20kHz]. ICEBERG participants were recorded in consultation rooms at CIC/ICM and sleep disorder unit of Pitié-Salpêtrière hospital in Paris. Additional healthy controls were recorded in quiet rooms at their house or their office with the same recording devices.
Speech tasks were presented in a random order to the participants via a graphical user interface. They were composed of sustained vowel /a/ (with and without glissando), fast syllable repetitions, also called diadochokinesia (DDK) tasks, free speech (talk about one's day), readings, sentence repetitions and slow syllable repetitions, for a total duration of 15min.
The "simulated" telephone recordings came from the same database with a subsampling to 8kHz and a narrower frequency bandwidth (300-3700Hz) considered for the analysis. This is a "rough" telephone simulation, allowing the impact assessment of two telephone characteristics which are low frequency sampling and narrow frequency bandwidth.
2.3. Telephone recordings
Most of the participants (63 PD, 36 controls) also carried out true telephone recordings at home. They called once a month with their own phone (mobile or landline) an interactive voicemail (IVM, from NCH company), connected to a SIP server (ippi). Audio signal was compressed with G711 codec and transformed into PCM16 audio files by IVM. Final speech files were sampled at 8000Hz with 16 bits resolution, and a frequency bandwidth of [300-3400Hz].
We set up the voicemail to automatically make the participants do 10min speech tasks when they call. Participants performed different numbers of recording sessions (from 1 to 13 with an average of 5) depending on when they started and early stoppings. Speech tasks were the same type (but fewer) as those performed with the high-quality microphone. Readings were not performed on telephone recordings, for practical reasons we wanted all the instructions to be audio. Some DDK tasks were also removed in order to shorten telephonic recordings.
3. Methods
3.1. Pretreatments and MFCC extractions
The professional microphone recording environments were not perfectly matched for PD and control groups. To avoid bias due to different background noises (there were more environment noise on average in PD group recordings) we denoised the audio files. For that purpose, we used spectral subtraction as detailed in [31] with Praat software [32], calibrated using a 5s silence recorded at the end of each participant recording session. The same pretreatment was performed for the telephone simulation followed by 8kHz subsampling. To complete the denoising, we performed cepstral mean subtraction [33] on all recordings. Spectral subtraction removed additive noise while cepstral mean subtraction removed stationary convolutional distortion.
For the high-quality recordings, we took 20Hz for the lower cutoff and 7000Hz for the upper cutoff of the frequency range covered by the triangular mel bins. For the telephone simulation and the real telephone recordings, we took 300Hz for the lower cutoff and 3700Hz (close to the Nyquist frequency) for the upper one.
For both databases, we then extracted 20 MFCC with their deltas and delta-deltas every 10ms, and performed voice activity detection based on the log-energy with Kaldi software [34].
3.2. Distribution modeling with Gaussian Mixture Models
We split the databases into three groups: one group of PD subjects and one group of controls for training and the remaining PD and control participants for testing. In the laboratory setting database, we used 36 PD subjects and 36 controls for the training groups and 38 PD subjects and 12 controls for the test. For the telephone database, we selected 30 PD patients and 30 controls for the trainings and 33 PD participants and 6 controls for the testing group. We then modeled the training MFCC distributions with multidimensional GMM, still using Kaldi. Number of Gaussian functions were chosen depending on the quantity of speech data used for training.
3.3. Classification and Validation
We computed the log-likelihood for each frame of the data test against the two GMM models. Then we averaged the log-likelihoods on all the frames for each subject so that the likeli-hood was independent of the frame number. A sigmoid function was then applied on the difference of the two mean loglikelihoods, resulting in one score for each test subject.
We then used a bootstrap aggregation approach [35], [36] for the final classification. We ran 40 times GMM modellings and classifications, each time with a different random split of participants between the training and testing groups (keeping the same number of subjects for each group as previously stated). We then averaged for each subject the classification scores of all the runs in which he was tested, resulting in one score between 0 and 1 per subject. The closer the score was to 1, the more probable the subject belonged to the PD group, according to his voice recording. We chose the threshold corresponding to Equal Error Rate (EER), meaning the same ratio of false positives and false negatives, in order to perform our comparisons.
4. Results
4.1. Professional microphone results 4.1.1. Comparison of speech tasks
We first used all the tasks for training and we tested all these tasks separately. This represented 3.5 hours of speech data per training group, we then choose 500 Gaussian functions for the GMM. We noticed that the tasks with the best accuracy were the text and dialog reading, the /pataka/ tasks and the free speech. The sustained vowels did not obtain good classification results. When we averaged the scores obtained for each task, we obtained an accuracy of 76% at the EER threshold.
We then wanted to evaluate if we could better adapt the content of the training data used for the GMM, to the tasks used for the test. Therefore, we computed task specific GMM (see Table 1) composed only with the same tasks we used for the test, changing the number of Gaussian functions according to the quantity of speech data. For example, to test if the sentence repetitions and reading tasks were relevant to discriminate PD subjects from controls, instead of using all the tasks to train the GMM we used only those tasks. An exception was made for the free speech task, for which we added sentence repetitions and reading to the specific GMM, in order to have a speech model less dependent on the content of the free speech tasks. Indeed, the content of the ICEBERG cohort free speech differed slightly from the external control subjects' one. We noticed that specific GMM improved some performances, as for the sentence repetition and reading tasks, which may be explained by the fact that these tasks were text-dependent. On the contrary, the free speech task, which is text-independent was not improved. We also noticed that for other tasks, such as /pataka/, the performance decreased with specific GMM (trained with only /pataka/). This may be due to insufficient data for the GMM (~11min of speech data per GMM). We also tested /pataka/ with GMM trained with all the DDK tasks (semi-specific) and obtained the same results as for global GMM (trained with all the tasks).
For all the tested tasks (at least for the text-dependent ones) the challenge was actually to find the best balance between specificity and quantity for the training data.
In order to check if spectral subtraction and cepstral mean subtraction correctly removed the bias due to not perfectly matched environment conditions, we compared ICEBERG controls' EER with additional controls' EER. No significant differences were found between both conditions, thus we can consider the bias to be removed.
4.1.2. Classification fusion
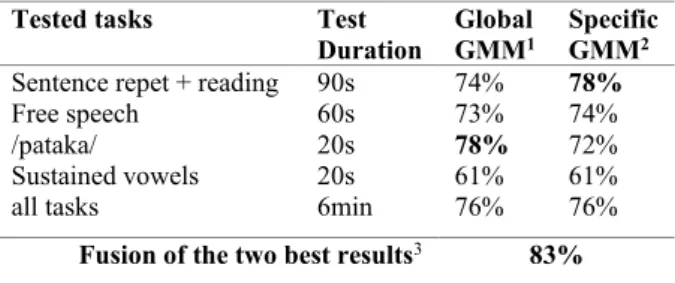
We performed a classification fusion of the two best tasks, averaging their classification scores. Combining /pataka/, tested with global GMM models, with sentence repetition and reading, tested with specific GMM models, resulted in 5% of improvement, leading to a classification accuracy of 83% (see Table 1). The combination of these scores may improve the classification because the types of combined tasks are really different and may reveal different kinds of PD speech impairments [3]. For example, combining the sentence repetition and the reading task with the free speech task did not lead to better performance.
Table 1: Accuracy results of PD vs controls at the EER
threshold, recorded with professional microphone. Impact of tested tasks and GMM specificity.
Tested tasks Test Duration
Global
GMM1 Specific GMM2 Sentence repet + reading 90s 74% 78%
Free speech 60s 73% 74%
/pataka/ 20s 78% 72%
Sustained vowels 20s 61% 61%
all tasks 6min 76% 76%
Fusion of the two best results3 83%
1 Global GMM was trained on all the tasks
2 Specific GMM were built with the same tasks as the one tested
3 Fusion of sentence repetitions and reading (tested with specific GMM) with
/pataka/ (tested with global GMM)
4.2. Comparison between professional microphone, telephone simulations and real telephone recordings
The tasks we used for the comparisons are sentence repetitions and readings, free speech, DDK, trained with specific GMM, /pataka/ trained with global GMM, and scores fusion (for the final result).
The comparison between the professional microphone and the telephone simulation done with a subsampling and a narrower frequency bandwidth showed a 9% decrease on final classification results (see Table 2). The telephone simulation was interesting because we could evaluate the role of speech sampling and bandwidth limitation, and compare with perfectly matched recording conditions, which was not totally the case with the real telephone recordings. Indeed, in the telephone database, there were not as many participants as in the professional microphone database, even though 95% of the telephone database subjects also belonged to the good microphone database. In addition, the voice tasks were slightly different because the reading task was not done during telephone acquisitions and we had reduced the number of DDK tasks. Also, all the tasks were done only once per session, including /pataka/, whereas this task was done twice in the professional microphone database. On the other hand, as telephone acquisitions were made at home, we could ask the participants to do several recordings sessions. That increased
considerably the quantity of speech data we could use for the analysis.
As for the real telephone recordings, when all the sessions were used for the training groups and one session used per test subject, they showed another 9% accuracy decay compared to the telephone simulation. This could be explained by the real telephone environment noises and amplitude distortions that are known to degrade MFCC-based analyses [37], [38]. The decrease in accuracy can also be explained by a lower quality of task execution. No experimenter was present during the real phone recordings to make the subjects start again a task when instructions were not respected. As for the slightly lower number of subjects in the actual telephone database, it may be compensated by the increased number of sessions used for real GMM telephone training.
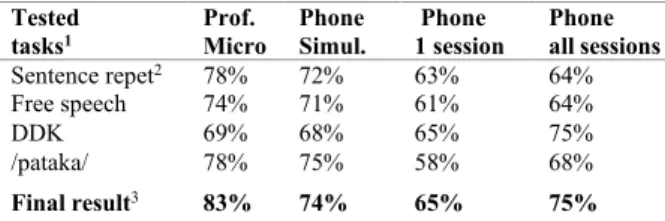
Table 2: Accuracy results of PD vs controls at the EER
threshold. Comparison between professional microphone recordings, telephone simulations and real telephone recordings (using all sessions for GMM trainings and either
one or all sessions per test subject).
Tested
tasks1 Prof. Micro Phone Simul. Phone 1 session Phone all sessions
Sentence repet2 78% 72% 63% 64%
Free speech 74% 71% 61% 64% DDK 69% 68% 65% 75% /pataka/ 78% 75% 58% 68%
Final result3 83% 74% 65% 75%
1 Sentence repetitions, free speech and DDK were tested with specific GMM, and
/pataka/ tasks were tested with global GMM
2 For professional microphone recordings and telephone simulation, reading
tasks are added to sentences repetitions for trainings and tests
3 Final results are composed of fusion results for professional microphone and
telephone simulation, and of DDK scores for real telephone recordings
In order to assess the impact of test data quantity on the performances, we did a classification using this time all the telephonic sessions altogether done per each test subject, and we compared it to the classification performed using only one session per test subject. We noticed classification improvements, reaching an accuracy of 75% for DDK tasks (see Table 2). For DDK tasks, the results obtained were even better than the one we got with the professional microphone. This would mean that with ~5min of DDK telephonic speech data per person, compared to ~1min30 for the professional microphone, the increase of quantity prevailed on the reduced quality.
Intriguingly, with our professional microphone recordings, /pataka/ tasks tested alone on global GMM seem more relevant than using the average of all DDK tasks for test. In the meantime, with our real phone recordings, it seems to be the opposite. This could be explained by the content of DDK tasks. In the high-quality microphone database, there were 11 DDK tasks, among them two /pataka/ tasks, whereas in our real phone database there were six DDK tasks, among them only one /pataka/ task. Therefore, we can assume that the DDK speech data from our professional microphone recordings were more suited for /pataka/ test task, than the DDK data from our real phone recordings.
Fusion as done for the professional microphone recordings (averaging scores obtained with sentence repetition + reading and /pataka/ tasks) was not relevant for the real telephone
recordings due to the absence of reading and the less suited DDK tasks for /pataka/ tests. For this reason, we simply kept the DDK scores as definitive ranking results for actual telephone recordings, for comparison with professional microphone recordings and telephone simulation.
5. Discussion and Conclusion
In this study, we adapted a method widely used in speaker recognition to the detection of early PD. We extracted MFCC and modeled their distributions with GMM in order to have one PD model and one control model. Mean loglikelihoods of MFCC test subjects were then computed against both models, and their differences provided one score per subject. EER and corresponding accuracy were then computed.
We looked for the most appropriate content of training data for the GMM modeling depending on which tasks we used for the test. A balance between specificity and quantity of training data and a score fusion led to an accuracy of 83% with the professional microphone recordings. To our knowledge, this performance has never been obtained in previous studies with early PD patients who were pharmacologically treated. Indeed, it has been shown that PD treatments reduced some of the speech impairments [39], [40], making the classification more complicated.
With a "rough" simulation of telephone recordings from professional microphone recordings, downsampling the latter and considering a narrower frequency bandwidth, we observed a 9% decrease in accuracy. This confirmed the role of frequency sampling and bandwidth limitation in MFCC-based analyses, respectively shown in [24] and [38].
Our actual telephone recordings tested on one recording session per test subject resulted in an additional performance degradation, highlighting the impact of other environmental conditions such as background noise or the quality of task execution. Interestingly, taking all telephone recording sessions per test subject into account greatly improved classification performance. With just DDK tasks (~5min of speech data per person) we were able to classify PD from controls with an accuracy of 75 %. Here the amount of data compensated for a significant portion of the quality decline inherent in actual telephone recordings.
To the best of our knowledge, it is the first time that audio recordings from telephone network have been used for detection of early PD. This is a promising result for a potential future telediagnosis of PD. Even if GMM-based classifiers are rather simple models, they were accurate enough to assess the impact of several factors (specificity and quantity of speech tasks, channel and environment effects ...).
In order to improve the classification performances, we may consider more recent and more computationally expensive speaker recognition techniques, such as i-vectors or X-vectors. We may also combine this analysis with other classification methods, using for example high-level features [41].
6. Acknowledgments
L. Jeancolas was supported by a grant of Institut Mines- Télécom, Fondation Télécom and Institut Carnot Télécom & Société Numérique through "Futur & Ruptures" program. The ICEBERG study was partly funded by the program "Investissements d’Avenir" ANR-10-IAIHU-06, and Fondation EDF.
7. References
[1] L. M. De Lau and M. M. Breteler, “Epidemiology of Parkinson’s disease,” Lancet Neurol., vol. 5, no. 6, pp. 525–535, 2006. [2] B. R. Haas, T. H. Stewart, and J. Zhang, “Premotor biomarkers
for Parkinson’s disease-a promising direction of research,” Transl
Neurodegener, vol. 1, no. 1, p. 11, 2012.
[3] L. Jeancolas, et al., “L’analyse de la voix comme outil de diagnostic précoce de la maladie de Parkinson : état de l’art,” in
CORESA 2016 : 18e Edition COmpressions et REprésentation des Signaux Audiovisuels, Nancy, 2016, pp. 113–121.
[4] R. B. Postuma, A. E. Lang, J. F. Gagnon, A. Pelletier, and J. Y. Montplaisir, “How does parkinsonism start? Prodromal parkinsonism motor changes in idiopathic REM sleep behaviour disorder,” Brain, vol. 135, no. 6, pp. 1860–1870, Jun. 2012. [5] J. Rusz et al., “Quantitative acoustic measurements for
characterization of speech and voice disorders in early untreated Parkinson’s disease,” J. Acoust. Soc. Am., vol. 129, no. 1, 2011. [6] J. Gamboa et al., “Acoustic voice analysis in patients with
Parkinson’s disease treated with dopaminergic drugs,” J. Voice, vol. 11, no. 3, pp. 314–320, Sep. 1997.
[7] B. E. Sakar et al., “Collection and Analysis of a Parkinson Speech Dataset With Multiple Types of Sound Recordings,” IEEE J.
Biomed. Health Inform., vol. 17, no. 4, pp. 828–834, juillet 2013.
[8] M. Brückl, A. Ghio, and F. Viallet, “Measurement of Tremor in the Voices of Speakers with Parkinson’s Disease,” Procedia
Comput. Sci., vol. 128, pp. 47–54, Jan. 2018.
[9] J. Rusz et al., “Imprecise vowel articulation as a potential early marker of Parkinson’s disease: Effect of speaking task,” J. Acoust.
Soc. Am., vol. 134, no. 3, pp. 2171–2181, Sep. 2013.
[10] J. Mucha et al., “Identification of hypokinetic dysarthria using acoustic analysis of poem recitation,” in 2017 40th International
Conference on Telecommunications and Signal Processing (TSP),
2017, pp. 739–742.
[11] M. Novotný, J. Rusz, R. Cmejla, and E. Ruzicka, “Automatic Evaluation of Articulatory Disorders in Parkinson’s Disease,”
IEEEACM Trans. Audio Speech Lang. Process., vol. 22, no. 9, pp.
1366–1378, Sep. 2014.
[12] A. Tsanas, M. A. Little, P. E. McSharry, J. Spielman, and L. O. Ramig, “Novel Speech Signal Processing Algorithms for High-Accuracy Classification of Parkinson’s Disease,” IEEE Trans.
Biomed. Eng., vol. 59, no. 5, pp. 1264–1271, 2012.
[13] T. Bocklet, S. Steidl, E. Nöth, and S. Skodda, “Automatic evaluation of parkinson’s speech-acoustic, prosodic and voice related cues.,” in Interspeech, 2013, pp. 1149–1153.
[14] J. R. Orozco-Arroyave et al., “Automatic detection of Parkinson’s disease from words uttered in three different languages.,” in
INTERSPEECH, 2014, pp. 1573–1577.
[15] J. R. Orozco-Arroyave et al., “Characterization Methods for the Detection of Multiple Voice Disorders: Neurological, Functional, and Laryngeal Diseases,” IEEE J. Biomed. Health Inform., vol. 19, no. 6, pp. 1820–1828, Nov. 2015.
[16] D. Hemmerling, J. R. Orozco-Arroyave, A. Skalski, J. Gajda, and E. Nöth, “Automatic Detection of Parkinson’s Disease Based on Modulated Vowels,” in INTERSPEECH, 2016, pp. 1190–1194. [17] A. Benba, A. Jilbab, and A. Hammouch, “Analysis of multiple
types of voice recordings in cepstral domain using MFCC for discriminating between patients with Parkinson’s disease and healthy people,” Int. J. Speech Technol., vol. 19, no. 3, pp. 449– 456, Sep. 2016.
[18] H. Zhang, A. Wang, D. Li, and W. Xu, “DeepVoice: A voiceprint-based mobile health framework for Parkinson’s disease identification,” in 2018 IEEE EMBS International Conference on
Biomedical & Health Informatics (BHI), Las Vegas, NV, USA,
2018, pp. 214–217.
[19] J. Rusz et al., “Smartphone Allows Capture of Speech Abnormalities Associated With High Risk of Developing Parkinson’s Disease,” IEEE Trans. Neural Syst. Rehabil. Eng., vol. 26, no. 8, pp. 1495–1507, Aug. 2018.
[20] E. Vaiciukynas, A. Verikas, A. Gelzinis, and M. Bacauskiene, “Detecting Parkinson’s disease from sustained phonation and
speech signals,” PLOS ONE, vol. 12, no. 10, p. e0185613, Oct. 2017.
[21] Y. N. Zhang, “Can a Smartphone Diagnose Parkinson Disease? A Deep Neural Network Method and Telediagnosis System Implementation,” Parkinson’s Disease, 2017.
[22] S. Arora et al., “Detecting and monitoring the symptoms of Parkinson’s disease using smartphones: A pilot study,”
Parkinsonism Relat. Disord., vol. 21, no. 6, pp. 650–653, 2015.
[23] M. Brunato, R. Battiti, D. Pruitt, and E. Sartori, “Supervised and unsupervised machine learning for the detection, monitoring and management of Parkinson’s disease from passive mobile phone data. In: Predicting Parkinson’s Disease Progression with Smartphone Data,” Kaggle Compet.
[24] K. Wu, D. Zhang, G. Lu, and Z. Guo, “Influence of sampling rate on voice analysis for assessment of Parkinson’s disease,” J.
Acoust. Soc. Am., vol. 144, no. 3, pp. 1416–1423, Sep. 2018.
[25] A. Tsanas, M. A. Little, P. E. McSharry, and L. O. Ramig, “Using the cellular mobile telephone network to remotely monitor parkinsons disease symptom severity,” IEEE Trans. Biomed.
Eng., 2012.
[26] J. C. Vásquez-Correa, J. Serrà, J. R. Orozco-Arroyave, J. F. Vargas-Bonilla, and E. Nöth, “Effect of acoustic conditions on algorithms to detect Parkinson’s disease from speech,” in 2017
IEEE International Conference on Acoustics, Speech and Signal Processing (ICASSP), 2017, pp. 5065–5069.
[27] L. Jeancolas et al., “Automatic detection of early stages of Parkinson’s disease through acoustic voice analysis with mel-frequency cepstral coefficients,” in 2017 International
Conference on Advanced Technologies for Signal and Image Processing (ATSIP), 2017, pp. 1–6.
[28] R. Fraile, et al., “Automatic Detection of Laryngeal Pathologies in Records of Sustained Vowels by Means of Mel-Frequency Cepstral Coefficient Parameters and Differentiation of Patients by Sex,” Folia Phoniatr. Logop., vol. 61, no. 3, pp. 146–152, 2009. [29] M. Hoehn and M. D. Yahr, “Parkinsonism: onset, progression and
mortality.,” Neurology, vol. 17, no. 5, pp. 427–442, 1967. [30] C. G. Goetz et al., “Movement Disorder Society-sponsored
revision of the Unified Parkinson’s Disease Rating Scale (MDS-UPDRS): Process, format, and clinimetric testing plan,” Mov.
Disord., vol. 22, no. 1, pp. 41–47, 2007.
[31] S. Boll, “Suppression of acoustic noise in speech using spectral subtraction,” IEEE Trans. Acoust. Speech Signal Process., vol. 27, no. 2, pp. 113–120, Apr. 1979.
[32] P. Boersma and D. Weenink, “PRAAT, a system for doing phonetics by computer,” Glot Int., vol. 5, pp. 341–345, Jan. 2001. [33] T. F. Quatieri, Discrete-Time Speech Signal Processing:
Principles and Practice, 1 edition. Upper Saddle River, NJ:
Prentice Hall, 2001.
[34] D. Povey et al., “The Kaldi Speech Recognition Toolkit,” in IEEE
2011 Workshop on Automatic Speech Recognition and Understanding, 2011, p. 4.
[35] L. Breiman, “Bagging predictors,” Mach. Learn., vol. 24, no. 2, pp. 123–140, Aug. 1996.
[36] P. Bühlmann and B. Yu, “Analyzing Bagging,” Ann. Stat., vol. 30, no. 4, pp. 927–961, 2002.
[37] J. C. Vásquez-Correa et al., “Effect of Acoustic Conditions on Algorithms to Detect Parkinson’s Disease from Speech.” In 2017
IEEE International Conference on Acoustics, Speech and Signal Processing (ICASSP), 5065–69, 2017
[38] R. Fraile, J. I. Godino-Llorente, N. Saenz-Lechon, V. Osma-Ruiz, and C. Fredouille, “MFCC-based remote pathology detection on speech transmitted through the telephone channel,” Proc
Biosignals, 2009.
[39] S. Pinto, et al., “Treatments for dysarthria in Parkinson’s disease,”
Lancet Neurol., vol. 3, no. 9, pp. 547–556, Sep. 2004.
[40] J. Rusz et al., “Evaluation of speech impairment in early stages of Parkinson’s disease: a prospective study with the role of pharmacotherapy,” J. Neural Transm., vol. 120, no. 2, pp. 319– 329, Feb. 2013.
[41] L. Jeancolas et al., “Analyse de la Voix au Stade Débutant de la Maladie de Parkinson et Corrélations avec Analyse clinique et Neuroimagerie,” in Journées d’Etude sur la TéléSanté, Paris, France, 2019, hal-02161042.