HAL Id: hal-01636989
https://hal.archives-ouvertes.fr/hal-01636989
Submitted on 17 Nov 2017
HAL is a multi-disciplinary open access
archive for the deposit and dissemination of
sci-entific research documents, whether they are
pub-lished or not. The documents may come from
teaching and research institutions in France or
abroad, or from public or private research centers.
L’archive ouverte pluridisciplinaire HAL, est
destinée au dépôt et à la diffusion de documents
scientifiques de niveau recherche, publiés ou non,
émanant des établissements d’enseignement et de
recherche français ou étrangers, des laboratoires
publics ou privés.
Yang Chen, Lu Zhang, Wenlong Yuan, Guanyu Yang, Jian Yang, Tianjie Xu,
Shu Huazhong, Limin Luo, Qianjing Feng, Xuetong Zhai
To cite this version:
Yang Chen, Lu Zhang, Wenlong Yuan, Guanyu Yang, Jian Yang, et al.. Extended PCJO for the
detection-localization of hypersignals and hyposignals in CT images. IEEE Access, IEEE, 2017, 5,
pp.24239-24248. �10.1109/ACCESS.2017.2720418�. �hal-01636989�
Abstract—The anthropomorphic model observer (MO) plays an
important role in the assessment and optimization of medical imaging systems. The MO is a task-based approach. While the abnormality can appear as a hypersignal or a hyposignal for different imaging modalities, sequences or organs, no MO has been proposed for the hyposignals detection-localization task in the literature. To improve the clinical relevance of the existing MOs, we propose an anthropomorphic MO that can also deal with hyposignals in this paper. In a previous study, we reported a perceptually relevant channelized joint observer (PCJO) for detecting and localizing multiple signals with unknown amplitude, orientation, size and location. Here, we extend it mathematically to hyposignals task. A free-response study (close to the real diagnostic procedure) for both hypersignals and hyposignals in cerebral and abdominal CT images was conducted with four radiologists. The equally weighted alternative free-response operating characteristic (wAFROC1) was used as the figure of merit (FOM). Statistical analyses show that the extended PCJO approaches the experts’ performances with no significant difference in the studied tasks. The results demonstrate that the extended PCJO is an alternative to replace radiologists for the evaluation and comparison of different medical image processing algorithms. The PCJO has been originally proposed on Magnetic Resonance Imaging (MRI) but tested on computerized tomography (CT) here; the coherent results show that the PCJO can be generalized to another modality - CT. We also provide in this paper the reference values of all the parameters in the PCJO to facilitate its future application on MR or CT images.
Index Terms—Model observer, PCJO, detection-localization,
CT images, hypersignals, hyposignals. I. INTRODUCTION
edical image processing (e.g. denoising, interpolation, compression, enhancement…) is one of the most important issues in biomedical engineering domain. While many new image processing algorithms have been proposed to improve or to guarantee the image quality, their task-based YANG CHEN1,2,3, (Senior Member, IEEE), LU ZHANG4,5, WENLONG YUAN1,2,3,
GUANYU YANG1,2,3, JIAN YANG6, TIANJIE XU1,2,3,
HUAZHONG SHU1,2,3, (Senior Member, IEEE), LIMIN LUO1,2,3, (Senior Member, IEEE),
QIANJING FENG7, XUETONG ZHAI
1 LIST, Key Laboratory of Computer Network and Information Integration, Ministry of Education, Southeast University, Nanjing 210096, China 2 the Centre de Recherche en Information Biomedicale Sino-Francais (LIA CRIBs), Rennes, F-3500 France
3 International Joint Research Laboratory of Information Display and Visualization, Southeast University, Ministry of Education, Nanjing 210096, China
4 IETR, CNRS UMR 6164, INSA Rennes, 35708 Rennes, France
5 Department of Industrial Computer Science and Electronics, National Institute of Applied Sciences of Rennes, Rennes, France
6 Beijing Engineering Research Center of Mixed Reality and Advanced Display, School of Optics and Electronics, Beijing Institute of Technology,
Beijing 100081, China
7 Department of Biomedical Engineering, Southern Medical University, Guangzhou 510515, China
8 University of Pittsburgh, Pittsburgh, PA 15213, United States.
Corresponding author: Huazhong Shu and Lu Zhang (shu.list@seu.edu.cn, Lu.Ge@insa-rennes.fr)
This work was supported in part by the State's Key Project of Research and Development Plan 2017YFC0109202 and 2017YFA0104302, the National Natural Science Foundation under Grant 81370040, Grant 81530060, in part by the Fundamental Research Funds for the Central Universities, and in part by the Qing Lan Project in Jiangsu Province.
Extended PCJO for the detection-localization of
hypersignals and hyposignals in CT images
M
(a) (b)
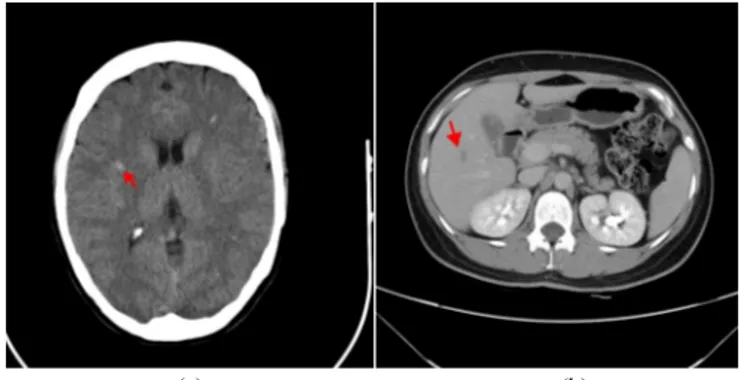
Fig. 1 A cerebral CT image of a multiple sclerosis (MS) patient (a) and an abdominal CT image of a hepatic carcinoma patient (b). Note the arrow in each image points to one abnormality (lesion).
(a) (b)
Fig.2 A cerebral MR image of a hematoma patient (a) and an abdominal MR image of a pancreatic cancer patient (b). Note the arrow in each image points to one abnormality (lesion).
error (NMSE) and the peak signal-to-noise-ratio (PSNR), were still frequently used [1] [2] [3], while it has been widely admitted that they correlate poorly with human perception. The image quality actually has a close relationship with the intended purpose the image serves [4]. Since medical images are used for diagnosis, researchers are prone to define the medical image quality in terms of observer performance for a given diagnostic task. Human is the end-user of medical images, consequently the most correct and the ultimate way of image quality evaluation is to use human observers [5]. However, this method is costly and time-consuming. Nowadays, it has been largely recognized that medical image quality can be objectively assessed by the anthropomorphic model observer (MO) as the surrogate of the human observer [6], and the MO performance should be measured by its capacity of predicting human observer performance on the specific task [7]. The task should be clinically relevant, such as detecting the presence or absence of an abnormality, locating lesions’ positions, etc.
One of the first anthropomorphic MOs may be the nonprewhitening matched filter (NPWMF) [8], considering that the human eyes cannot perform the pre-whitening operation. Then, the channelization mechanism was adopted by MOs to model the frequency and orientation selectivity of the human visual system (HVS), e.g. the channelized ideal observer (CIO) [9] and the channelized Hotelling observer (CHO) [10]. The above anthropomorphic MOs have
successfully predicted human performance in
signal-known-exactly (SKE) experiments [11] [12], where the entire signal attributes are fixed and a priori known by observers. However, in clinical routine radiologists are uncertain about the abnormality attributes before looking at the
images; the experiments thus have to be
signal-known-statistically (SKS) to approach the real diagnostic procedure. An SKS MO could detect or localize one or multiple abnormalities without knowledge about their size, shape, amplitude or orientation, etc. A detailed review on the SKS MOs can be found in [13]. Later developments on the SKS MOs include the MO proposed by Georges Acharian et al. that models the sequence of eye fixations that human observers make when exploring an image to detect an object [14]. Lee et
al. replaced the 2D spatial channels in the CHO by a set of 4D
space-time channels to develop a 4D MO for the detection of motion defects in 4D gated medical images [15]. Gifford et al. continued to improve the visual-search (VS) observer’s prediction performance by integrating the eye tracking data or a support-vector machine (SVM) [16] [17]. Diaz et al. extended the CHO and the NPWE to the Filtered Channel Observer (FCO) based on convolution channels [2]. The FCO can be implemented as a template with an internal noise component which renders the performance calculation very simple even though it could not match all the human performances with a single internal noise component for all signal shape, size and contrast conditions even for one signal. Note that our previously proposed SKS MO, the perceptually relevant channelized joint observer (PCJO) [18], still remains one of the
variety of unknown signal parameters (amplitude/contrast, orientation, position, size and the number of signals); (3) the number of signals per image can be more than one; (4) it has been validated using simulated multiple sclerosis (MS) lesions and real medical background (cerebral MR images) on which there is no significant difference between the task performance of experts and that of the PCJO.
Each medical imaging modality has its own specific features corresponding to the studied physical and physiological phenomena; the pixel or voxel values depend on the chemical and physical characteristics of the studied tissues [19]. In radiological terminology, an abnormality appears as a hypersignal or a hyposignal, respectively indicating that the abnormality has a higher or lower intensity than its surrounding tissues. For example, the MS lesions appear as hypersignals on a cerebral CT image (as shown by red arrows in Fig.1 (a)) while the hepatic carcinoma abnormalities appear as hyposignals on an abdominal CT image (refer to Fig.1 (b)); the traumatic lesions of hematoma appear as hypersignals on a cerebral MR image (see Fig.2 (a)) while the pancreatic cancer lesions appear as hyposignals on an abdominal MR image (as illustrated in Fig.2 (b)). As human observer, the radiologist has to be able to interpret both kinds of signals to achieve a precise diagnosis. However, existing MOs are limited to mimic human observers in hypersignal related tasks. To the best of our knowledge, no MO has been proposed or tested for hypo-signals, which is however frequently encountered by radiologists in clinical routine.
In this paper, we try to further improve the clinical relevancy of the SKS MO by incorporating the hyposignal profile into the mathematical model. Our main contributions are: 1) a mathematical derivation based on the PCJO that allows it to detect and localize not only hypersignals but also hyposignals with unknown amplitude, orientation, size and number of signals; 2) an application of the extended PCJO on the cerebral and abdominal CT images, along with a free-response experiment using human observers, not only for the performance evaluation of the extended PCJO with regard to hyposignals, but also for the validation of the PCJO on another imaging modality to verify its generality; 3) the analysis of the reference values of all the parameters in the PCJO to facilitate its future application on the MR or CT images.
The rest of this paper is organized as follows: in section 2, we introduce the mathematical model of background and signal, redefine the signal detection model for hyposignals, and deduce the new SKS MO for hyposignals; section 3 introduces the selected experimental protocol; section 4 shows and discusses the results; section 5 concludes the paper.
II. EXTENDED PCJO FOR HYPOSIGNALS
In this work, we use the same background and signal models as in the previous studies [18] and [20]: the Correlated Gaussian background (CGB) and a 2D Gaussian lesion model.
recall the PCJO’s framework which is composed of two parts. The first part (called Candidates Localization) executes a global search on the tested image based on the visible difference predictor (VDP) model and locates all the abnormality candidates deserving further check. The candidate blocks were extracted as the input of the second part. The second part (called CJO Detection Decision) applies the channelized joint detection-estimation observer (CJO) [18] on each candidate blocks to calculate its test statistic (related to detection decision). For more details on the PCJO, please refer to [20].
Since the VDP can always provide a detection probability map (between a reference image and a distorted image) even when the abnormality has a lower intensity than its surroundings, we have just to adapt the CJO to the hyposignal. The Candidates Localization part in our extended PCJO remains the same as in [20]. Our extension concerns only the
CJO Detection Decision part. The mathematical derivations of
the CJO for hypersignals were introduced in [20], in the following we will only give a brief introduction of the CJO for hyposignals.
Since the hyposignal intensity is lower than its surrounding tissues, we can model the image g by subtracting the signal xΛ
(Λ is the signal parameters vector) from the background b. The hyposignal detection task can then be seen as the validation of one of two exclusive hypotheses:
H
k:
g
= −
k
x
Λ+
b
,
k
=
0,1
(1) where the binary variable k controls the hyposignal absence (k = 0) or presence (k = 1), andg
is anM ×
1
vector for an image withM
pixels.Based on the joint detection and estimation theory, the signal parameter
Λ
and the hypothesisH
k are estimated together to maximize the joint posterior probabilityP
(
Λ,
H
k| g
)
:
( ,
) arg max (
)
k k kH
P
H
Λ,ΗΛ
=
Λ,
| g
(2) Similar to the derivations in [20], considering the statistical independence ofΛ
andH
k , the monotonicity of the logarithmic function, the constancy ofP g
( )
and the CGB withΣ
b as its covariance matrix, Eq. (2) can be substituted by:1 ,
1
( ,
) arg max{ln (
)+ln ( )
(
)}
2
k t k kH
P H
P
k
−k
Η=
−
Λ b+
Λ ΛΛ
Λ
x Σ
g
x
(3)In order to estimate the parameter
Λ
, we can maximize the posterior probabilityP Λ g
( | )
:
ˆ=argmax ( | )
P
ΛΛ
Λ g
(4) Two assumptions (the parameterΛ
is uniformly distributed over feasible regionℜ Λ
( )
and the presence of the signal or not is equiprobable) lead Eq.(4) to:1 1 1 1 =arg max{ ( )}, ( ) 0 ˆ 2 2 any value in ( ), t t e otherwise − − ⎧ − + − + > ⎪ = ⎨ ⎪ ℜ ⎩ Λ b Λ Λ b Λ Λ Λ x Σ g x x Σ g x Λ Λ (5) Considering the classical probabilistic decision model, we can
set a decision rule as follows: when
0
ˆ
1ˆ
(
| , )
(
| , )
P H
Λ g
>
P H
Λ g
we chooseH
0, which means that the hyposignal is absent; otherwise, the hyposignal is present. Then the following decision equation can be derived:1 0 1 0 ˆ ˆ 1 ( ) 1 ( ) ln 2 ( ) H t H P H P H
λ
− > = − + < b Λ Λ x Σ g x (6)where
λ
is the test statistic for deciding the presence or absence of the hyposignal.As in [20], we solve the dimensionality problem by introducing the channel matrix
U
Λ to firstly obtain the channelized imageg
':'
=
Λg U g
(7) The matrixU
Λ is built in the same way as in [20] to be capable of searching the optimal parameter in the channel domain rather than in the spatial domain, without loss of accuracy:'
( )
t t=
=
Λ Λ ΛU
A U U A
(8) whereA
Λ is used to map the parametric signalx
Λ to a reference signal x0 whose parameters are known:A x
Λ Λ=
x
0;'
Λ
A
serves to map the channelized parametric signal 'Λ
x
to a channelized reference signalx
0' :A x
Λ Λ' '=
x
'0. The matricesU
andA
Λ' remain the same as in [20], whereU
is constructed by K steerable channels and J scale-shiftable channels. We can finally get the following equations for the parameters estimation and the detection decision:' t ' 1 ' ' ' 0 0 ' t 2 F
1
1
= argmax
( ) ( ) (
+
)
|| ( ) ||
2
e −−
b Λ Λ ΛΛ
x
Σ
A g
x
U A
(9) ' ' 1 ' ' ' ˆ 0 0 ' 2 ˆ 1 1 ( ) ( ) ( + ) || ( ) || 2 t t Fλ
− − = b Λ Λ x Σ A g x U A (10)For the hyposignal, the expression of
Σ
b' is:(
)(
)
(
) (
)
(
) (
)
' ' ' ' ' 0 0 0 ' ' ' ' ' ' ' ' 1 1 1 1 ˆ 2 1 2 t t H H H H H H ∧ ∧ ∧ ∧ = − − + ⎡ + − + ⎤ ⎡ + − + ⎤ ⎣ ⎦ ⎣ ⎦ b Σ g g g g g x g x g x g x (11)III. EXPERIMENTALPROTOCOL
A. Experimental images
With the extension on the CJO Detection Decision part, the new version of the PCJO can not only work on hypersignals, but also on hyposignals.
To study the PCJO task performance on hyposignals, we selected the hepatic carcinoma (cf. Fig. 3) as the target pathology and CT as the imaging modality. To further verify its generality over modalities, we also selected the MS lesions appearing as hypersignals under CT (cf. Fig. 3).
image. We then chose 100 independent slices for the abdominal images and 80 independent slices for the cerebral images as the reference image-slices.
We then inserted (i) one to three subtractive lesions with an amplitude value between 20 and 35 on the abdominal CT image-slices to simulate the hepatic carcinoma lesions (hyposignals), and (ii) one to three additive lesions with an amplitude value between 40 and 55 on the cerebral CT image to simulate the MS lesions (hypersignals). The proprieties of the simulated lesions’ amplitude, shape, size, position and orientation had been verified and confirmed by a consultant CT expert who did not participate in the subjective experiments. According to the consultant expert, these additive and subtractive lesions are sufficiently representative and mimic well the real abnormalities.
Fig.3 Examples of experimental image-slices, the left two image-slices are original image-slices from healthy subjects and the right ones are those with simulated hyposignals (top image) and hypersignals (bottom image). Note that for the detection-localization task, the lesions must not be too conspicuous or too difficult. Otherwise, observers (radiologists or MOs) could always detect and localize the abnormalities easily, or they would never detect and localize any of them. In these extreme cases, different imaging systems cannot be adequately differentiated through different task performances of observers. The subtlety of the simulated lesions in our experiments was well controlled to make the task not too easy nor too difficult.
B. Human Observer studies
In order to objectively assess radiologists’ performances, we conducted the same free-response study as in [20] with four radiologists. The four radiologists are hereafter referred to as E1, E2, R1 and R2, where E1 and E2 are CT experts, with respectively 12 and 10 years’ abdominal and cerebral imaging
mark, with a mouse-click, the locations of any perceived lesions, and assign a confidence level on a 0 to 100 integer scale to each mark. Each radiologist performed this free-response task on 100 abdominal CT image-slices and 80 cerebral CT image-slices without time limits. The radiologists were blinded about the number of lesions (0-∞) that might be present on each image-slice and the lesion parameters. Each mark was classified as lesion localization (LL) if it was within an agreed upon distance of a simulated lesion or else it was classified as non-lesion localization (NL).
Note that no lesion-absent image-slices were presented to human observers in the experiment for time-saving purposes, but we can still get a high statistical power by using the wJAFROC1 figure of merit (cf. section III.D).
C. Extended PCJO Configurations
In the Candidates Localization part of the PCJO, the healthy CT image-slices were considered as the reference image for the VDP, while those with simulated lesions were considered as the distorted image. The default parameters in VDP were given in [22]. The probability threshold applied on the detection probability map in the Candidates Localization part (Tp in [20]) is set to the values varying from 0.1 to 0.9 with a step of 0.1.
For the CJO Detection Decision part, 600 training blocks (300 without signal and 300 with signal) were extracted from healthy abdominal and cerebral CT images, respectively. The size of blocks was set to 65×65. The scale range of the simulated lesions was[
σ
min,σ
max] [1,12]= ; the orientation varied between 0 and π; the shape was defined by b = 2and the amplitude range was [amin, amax] = [20,35] for hyposignalsand [amin, amax] = [40,55] for hypersignals.
D. Observer performance data analysis method
Since the data consisted of a-priori unknown numbers of mark-rating pairs on each viewed image-slice, where each slice was a simulated diseased case, the appropriate analysis is to use the area under the equally weighted alternative free-response receiver operating characteristic AwAFROC1 as the performance metric or figure or merit (FOM) [23-24]. It is defined as follows:
( )
(
)
2 2 2 1 1 2 2 1 ' 1 1 ' 1 2 2 1 max , k L K K wAFROC kl l k l kl k l k A W z z K K = = =ψ
=∑∑
∑
(12)In the above expression the index of a diseased case is k or k’, NL locations are indexed by l1 and LL locations by l2. The rating of a case is denoted by
1 ' k l
z
for NLs and 2 klz
for LLs. The number of lesions on case k is denoted by Lk. The function( )
x
ψ
is defined as unity if x > 0, one half if x = 0 and zero if x<0. The max() function is the maximum over the indicated subscript. The quantity2
kl
W
is the weight of lesion l2 on diseased-case k. The weights, which and sum to unity on eachcase, denote the clinical importance of each lesion. In the current study the lesions were weighted equally, so
2
1
kl kW
L
=
(13) The weighting assures that each case gets equal importance in the analysis, regardless of the number of lesions in it. In the absence of such weighting, cases with larger numbers of lesions would contribute more to the FOM than cases with fewer lesions, an undesirable characteristic since each case is intended to be an equally representative sample from the population of cases.Since each free-response experiment (abdominal or cerebral) constitutes a single modality multiple reader study, the method described by Hillis [25] for fixed reader analysis is applicable (see Section 5.4 in cited paper). The necessary co-variances were evaluated using the jackknife method [26].
The analysis applies a statistical test, using the F-distribution, of the null hypothesis that all readers have identical performances. The Type I error rate (alpha) of the test was chosen to be 0.05. If the null hypothesis is rejected, i.e., if the p-value of the overall F-test is smaller than 0.05, then one is justified in concluding that at least one pair of readers have different performances. Since the F-test controls the overall probability of a Type I error, no further correction (e.g., Bonferroni) for multiple comparisons is needed. Which reader pairs are different is determined by applying individual t-tests to each reader pairing. A t-test yielding a p-value less than 0.05 means that particular pair of readers have significantly different performances.
The analysis method is implemented in an R package called RJafroc (https://cran.r-project.org/web/packages/RJafroc).
IV. RESULTSANDDISCUSSIONS
A. Results of radiologists & PCJO for abdominal CT image
For the detection-localization of simulated hepatic carcinoma lesions on abdominal CT images, the wAFROC1 FOMs of the
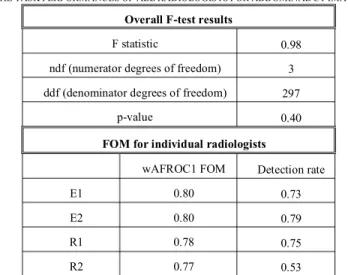
four radiologists were calculated and are shown in Table I. From the F-test results, we can see that no significant difference exists between the FOMs of all the four radiologists (p-value = 0.4 > 0.05).
TABLEI
THE TASK PERFORMANCES OF ALL RADIOLOGISTS FOR ABDOMINAL CT IMAGES
Overall F-test results
F statistic 0.98
ndf (numerator degrees of freedom) 3 ddf (denominator degrees of freedom) 297
p-value 0.40
FOM for individual radiologists
wAFROC1 FOM Detection rate
E1 0.80 0.73
E2 0.80 0.79
R1 0.78 0.75
R2 0.77 0.53
TABLEII
NUMBER OF LL MARKS AND NL MARKS UNDER DIFFERENT THRESHOLD TP OF
THE PCJO FOR ABDOMINAL CT IMAGES
Tp LL NL 0.1 180 24 0.2 167 24 0.3 161 27 0.4 146 21 0.5 128 27 0.6 117 17 0.7 107 14 0.8 80 5 0.9 63 1
FIG.4The WAFROC1FOM of the PCJO under different threshold Tp for abdominal CT images vs. those of four radiologists
step of 0.1. The numbers of LL and NL marks obtained by different Tp settings are shown in Table II. We can see that
when Tp is between 0.4 and 0.7, the LL and NL numbers of the
PCJO seem close to those of radiologists.
We then further find the relation between the wAFROC1 FOM difference (between the PCJO and radiologists) and the probability threshold (Tp), as shown in Fig. 4. Note that for
different thresholds, we tried different combinations of the number of steerable channel K and the number of scale-shiftable channel J to get the smallest wAFROC1 FOM difference. F-test results showed that when Tp = 0.5 ~ 0.7, there
is no significant difference between the wAFROC1 FOM of the PCJO and that of all the four radiologists. In addition, when the threshold Tp = 0.5 the wAFROC1 FOM of the PCJO is closest
to those of two experts. In order to make the wAFROC1 FOM of the PCJO closest to that of most radiologists, we retained the value 0.5 for the Tp for the abdominal CT images.
With Tp = 0.5, we then explored the influence of the number of
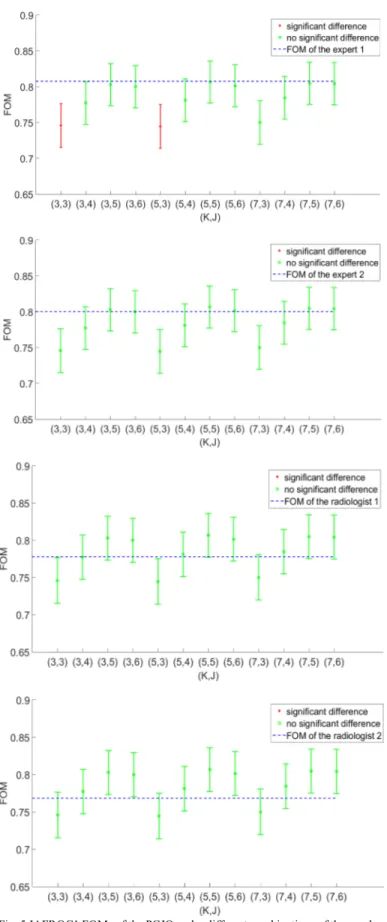
steerable channels K and the number of scale-shiftable channels J on the PCJO’s performance, as shown in Fig. 5. The results illustrate that: (1) the number of scale-shiftable channel J has a much stronger effect on the PCJO’s FOM than the number of steerable channels K; (2) even with a small number of channels, (K=3 & J=4, 3×4=12 channels), there is no significant difference between the PCJO’s wAFROC1 FOM and that of the four radiologists (p-value > 0.05).
B. Results of radiologists & PCJO for cerebral CT images
Table III summarizes the task performances obtained for the detection-localization of simulated MS lesions on cerebral CT images. Since the p-value of the overall F-test is 0.00 < 0.05 (that means there are significant differences among readers), we also listed the difference for each pair of radiologists. The p-values of each paired t-test demonstrate that there is no significant difference between expert 1 and expert 2 (p = 0.88 > 0.05), all other pairings of readers are significantly different. This finding is consistent with our previous experiment about hypersignals on MR images where there was a significant difference between the experts and the non-experts [20].
In order to get the best probability threshold (Tp), we then varied it from 0.1 to 0.9 with a step of 0.1 and counted the number of LL and NL marks obtained by the model, as shown in table VI. It can be seen that when Tp = 0.9, the number of LL and NL is very close to subjective results from the experts. We then plotted the wAFROC1 FOMs of the PCJO vs. different values of Tp, as shown in Fig. 6. F-test results showed that when
Tp = 0.8 and 0.9, there is no significant difference between the PCJO and the two experts. From Fig.6 we can see that when Tp = 0.9 the PCJO reaches the nearest approximation of the experts’ task performance. This is also coherent with the setting in [20], where Tp was set to 0.9.
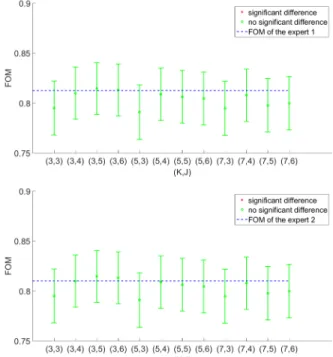
With Tp = 0.9, we then compared the wAFROC1 FOMs of the PCJO to those of the experts with different combinations of the
number of steerable channels K and the number of scale-shiftable channels J, as shown in Fig. 7. Here, we observe Fig. 5 JAFROC1 FOMs of the PCJO under different combinations of the number of steerable channel K and the number of scale-shiftable channel J, and the significance testing results between the PCJO and each of the four radiologists for abdominal CT image
again the same influences of K and J as in the above section (section IV.A): K hardly influences the PCJO’s FOM while J does. There is no significant difference between the PCJO’s performance and that of the experts for any combination of K and J.
C. Discussion
When comparing the results on the two types of CT images, we observed a behavioral difference between the experts and the radiologists (a significant difference was pointed out between the two groups for hypersignals, but not for
hyposignals). This may indicate that the detection-localization task is more difficult on hypersignals than on hyposignals, since human observers have to read more images to familiarize themselves with this type of abnormalities and to have more experiences of diagnoses on this type of images (the differences between experts and average radiologists) to reach a good task performance. It is known that as the difficulty increases, the HVS’s detection probability threshold rises. In order to approach human performance, the PCJO involves an HVS FIG.6The wAFROC1 FOM of the PCJO under different threshold Tp for cerebral CT images vs. those of two experts
TABLEIII
THE TASK PERFORMANCES OF ALL RADIOLOGISTS FOR CEREBRAL CT IMAGES
Overall F-test results
F statistic 13.08
ndf (numerator degrees of freedom) 3 ddf (denominator degrees of freedom) 237
p-value 0.00
FOM for individual radiologists
wAFROC1 FOM Detection rate
E1 0.81 0.64
E2 0.81 0.66
R1 0.75 0.78
R2 0.68 0.54
Paired Differences
Difference p-value Confidence Interval E1-E2 0.00 0.88 [-0.03, 0.04] E1-R1 0.06 0.00 [0.03, 0.10] E1-R2 0.14 0.00 [0.07, 0.20] E2-R1 0.06 0.00 [0.03, 0.09] E2-R2 0.13 0.00 [0.07, 0.20] R1-R2 0.07 0.02 [0.01, 0.13]
Fig. 7 JAFROC1 FOMs of the PCJO under different combinations of the number of steerable channel K and the number of scale-shiftable channel J, and the significance testing results between the PCJO and each of the four radiologists for cerebral CT image
TABLEIV
NUMBER OF LL MARKS AND NL MARKS UNDER DIFFERENT THRESHOLD TP
OF THE PCJO FOR CEREBRAL CT IMAGES
Tp LL NL 0.1 216 11 0.2 216 6 0.3 216 10 0.4 216 12 0.5 215 9 0.6 212 8 0.7 197 7 0.8 182 6 0.9 144 5
the two tasks can consequently explain why the Tp should be higher in the cerebral experiment (0.5~0.7) than that in the abdominal experiment (0.8~0.9).
The results in this study are highly consistent with the findings reported in our previous study [20], even though the experiments are conducted by radiologists from two different countries (China and France, respectively) and on different modalities (CT and MRI, respectively). These cannot be merely coincident. We thus draw some conclusions on the PCJO: 1. Though the PCJO was originally proposed based on the MR
image backgrounds, it can be generalized to other modalities, where the CGB could model the background more or less correctly.
2. With the number of steerable channels K=3 and the number of scale-shiftable channels J=4, the PCJO can approach well (with no statistically significant difference) the radiologist’s and the expert’s detection-localization performance in the hyposignal and hypersignal task, respectively. The small number of channels then renders the PCJO more efficiently (the PCJO executes faster with less channels).
3. The reference value of the Tp could be 0.5 for hyposignals and 0.9 for hypersignals to mimic experts. The reference value may need to be adjusted according to the circumstances of a particular application, considering that the uncertainties in the clinical studies are often greater than those in the lab.
In addition, it is worth to notice that human readers (both experts and general radiologists) had high false negative rates in our 2D image experiments, cf. the low detection rates in Tables I and IV. Indeed, by observing the experiments and talking to the radiologists after the experiments, we noted that they could not really tell the difference between the lesions and the cerebral cortex that also appears as signals, without referring to the information in the adjacent slices, in some difficult cases. Thus when the simulated lesions were close to the cerebral cortex, which may also happen in the real clinical cases, the radiologists may miss them. Actually, in our previous studies on MR images, we inquired into the changes in radiologists’ performances from single-slice (2D) experiment to multi-slice (3D) experiment [27-28]. The comparison results [28] showed that both experts and radiologists improved their detection rate with the help of volumetric information (adjacent slices): an expert’s detection rate could be increased from 0.72 to 0.90; general radiologists’ detection rates could be increased from 0.65 to 0.77 on average. In this study, we extracted 2D non-contiguous slices from 3D CT images, since we wanted to concentrate firstly on the extension of the PCJO for 2D images. But we believe that the human readers’ performances can also be improved when we show them volumetric CT images. This is also one of our future works, to compare human readers’ performances on reading multi-slice images with that of an extension of our previously proposed multi-slice PCJO (msPCJO).
In this paper, we extended the PCJO for hyposignals detection-localization task in order to propose a highly clinical relevant MO. Then, we applied the new PCJO on both cerebral and abdominal CT images. Experimental results showed that it can predict well the experts’ performances in the joint detection-localization task for both hypersignals and hyposignals. Combined with its results on MR images in the previous study, the PCJO also showed its generality on another modality - CT. Although the PCJO model is parametric, the highly coherent results of the two studies allow us setting the best empirical values of all the three parameters (K=3, J=4, Tp = 0.5 for hyposignals or 0.9 for hypersignals) for its application on MR and CT image quality assessments. All these features make the PCJO a promising method for evaluating image processing algorithms from the medical experts’ point of view in the future.
One limitation of the study is the small number of experts and the limited patient data. The test CT images were selected from only 10 healthy subjects. Even though the slices are non-contiguous, it is still likely that a lot of them are correlated. This may have an impact on the statistical analysis. Since finding available experts in one hospital is very difficult and collecting real patient data is very costly, they remain two difficulties in the medial domain. We are open for collaborations, hoping to have more experts and real patient data to further validate the conclusions of this study. Another limitation of the study is that we did not verify how PCJO performs in the benchmark of different image processing algorithms. If the PCJO can output the same ranking as radiologists do, this can further prove its usefulness in the medical image quality assessment. This is actually our short-term objective: to use the PCJO for ranking different medical compression ratios and comparing the low-dose CT image qualities to the high-dose ones [29-30].
ACKNOWLEDGEMENTS.
The authors would like to thank Professor Jean-Louis Coatrieux (IEEE Life Fellow) for reviewing and giving valuable comments on this paper, and Professor Dev Chakraborty for providing and explaining to us the wAFROC1 tool.
REFERENCES
[1] Z Chen, D. D. Feng, WD Cai et al., “Performance evaluation of functional medical imaging compression via optimal sampling schedule designs and cluster analysis,” IEEE Trans. Biomedical Engineering, Vol.52, no.5, pp. 943-945, May. 2005.
[2] S Li, H Yin, L Fang et al., “Group-sparse representation with dictionary learning for medical image denoising and fusion,”. IEEE Trans.
Biomedical Engineering, vol 59, no 12, pp. 3450-3459, Dec.2012.
[3] G. S. P. Mok, T Sun, T. C. Huang et al., “Interpolated average CT for attenuation correction in PET-A simulation study,” IEEE Trans.
Biomedical Engineering, vol. 60, no 7, pp. 1927-1934, Jul.2013.
[4] JG Brankov, Y Yang, L Wei et al., “Learning a channelized observer for image quality assessment,” IEEE Trans. Medical Imaging, vol.28, no.7, pp.991-999, Jul.2009.
[5] D. S. Lalush, M. K. Jatko, W. P. Segars, “An observer study methodology for evaluating detection of motion abnormalities in gated myocardial
perfusion SPECT,”, IEEE Trans. Biomedical Engineering, vol. 52, no. 3, pp. 480-485, Mar.2005.
[6] H. H. Barrett, K. J. Myers, “Foundations of image science,” New York:
Wiley & Sons, Oct. 2004.
[7] He X, Park S. “Model observers in medical imaging research,”
Theranostics, vol.3, no.10, pp.774-786, Oct.2013.
[8] H. H. Barrett, J Yao, J. P. Rolland et al., “Model observers for the assessment of image quality,” in Proceedings of the National Academy of
Sciences, D. C. Wilson and J. N. Wilson, Eds., vol. 90. SPIE, 1993, pp.
9758–9765.
[9] K. J. Myers, H. H. Barrett, “Addition of a channel mechanism to the ideal-observer model,” JOSA A, vol.4, no.12, pp.2447-2457, Dec.1987. [10] J Yao, H. H. Barrett, “Predicting human performance by a channelized
Hotelling observer model,” in San Die-go'92. International Society for
Optics and Photonics, 1992, pp.161-168.
[11] I Hernandez-Giron, A Calzado, J Geleijns et al., “Comparison between human and model observer performance in low-contrast detection tasks in CT images: application to images reconstructed with filtered back projection and iterative algorithms,” The British Journal of Radiology, vol. 87, no. 1039, Jul. 2014.
[12] F. E. Elshahaby, M Ghaly, X Li, A Jha et al., “Estimating model observer performance with small image ensembles,” Journal of Nuclear Medicine, vol.56, no.3, May.2015.
[13] L Zhang, C Cavaro-Ménard, P Le Callet, “An overview of model observers,” IRBM-Ingénierie et Recherche Biomédicale, Elsevier Masson
- Elsevier,vol.35, no.4, pp.1-6, Sept.2014.
[14] G Acharian, N Guyader, J.M. Vignolle et al.(March 11, 2014), A model observer based on human perception to quantify the detectability. Presented at Proc. SPIE 9037, Medical Imaging 2014: Image Perception,
Observer Performance, and Technology Assessment, 903710.
[15] TS Lee, EC Frey, BMW Tsui, “Development of 4D mathematical observer models for the task-based evaluation of gated myocardial perfusion SPECT,” Physics in Medicine & Biology, vol.60, no.7, pp. 2751-2763, Apr.2015.
[16] HC Gifford, A Sen, R Azencott (FEB 25-26, 2015), SVM-based Visual-search Model Observers for PET Tumor Detection. Presented at
Proc. SPIE 9416, Medical Imaging 2015.
[17] Z Jiang, Z Liang, M Das et al.( FEB 25-26, 2015), Towards using eye tracking data to develop visual-search observers for x-ray breast imaging. Presented at Proc. SPIE 9416, Medical Imaging 2015.
[18] L Zhang, B Goossens, C Cavaro-Ménard et al., “Channelized model observer for the detection and estimation of signals with unknown amplitude, orientation, and size,” JOSA A, vol.30, no.11, pp. 2422-2432, Nov.2013.
[19] C Cavaro-Ménard, L Zhang, P Le Callet (5-6 July 2010), Diagnostic quality assessment of medical images: Challenges and trends. Presented at Visual Information Processing (EUVIP), 2010 2nd European
Workshop on. IEEE.
[20] L Zhang, C Cavaro-Ménard, P Le Callet et al., “A perceptually relevant channelized joint observer (PCJO) for the detection-localization of parametric signals,” IEEE Trans. Medical Imaging, vol.31, no.10, pp.1875-1888, Oct.2012.
[21] Turkowski K(1990), Filters for common resampling tasks. Presented at
Graphics gems. Academic Press Professional, Inc.. pp.147-165.
[22] S Daly, “The visible differences predictor: an algorithm for the assessment of image fidelity,” in Digital Image and Human Vision, A. B. Watson, Ed. Cambridge, MA: MIT Press, 1993.
[23] DP Chakraborty, KS Berbaum, “Observer studies involving detection and localization: Modeling, analysis and validation,” Medical Physics, vol.31, no.8, pp.2313-2330, 2004.
[24] DP Chakraborty, “New Developments in Observer Performance Methodology in Medical Imaging,” Seminars in Nuclear Medicine, vol. 41, no.6, pp.401-418, 2011.
[25] SL Hillis, S. L, “A comparison of denominator degrees of freedom methods for multiple observer ROC studies,” Statistics in medicine, vol.26, no.3, pp.596-619, 2007.
[26] B Efron, RJ Tibshirani, “An Introduction to the Bootstrap,” Boca Raton: Chapman & Hall/CRC, 1993.
[27] L Zhang, C. Cavaro-Ménard, P. Le Callet, D. GE (19-24 April 2015), A multi-slice model observer for medical image quality assessment. Presented at ICASSP.
[28] L Zhang, “Numerical observers for the objective quality assessment of medical images.” PhD thesis, November 2012.
[29] Y Chen, WF Chen, XD Yin et al., “Improving low-dose abdominal CT images by weighted intensity averaging over large-scale neighborhoods,”
European Journal of Radiology, vol.80, no.2, pp.e42-e49, Nov.2011.
[30] Y Chen, LY Shi, LM Luo et al., “Artifact suppressed dictionary learning for low-dose CT image processing,” IEEE, Trans. Medical Imaging, vol.33, no.12, pp.2271-2292, Dec.2014.