HAL Id: hal-02274445
https://hal-mines-albi.archives-ouvertes.fr/hal-02274445
Submitted on 28 Sep 2020HAL is a multi-disciplinary open access
archive for the deposit and dissemination of sci-entific research documents, whether they are pub-lished or not. The documents may come from teaching and research institutions in France or abroad, or from public or private research centers.
L’archive ouverte pluridisciplinaire HAL, est destinée au dépôt et à la diffusion de documents scientifiques de niveau recherche, publiés ou non, émanant des établissements d’enseignement et de recherche français ou étrangers, des laboratoires publics ou privés.
Distributed under a Creative Commons Attribution| 4.0 International License
Using X-Ray tomography to evaluate porosities in
composite parts
Rébecca Bonnaire, Julien Patou, Emmanuel de Luycker, Thierry Cutard,
Gérard Bernhart
To cite this version:
Rébecca Bonnaire, Julien Patou, Emmanuel de Luycker, Thierry Cutard, Gérard Bernhart. Using X-Ray tomography to evaluate porosities in composite parts. 24e Congrès Français de Mécanique (CFM 2019), Aug 2019, Brest, France. �hal-02274445�
24
Congrès Français de Mécanique
Brest, 26 au 30 Août 2019
Using X-Ray tomography to evaluate porosities in
composite parts
R. BONNAIRE
a, J. PATOU
b, E. de LUYCKER
c, T. CUTARD
d, G.
BERNHART
ea. Institut Clément Ader (ICA) ; Université de Toulouse ; CNRS, IMT Mines Albi,
INSA, ISAE-SUPAERO, UPS ; Campus Jarlard, F-81013 Albi, France +
[email protected]
b. Institut Clément Ader (ICA) ; Université de Toulouse ; CNRS, IMT Mines Albi,
INSA, ISAE-SUPAERO, UPS ; Campus Jarlard, F-81013 Albi, France +
[email protected]
c. Laboratoire Génie de Production (LGP), Université de Toulouse, EA 1905
INP-ENIT, Tarbes, France +
[email protected]
d. Institut Clément Ader (ICA) ; Université de Toulouse ; CNRS, IMT Mines Albi,
INSA, ISAE-SUPAERO, UPS ; Campus Jarlard, F-81013 Albi, France +
[email protected]
e. Institut Clément Ader (ICA) ; Université de Toulouse ; CNRS, IMT Mines Albi,
INSA, ISAE-SUPAERO, UPS ; Campus Jarlard, F-81013 Albi, France +
[email protected]
Résumé
Dans le domaine de l’aéronautique et de l’automobile, la fabrication de composite par consolidation est fortement utilisée afin de répondre aux problématiques de réduction de masse des structures et d’optimisation des coûts. Au cours du processus de fabrication, des porosités apparaissent dans les composites. Un cyle de fabrication adéquate doit être mis en place afin de minimiser ces porosités inter et intra laminaires. Ces porosités ont une influence sur les propriétés mécaniques des composites. C’est pourquoi, il est important de les étudier. L’objectif de cette étude est de développer un nouveau moyen d’étude des porosités dans les composites. La méthode permet non seulement de mesurer le taux de porosité mais aussi la taille, la localisation et la morphologie de ces porosités. La technique non-destructive utilisée consiste en l’utilisation d’un tomographe à rayons X afin d’analyser l’intérieur de la structure. Les porosités sont catégorisées suivant leur taille et leur forme. Cette méthode a été appliquée à un composite Carbone/PPS fabriqué suivant des cycles de consolidation différents pour faire varier le taux de porosités.
Abstract
In aeronautics and automotive applications, manufacturing composite by consolidation is mainly used in order to answer current weight reduction and optimization cost problematics. During the process, voids appear in the composite parts. An adequate process cycle must be selected to reach minimum
24
Congrès Français de Mécanique
Brest, 26 au 30 Août 2019
porosity content within the laminate. These voids have influence on mechanical properties of composite parts. That's why, it is important to study these voids. Objectives of this study is to develop a new way to study porosity in composite parts. This method permits not only to measure the voids ratio but also the voids size, location and morphology. The non-destructive technic consists of using X-ray beam to analyse the sample structure. Voids size allows to categorize the porosities present in the specimen. This method was applied on carbon composite C/PPS manufactured with several consolidation cycles in terms of consolidation pressure, processing temperature, consolidation time and vacuum levels.
Keywords: Porosities / Composite parts / X-ray Tomography / Image
processing / Aeronautics
1
Introduction
In aeronautic and automotive applications, manufacturing composite parts by consolidation is mainly used in order to answer current weight reduction and optimization cost problematics. During the process, voids appear in the composite parts. The porosities are interstitial void interconnected or not. There are two types of porosities: (i) open porosities consisting of pores interconnected with one another and on the surface of the material, (ii) closed porosities completely isolated from the external environment. All these mechanisms can influence microstructure quality with a porosity level in function of consolidation cycle and the type of the textile reinforcement.
Lystrup [1] evaluated the influence of different parameters of autoclave process to the material integrity of different carbon/PEEK semi-finished products. A correlation between the external pressure to the vacuum bag and the composite void ratio was shown. Increase external pressure decreases porosity contents.
The vacuum generated in the plastic sheet, used to ensure a first compaction of the reinforcement and to evacuate the air bubbles trapped in the plies, is also linked to the void ratio. Chambers [2] experimentally shows in a specific composite, that vacuum level decrease increases the mean void ratio. Porosities with more than 0.03 mm² surface area are more sensitive to the decreasing of the vacuum level. The effect is lower for smaller porosities.
Porosities in composite material degrade the mechanical properties. Nevertheless, the deterioration level depends on the mechanical load. Increase void ratio changes the mechanical properties during the interlaminar shear load for carbon/epoxy composites [3-8]. Ledru [9] shows a decrease of approximate 6% of the maximal stress during interlaminar shear load per unit of the volume void ratio. Increasing the number of porosities particularly affects the inter-ply area. Bending stresses are also impacted by the void ratio but not to the same degree. An increasing void ratio decreases the yield stress in static and dynamic condition and the stiffness modulus in flexion [1] [5-6]. Porosities act as an initiation site and cracks propagation weaken the composite. Maximum stress in traction softly decrease with the increase of void ratio [5-6]. Young’s modulus is not very sensitive to the void ratio fluctuation. Tang [7] shows that there is a link between the maximum stress in compression and the void ratio. This kind of results was found with composite with glass fibers and polypropylene resin [10-12]. It can be extended to the thermoplastic resin composite. Void ratio has influence on shear and flexion stresses. Some studies [2] [4] [7] define the notion of critical void ratio. This value would depend on the material properties and define a limit value below which the stress and modulus properties would no longer be sensitive to the void ratio. Most of the studies focus on the link between the mechanical properties and the volumetric void ratio. This link is not accepted by all scientists, because it’s too
24
Congrès Français de Mécanique
Brest, 26 au 30 Août 2019
simplistic [1] [13-14]. Other studies must be done to obtain characteristics of the porosities: volume, geometric shape, localization and orientation.
Two experimental tools seem to be adapted for this kind of measurements: ultrasonic measurement and X-ray tomography. The ultrasonic measurement uses ultrasonic waves to characterize the microstructural characteristics of a material. Ultrasonic waves, emitted from a defined frequency and amplitude emitter, pass through the material. Due to the microstructural properties of the material, the signal is impacted by reflection and scattering phenomena. The ultrasonic output signal is measured to determine the signal attenuation, which can be determined as the ratio between the output signal and the input signal [15]. By scanning the entire surface of the object, we obtain a map of the attenuation at any point on the surface of the object. Knowing the attenuation of the signal for a reference material, without porosities, it is possible to evaluate the thickness of the laminate, to detect the porosity presence and to have a first estimation of the volumetric void ratio and the porosity morphology. Ultrasonic measurement is a good quality control and qualitative tool but not a quantitative one. With this method, it is not possible to detect porosities with section area smaller than 60 µm², typical size of the micro-porosities [9]. This method allows to asses the porosity distribution in the room volume and to check the homogeneity of this distribution. X-ray tomography can be used to analyze the reinforcement [16] and porosities in a composite part like the volumetric content, the orientation, the geometry and the localization of porosities [3] [17-21]. Nevertheless, no study, in our knowledge, uses X-ray tomography to characterize porosities in Carbon/Polyphenylene Sulfide (C/PPS) composite.
The aim of this study is to use X-ray tomography (CT-Scan) to study void ratio, localization, orientation and circularity in C/PPS composite parts. In the first part, we will present the composite, the X-ray tomography technic and the porosity characteristic measurements. Results and discussion will follow.
2
Materials and methods
2.1 Composite properties
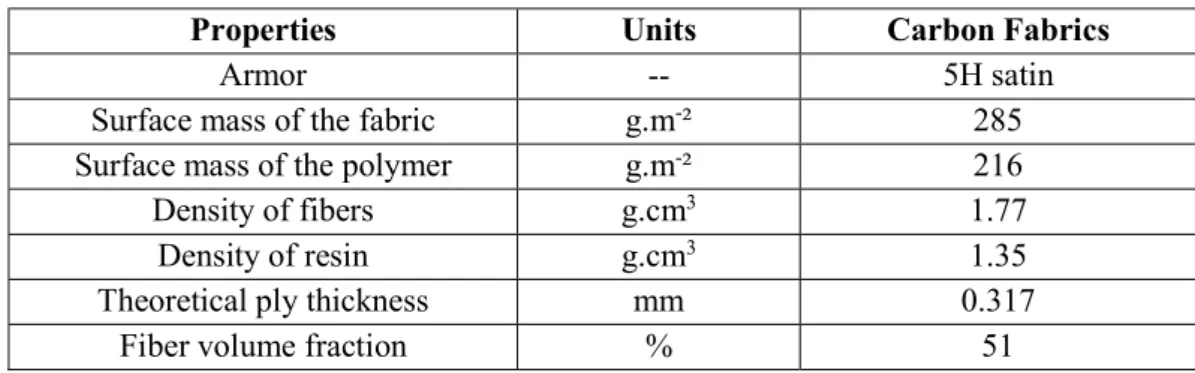
C/PPS composite with carbon fabrics from the PORCHER-Industries® (Eclose-Badinières, France) is used in this study. The properties of this composite are given in the Table 1.
Table 1: Properties of the C/PPS composite.
Properties Units Carbon Fabrics
Armor -- 5H satin
Surface mass of the fabric g.m-² 285
Surface mass of the polymer g.m-² 216
Density of fibers g.cm3 1.77
Density of resin g.cm3 1.35
Theoretical ply thickness mm 0.317
Fiber volume fraction % 51
In the composite, the polymer is applied on the fabric surface as "small" drops. This method of integrating the polymer improves inter-ply impregnation. There is no impregnation of the fabric by the
24
Congrès Français de Mécanique
Brest, 26 au 30 Août 2019
resin during the manufacturing of the semi-finished product. During the implementation of the composite, part of the resin will impregnate the reinforcement.
Five different plane parts of the C/PPS composite, named A, B, C, D and E, were manufactured with different process to obtain different porosity properties. Ten specimens were cut inside each part to make structural analysis of the porosities with X-ray tomography and acid digestion.
2.2 X-Ray tomography
To study the morphology of the composite, X-ray tomography (CT-Scan) was used. The aim was to obtain volume, shape and orientation of the voids inside the consolidated composite parts. Five specimens, sized 20 per 10 per 2 mm3 per composite parts, were analysed with the Easytom 130
(Figure 1). The beam energy is set at 44 kV and the source intensity at 181μA. The spatial resolution was 11.2µm ±0.8 µm. The 3D images were converted into 8 bits images.
(a) (b)
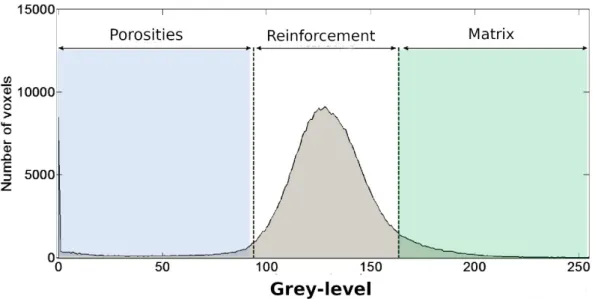
Figure 1: Easytom 130 X-ray Tomography in Clément Ader Institut (a) Outside view (b) Inside view. There are three different grey levels, corresponding to voids, matrix and carbon fabric. These three levels appear in all histogram of all images obtained by X-ray tomography. One example is given in Figure 2 for one image in the (xy) plane of the composite part C. The middle peak matches the carbon fabric; the right peak matches the voids; the left peak matches the matrix.
Figure 2: Histogram of one image obtained by X-ray tomography in the (xy) plane for one specimen inside the composite part C.
24
Congrès Français de Mécanique
Brest, 26 au 30 Août 2019
2.3 Image analysis
To analyze the porosity properties, it’s necessary to make an image segmentation with one grey-level thresholding to part the porosity from the matrix and the reinforcement. The lower threshold was defined at 0. It exists different methods to determine the upper threshold [22-23]. A new one was developed for this study, because of the difficulty of separating the micro-porosities from the reinforcement. Contrast between these two elements is low. This new method consists of interpolating the grey-level curve by gauss distribution. Then the point of slope change is calculated. The upper threshold is the extremum of the second derivative of the curve.
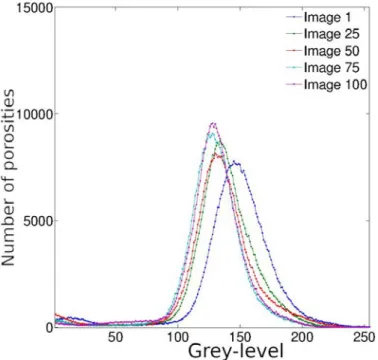
As brightness between the images are different, the middle grey-level changes between images, as shown in Figure 3. It’s not possible to calculate only one upper threshold and to use it in all images of one specimen. The upper threshold was calculated for all images, using one script in Matlab® software (Mathworks).
Figure 3: Grey-level histogram for five different images in the (xy) plane of the same specimen inside the composite part C.
2.4 Porosity characteristic measurements
Using the segmentation of 3D images, the void ratio can be calculated:
(1) with nimages, the number of images, Nvoids, the voxel number of the void part and Nspecimen, the voxel
number of the specimen.
This void ratio is compared to the one obtained by acid digestion. Acid digestion was performed in all composite plane parts with reference to the standard NF EN 2564. This method consists in degrading the matrix with a solution of sulphuric acid (H2SO4) in order to extract the carbon fibers and to obtain
24
Congrès Français de Mécanique
Brest, 26 au 30 Août 2019
acid digestion is calculated with a minimum of three specimens in one composite part. The void ratio is calculated by the given expression:
(2)
with and
with mf, the mass of fibers, ms, the mass of specimen, , the specimen density, , the matrix density
and , the fibers density.
To evaluate the surface shape of the voids, the parameter named “circularity” was calculated by this equation:
(3)
with A, the void area in the (xy) plane and p, the void perimeter in the (xy) plane. The circularity compares the contour of each porosity to a circular contour.
All images were analyzed with the software ImageJ with the extension “3D Object Counter” [25] to analyze the size, the shape and the orientation of each porosity. 3D images of the porosities were obtained with Slicer 3D software [26-27].
3
Results
3.1 Void ratio
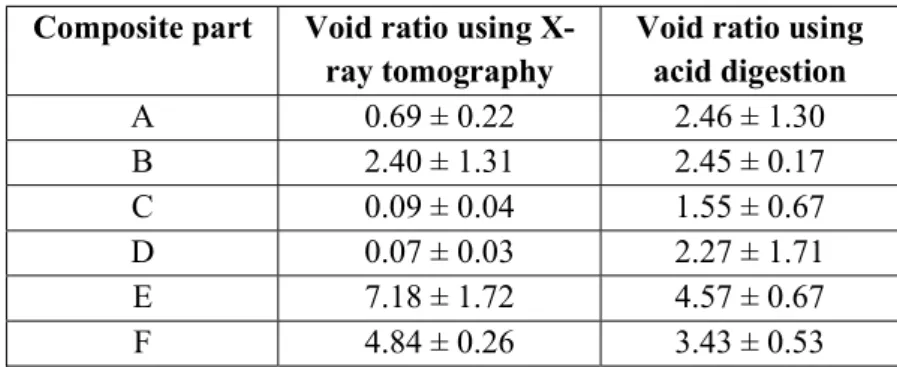
Void contents are given in table 2. Void content is quite similar between the two methods for void ratio higher than 1%. The void ratio calculated using X-ray tomography varies between 0.07% ± 0.03% and 7.18% ± 1.72%. The void ratio calculated using acid digestion varies between 1.55% ± 0.67% and 4.57 ± 0.67. The second method, acid digestion, always gives a void ratio higher than 1%. It’s not possible to measure very low void ratio.
Table 2: Void ratio for all composite parts using two methods. Composite part Void ratio using
X-ray tomography
Void ratio using acid digestion A 0.69 ± 0.22 2.46 ± 1.30 B 2.40 ± 1.31 2.45 ± 0.17 C 0.09 ± 0.04 1.55 ± 0.67 D 0.07 ± 0.03 2.27 ± 1.71 E 7.18 ± 1.72 4.57 ± 0.67 F 4.84 ± 0.26 3.43 ± 0.53
3.2 Void type
Thanks to the X-ray tomography analysis, it is possible to identify three types of porosities:
- Intra-yarn void: It’s small porosities with a diameter corresponding to the size of a carbon fiber. They are inside the lock. There are more inter-yarn porosities when the void ratio is high. They can agitate each other to form very long porosities. They are oriented along the two directions of the reinforcement: warp and weft directions.
24
Congrès Français de Mécanique
Brest, 26 au 30 Août 2019
- Inter-ply void: This porosity is seen only in composite with high void ratio, like the composite part E. These porosities are located between two successive plies. They are in areas with a lot of matrix or between the plies and the matrix.
- Crack in the plies: Some transverse cracks are visible in the lock for composite parts with very low void rate. Their lengths are equal to the length of the small axis of a lock.
The spatial model of porosities clearly shows two principal orientation for the intra-plies’ porosities. They follow the textile reinforcement architecture and reveal the impact of weak consolidation cycle. This kind of porosities is dominant in this C/PPS composite.
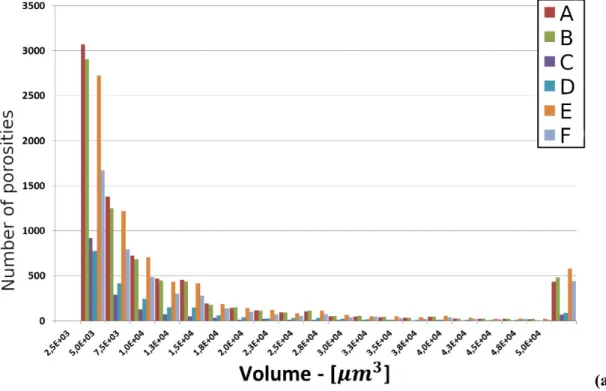
3.3 Volume distribution of porosities
Figure 4 shows the volume distribution of all six plane composite parts. Porosities which are smaller than 2.5.103 µm3 can not be considered due to the spatial resolution of the X-ray tomography. The
porosities are separated in two groups, depending on the volume of the porosities: - "Micro-porosities", for which the volume is less than 5 000 µm3
- "Macro-porosities", for which the volume is more than 5 000 µm3
A large majority of the porosities (about 60%) have volume between 2.5.103 µm3 and 1.0.104 µm3. For
the "Micro-porosities", the volume distribution of the porosities follows an exponential decay. For the "micro-porosities", there is no difference between the six composite parts. For the "macro-porosities", the higher is the void ratio, the more is the "macro-porosities". For composite parts with low porosity ratio, part C and D, the proportion of the "macro-porosities" represents only 4% of the total number of the porosities. It confirms the low void ratio for these parts. These results are in adequacy with the low void ratio.
24
Congrès Français de Mécanique
Brest, 26 au 30 Août 2019
(b) Figure 4: The volume distribution of the porosities for the six composite plane parts separated in two groups: (a) Micro-porosities (volume ≤ 5000 µm3) and (b) Macro-porosities (volume ≥ 50.000 µm3).
3.4 Circularity of the porosities
Figure 5 shows porosity distribution in terms of surface geometry. Only the "macro-porosities" are analyzed in order to improve the readability of the results. For all six composite parts, the circularity of the porosities is between 0 and 0.3 which is characteristic to elliptical shape. As the porosity ratio increases, the proportion of the elongated porosities also increases. For composite parts C and D, there are very few elongated porosities. There is a correlation between the void ratio and the proportion of the porosities with an elliptical shape.
24
Congrès Français de Mécanique
Brest, 26 au 30 Août 2019
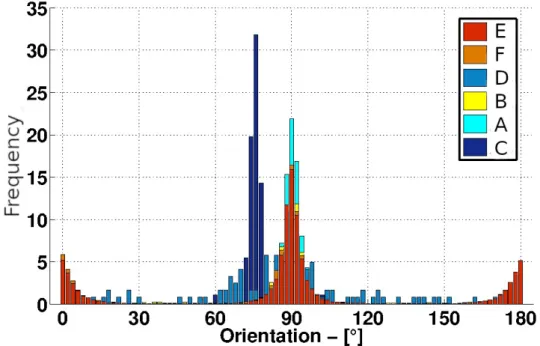
3.5 Orientation of the porosities
Orientation of the "macro-porosities" is given in Figure 6 for the six composite laminates. There are two main directions: 0° and 90° corresponding to the warp and weft directions of the textile reinforcement.
Figure 6: Distribution of the porosities in terms of their orientation for the six composite plane parts.
4
Discussion
The aim of this study is to develop a new method to analyze porosities inside the composite parts. This method permits to measure the void ratio, the volume distribution of porosities, the circularity of porosities and the orientation of porosities. All these parameters were obtained by X-ray tomography. It is a non-destructive method. Furthermore, the morphological analysis corroborates the qualitative analyze in terms of shape, orientation and size of the porosities inside the powdered composite parts. The detection of micro-porosities is better than with the acid digestion method. Results in Table 2 shows that when the void ratio is very low (less than 2%), measurement with acid digestion is not accurate. It is the case for the composite part A, C and D. Standard deviation for the void ratio using acid digestion is more than 1%. Nevertheless, void ratio using X-ray tomography should be more evaluated for higher level (more than 2%). For the specimen E, void ratio seems to be less accurate. No study, in our knowledge, uses X-ray tomography to characterize porosities in Carbon/Polyphenylene Sulfide (C/PPS) composite. Moreover, in this study, the analyze of the porosities are more complete. The orientation of the porosities is a measurement which is not done in other studies, in our knowledge. This new parameter can be used to explain the mechanical properties of the composite part [28]. Other studies used tomography methods to analyze porosities. However, in these studies, authors did not create a 3D reconstruction of all porosities [17] or little specimens were analyzed because of using micro-tomography [18-19] or they did not study consolidated composite [21]. 3D reconstruction is possible for all section of the composite part: porosities, fibers and resin. It can be a way to analyze the fibers orientation and distribution after consolidation of the composite part. In this study, it is possible to characterize bigger composite part such as complex shape. This
24
Congrès Français de Mécanique
Brest, 26 au 30 Août 2019
method can be considered to evaluate fibers deformation during mechanical tests inside the tomography [29].
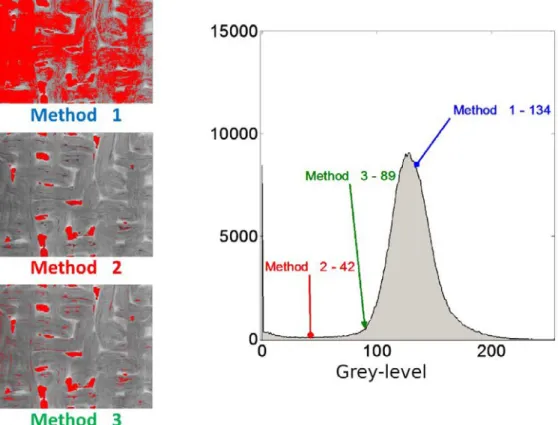
Figure 7: Methods of thresholding porosities for the composite plate C.
Indeed, the most important development in this study is the method used to threshold 3D images obtained by the X-ray tomography method. Figure 7 shows three different possibilities to calculate the upper threshold:
- Method 1: "IsoData" [30]
- Method 2: "Minimum Cross Entropy thresholding" [31] - Method 3: "New method".
Micro-porosities and elongated porosities have low contrast. The mean grey-level of images varies depending on the situation in the specimen because of the tomography method itself. Thresholding is also difficult. Methods 1 and 2 was testing but thresholding was not satisfactory as shown in Figure 7. Advantages of method 3 is that thresholding is accurate for all images and can be automatically made for all specimens. It can be used to separate other sections in the composite parts.
5
Conclusion and perspectives
This study is a beginning of other studies making the link between the void distribution, the void volume, the void shape and the void localization in the reinforcement. The aim is to obtain in situ mechanical properties of composite parts to evaluate the evolution of the porosity microstructure during the mechanical tests. With the initial microstructure of the composite part, it would be possible to determine the specific porosities responsible for the decrease of the mechanical strength.
24
Congrès Français de Mécanique
Brest, 26 au 30 Août 2019
References
[1] A. Lystrup, T. L. Andersen, Autoclave consolidation of fibre composites with a high temperature thermoplastic matrix, Journal of Materials Processing Technology 77.1-3 (1998) 80–85
[2] A. R. Chambers, J. S. Earl, C. A. Squires et M. A. Suhot, The effect of voids on the flexural fatigue performance of unidirectional carbon fibre composites developed for wind turbine applications, International Journal of Fatigue 28.10 (2006) 1389–1398
[3] I. Gagauz, L. F. Kawashita, S. R. Hallet, Effect of voids on interlaminar behaviour of carbon/epoxy composites, in: Proceeding of the 17th European Conference on Composite Materials (ECCM 17), Munich, Germany, 2016, p.8
[4] H. Jeong, Effects of voids on the mechanical strength and ultrasonic attenuation of laminated composites, Journal of Composite Materials 31.3 (1997) 276–292
[5] L. Liu, B.-M. Zhang, D.-F. Wang, Z.-J. Wu, Effects of cure cycles on void content and mechanical properties of composite laminates, Composite Structures 73.3 (2006) 303–309
[6] P. Olivier, J. P. Cottu, B. Ferret, Effects of cure cycle pressure and voids on some mechanical properties of carbon/epoxy laminates, Composites 26.7 (1995) 509–515
[7] J.-M. Tang, W. I. Lee, G. S. Springer, Effects of Cure Pressure on Resin Flow, Voids, and Mechanical Properties, Journal of Composite Materials 21.5 (1987) 421–440
[8] H.-Y. Zhu, D.-H. Li, D.-X. Zhang, B.-C. Wu et Y.-Y. Chen, Influence of voids on interlaminar shear strength of carbon/epoxy fabric laminates, Transactions of Nonferrous Metals Society of China 19 (2009) 470–475
[9] Y. Ledru, Etude de la porosité dans les matériaux composites stratifiés aéronautiques, Thèse de doctorat, Université de Toulouse, 2009.
[10] L. Ye, V. Klinkmuller, K. Friedrich, Impregnation and Consolidation in Composites Made of GF/PP Powder Impregnated Bundles, Journal of Thermoplastic Composite Materials 5 (1992) 32–48 [11] V. Klinkmüller, R. Kastel, L. Ye, K. Friedrich, On Impregnation Quality and Resulting Mechanical Properties of Compression Moulded Commingled Yarn Based Thermoplastic Composites, in: IUTAM Symposium on Microstructure-Property Interactions, in: Composite Materials, Dordrecht, Netherlands, 1995, pp. 189–201
[12] C. Santulli, R. Brooks, C. D. Rudd, C. Long, Influence of microstructural voids on the mechanical and impact properties in commingled E-glass/polypropylene thermoplastic composites, Journal of Materials: Design and Applications 216.2 (2002) 85–100
[13] J. Lambert, A. R. Chambers, I. Sinclair, S. M. Spearing, 3D damage characterisation and the role of voids in the fatigue of wind turbine blade materials, Composites Science and Technology 72.2 (2012) 337–343
[14] M. R. Wisnom, T. Reynolds, N. Gwilliam, Reduction in interlaminar shear strength by discrete and distributed voids, Composites Science and Technology 56.1 (1996) 93–101
[15] N. T. Duong, J. Duclos, P. Maréchal, P. Pareige, Cartographie Ultrasonore d’une Plaque de Composite RTM: Estimation de l’Atténuation Locale, in: CFA 2014, Poitiers, France, 2014
[16] P. Badel, Analyse mésoscopique du comportement mécanique des renforts tissés de composites utilisant la tomographie aux rayons X, Thèse de doctorat, INSA Lyon, 2008.
[17] J. Kastner, B. Plank, D. Salaberger, J. Sekelja, Defect and Porosity Determination of Fibre Reinforced Polymers by X-ray Computed Tomography, in: 2nd International Symposium on NDT in Aerospace, Hamburg, Germany, 2010
[18] J. E. Little, X. Yuan, M. I. Jones, Characterisation of voids in fibre reinforced composite materials, NDT and E International 46 (2012) 122–127
24
Congrès Français de Mécanique
Brest, 26 au 30 Août 2019
[19] Y. Nikishkov, L. Airoldi, A. Makeev, Measurement of voids in composites by X-ray Computed Tomography, Composites Science and Technology 89 (2013) 89–97
[20] J. S. U. Schell, M. Renggli, G. H. van Lenthe, R. Müller, P. Ermanni, Micro-computed tomography determination of glass fibre reinforced polymer meso-structure, Composites Science and Technology 66.13 (2006) 2016–2022
[21] D. Zhang, D. Heider, J. W. Gillespie Jr, Determination of void statistics and statistical representative volume elements in carbon fiber reinforced thermoplastic prepregs, Journal of Thermoplastic Composite Materials (2015) 1–17
[22] L.-K. Huang, M.-J. J. Wang, Image thresholding by minimizing the measure of fuzziness, Pattern Recognition 28 (1995) 41–51
[23] N. Otsu, A threshold selection method from gray level histograms, IEEE Trans. Systems, Man and Cybernetics 9 (1979) 62–66
[24] E. Bessard, Matériaux composites structuraux à base PEEK élaborés par thermo-compression dynamique: relation procédé-propriétés, Thèse de doctorat, Université de Toulouse III, 2012.
[25] S. Bolte, F. P. Cordelières, A guided tour into subcellular colocalisation analysis in light microscopy, Journal of Microscopy 224.3 (2006) 213–232
[26] A. Fedorov, R. Beichel, J. Kalpathy-Cramer, J. Finet, J.-C. Fillion-Robin, S. Pujot, C. Bauer, D. Jennings, F. Fennessy, M. Sonka, J. Buatti, S. Aylward, J. V. Miller, S. Pieper, R. Kikinis, 3D Slicer as an Image Computing Platform for the Quantitative Imaging Network, Magnetic Resonance Imaging 30.9 (2012) 1323–1341
[27] R. Kikinis, S. Pieper, K. G. Vosburgh, 3D Slicer: A Platform for Subject-Specific Image Analysis, Visualization, and Clinical Support, Intraoperative Imaging and Image-Guided Therapy. Springer, New York, USA, 2014, p. 277–289
[28] J. Patou, R. Bonnaire, E. De Luycker, G. Bernhart, Influence of consolidation process on voids and mechanical properties of powdered and commingled carbon/PPS laminates, Composite Part A 117 (2019) 260-275
[29] J. Hemmer, C. Burtin, C. Binetruy, S. Comas-Cardona, T. Savart, A. Barbeau, Evolution de la microstructure des renforts fibreux lors du procédé d’infusion: caractérisation par micro-tomographie X, in: Journée Nationale sur les Composites, Champs-sur-Marne, France, 2017
[30] T. W. Ridler, S. Calvard, Picture thresholding using an iterative selection method, IEEE 8.8 (1978) 630–632
[31] C. H. Li, C. K. Lee, Minimum Cross Entropy Thresholding, Pattern Recognition 26.4 (1993) 617–625