HAL Id: hal-01829722
https://hal.archives-ouvertes.fr/hal-01829722
Submitted on 4 Jul 2018
HAL is a multi-disciplinary open access
archive for the deposit and dissemination of
sci-entific research documents, whether they are
pub-lished or not. The documents may come from
teaching and research institutions in France or
abroad, or from public or private research centers.
L’archive ouverte pluridisciplinaire HAL, est
destinée au dépôt et à la diffusion de documents
scientifiques de niveau recherche, publiés ou non,
émanant des établissements d’enseignement et de
recherche français ou étrangers, des laboratoires
publics ou privés.
A novel facility for reduced-gravity testing: A setup for
studying low-velocity collisions into granular surfaces
Cecily Sunday, Naomi Murdoch, Olivier Cherrier, Sara Morales Serrano,
Claudia Valeria Nardi, Tristan Janin, Iris Avila Martinez, Yves Gourinat,
David Mimoun
To cite this version:
Cecily Sunday, Naomi Murdoch, Olivier Cherrier, Sara Morales Serrano, Claudia Valeria Nardi, et al..
A novel facility for reduced-gravity testing: A setup for studying low-velocity collisions into granular
surfaces. Review of Scientific Instruments, American Institute of Physics, 2016, 87 (8), pp.084504.
�10.1063/1.4961575�. �hal-01829722�
Any correspondence concerning this service should be sent to the repository
administrator:
[email protected]
O
pen
A
rchive
T
OULOUSE
A
rchive
O
uverte (
OATAO
)
OATAO is an open access repository that collects the work of Toulouse researchers and
makes it freely available over the web where possible.
This is an author-deposited version published in:
http://oatao.univ-toulouse.fr/
Eprints ID: 16156
To cite this version:
Sunday, C. and Murdoch, Naomi and Cherrier, Olivier and Morales
Serrano, S. and Valeria Nardi, C. and Janin, T. and Avila Martinez, I. and Gourinat, Yves
and Mimoun, David A novel facility for reduced-gravity testing: A setup for studying
low-velocity collisions into granular surfaces. (2016) Review of Scientific Instruments, vol. 87
(n° 8). pp. 084504. ISSN 0034-6748
A novel facility for reduced-gravity testing: A setup for studying low-velocity
collisions into granular surfaces
C. Sunday,1,a)N. Murdoch,1O. Cherrier,2,3S. Morales Serrano,1C. Valeria Nardi,1 T. Janin,1I. Avila Martinez,1Y. Gourinat,2,3and D. Mimoun1
1Département Electronique, Optronique et Signal (DEOS), Systèmes Spatiaux (SSPA), Institut Supérieur de
l’Aéronautique et de l’Espace (ISAE-SUPAERO), Université de Toulouse, 31055 Toulouse, France
2Département Mécanique des Structures et Matériaux (DMSM), Institut Supérieur de l’Aéronautique et de
l’Espace (ISAE-SUPAERO), Université de Toulouse, 31055 Toulouse, France
3Institut Clément Ader (CNRS UMR 5312), 31400 Toulouse, France
This work presents an experimental design for studying low-velocity collisions into granular surfaces in low-gravity. In the experiment apparatus, reduced-gravity is simulated by releasing a free-falling projectile into a surface container with a downward acceleration less than that of Earth’s gravity. The acceleration of the surface is controlled through the use of an Atwood machine, or a system of pulleys and counterweights. The starting height of the surface container and the initial separation distance between the projectile and surface are variable and chosen to accommodate collision velocities up to 20 cm/s and effective accelerations of ∼0.1 to 1.0 m/s2. Accelerometers, placed on the surface container and inside the projectile, provide acceleration data, while high-speed cameras capture the collision and act as secondary data sources. The experiment is built into an existing 5.5 m drop tower frame and requires the custom design of all components, including the projectile, surface sample container, release mechanism, and deceleration system. Data from calibration tests verify the e ffi-ciency of the experiment’s deceleration system and provide a quantitative understanding of the
perfor-mance of the Atwood system. [http://dx.doi.org/10.1063/1.4961575]
I. INTRODUCTION
On November 12, 2014, the European Space Agency’s (ESA’s) Rosetta spacecraft became the first mission to success-fully deliver a lander to a comet’s surface. Though the Philae lander eventually came to rest, its anchoring harpoons failed to fire upon descent, and the lander proceeded to rebound twice over a duration of approximately 2 h before reaching its final destination, roughly 1 km away from the intended landing site.1,2These unanticipated events led to significant changes in
the operational schedule in order to perform as many scientific measurements as possible, within the limited lifetime of the lander.
The Rosetta events provide one example of how mission planning can be influenced by lander-surface interactions. Hayabusa-2, a Japanese Space Agency (JAXA) asteroid sample-return mission, will be facing similar challenges to Rosetta in the coming years. The Hayabusa-2 spacecraft will arrive at the C-type near-Earth asteroid (162173) Ryugu in mid-2018 and deploy several science payloads to its surface.3Among these payloads is a 10 kg lander, the Mobile Asteroid Surface Scout (MASCOT), provided by the German Space Agency (Deutsche Forschungsanstalt fur Luft und Raumfahrt (DLR)) with cooperation from the French Centre National d’Etudes Spatiales (CNES). In addition to housing four instruments for in situ science investigation, MASCOT
a)Current address: Jet Propulsion Laboratory, 4800 Oak Grove Drive,
Pasadena, CA 91107, USA.
contains a mobility mechanism that will correct its orientation and enable it to hop to various measurement sites.4
A lander similar to MASCOT is also proposed to be part of the European Space Agency’s (ESA) Asteroid Impact Mission (AIM). AIM is one part of the Asteroid Impact & Deflection Assessment (AIDA) mission together with NASA’s Double Asteroid Redirection Test (DART) mission. AIM and DART complement each other in the validation of the kinetic impact approach to deflect threatening asteroids as well as in the characterization of physical and dynamical properties of the mission target, the Didymos binary asteroid system.5,6
Based on thermal infrared observations7–10and previous
space missions,11–17 it is strongly believed that asteroids are
covered by loose regolith.18The asteroids’ granular surfaces,
in combination with the low surface gravity, make it difficult to predict a lander’s collision behavior from existing theo-retical models. This is partially due to the fact that granular materials have the ability to display either solid, liquid, or gaseous behavior. Anticipating rebound dynamics is particu-larly important for landers, like MASCOT, that do not have attitude control or propulsion systems. While an analysis of the Philae mission may assist in MASCOT’s operation planning, further experimentation is required to construct and validate landing models.
The objective of this work, derived from the needs of current and future small-body missions, is to present an exper-imental design for studying low-velocity collisions into gran-ular surfaces in low gravity. Though this setup is designed specifically around a collision study, this work shows how the experiment concept can be re-configured and used as
a repeatable and inexpensive method for general reduced-gravity testing.
Section II outlines the main considerations behind the design of this experiment while Section III describes the setup itself. Section IVexplains the supporting theory used to construct the experiment setup and Section V details its performance. Lastly, Sections VI and VIIdiscuss how this setup will be used for future experimentation and how it can be reconfigured to accommodate other low gravity tests.
II. BACKGROUND ON REDUCED GRAVITY EXPERIMENTATION
Reduced-gravity experimentation has been a continued challenge for the Space industry. Present-day methods of simulating micro-gravity on Earth include parabolic flights, drop tower neutral buoyancy laboratories, magnetic levitation, rotating wall vessels, and off-loading gantries.
The budget and scheduling constraints associated with parabolic flights, large, air-evacuated drop towers, and neutral buoyancy laboratories can make these facilities impractical for frequent use. Furthermore, the majority of these methods are difficult to implement for more complicated, dynamic exper-iments. In order for neutral buoyancy or magnetic levitation to be effective for granular experiments, each particle must be neutrally buoyant or magnetically levitated. Off-loading weight from only the container or projectile will not suffice because the particles inside of the container will still feel the effects of gravity.
Drop tower facilities and parabolic flights have been extensively used for micro-gravity experiments related to dust and regolith dynamics.19–24Colwell and Taylor and Colwell studied micro-gravity collisions into granular surfaces over the course of two different payload experiments aboard the Space Transportation System (Space Shuttle).25,26 Colwell et al.completed another series of micro-gravity impact tests over three parabolic flights, with the goal of studying low ve-locity collisions of centimeter sized particles.24Goldman and
Umbanhower observe reduced-gravity collisions into granular material by using an Atwood machine to change the effective gravity between a projectile and a surface at their moment of impact.27Altshuler et al. also employ an Atwood machine
setup in order to study settling into dry granular media.28An
Atwood-type machine, using balanced weights linked in a loop, has also been used to simulate the landing of Huygens on Titan and for spacecraft impact tests on small bodies. These experiments had an emphasis on penetrometer tests and had impact velocities of 0.9–3 m/s.29Other groups use drop tower experiments to study impacts between solid and agglomerate bodies.30–32By conducting their experiments aboard the Space Shuttle and NASA C-9 airplane, Colwell and Taylor, Colwell, and Colwell et al. are able to observe impact velocities ranging from 1 to 110 cm/s.24–26 With drop tower setups, Goldman
and Umbanhower and Altshuler et al. observe collisions with higher impact velocities of 40–700 cm/s.27,28Altshuler et al.
employ a setup similar to the one proposed in this work, but he uses polystyrene beads as a surface simulant.28Additional
studies are needed that combine the setup from Altshuler et al. with lower collision velocities and granular materials
that are more representative of the regolith found on small bodies.
The key challenges to designing an asteroid collision experiment are as follows: (1) Finding a way to simulate reduced gravity conditions on Earth, so that the prevailing forces in micro-gravity collisions can be reflected in the exper-imental results, and (2) simulating low-velocity collisions in such a way that data can be collected over a sufficiently long time frame. Based on prior success and the opportunity for a customizable setup, the proposed method to achieve this goal is through the use of an Atwood machine. In this approach, a free-falling projectile impacts a surface with a constant downward acceleration, or an acceleration less than that of gravity, so that the effective surface acceleration felt by the grains is very small. For example, if the projectile is in free-fall and the surface is controlled to have a downward acceleration of 9.0 m/s2, then the surface experiences an effective acceleration of 0.81 m/s2. In reducing the effective surface acceleration of the granular material, the confining pressure and interparticle friction will be reduced21and the medium’s inter-grain cohesion forces will become more important compared to its weight force.33
Con-sequently, the properties of the granular material will become more representative of those on an asteroid’s surface. Since both the surface and projectile are falling in the Atwood machine setup, the projectile requires a minimum amount of time to catch the surface before the collision begins. This extended free-fall period provides a solution to the second experimental design challenge and makes it possible to use accelerometers and high-speed cameras for data collection. This type of test would be impossible to perform on a parabolic flight because directional, very low-levels of gravity are required to create low-velocity collisions with the granular surface. Gravity levels on a Zero-G aircraft tend to fluctuate around zero.
Goldman and Umbanhower and Altshuler et al. conduct reduced-gravity testing using the same method as described above. However, the previous experiments are limited in the range of collision velocities and effective accelerations that their setups can attain. Figure 1 compares the velocity and acceleration regimes that are studied by Goldman and Um-banhower, Altshuler et al., and this work. The experiment in this work is built into an existing drop tower structure, which is managed by the Department of Mechanical Structures and Materials at the Institut Supérieur de l’Aéronautique et de l’Espace (ISAE-SUPAERO) in Toulouse, France. With 5 m of available drop height, 25 cm of possible separation between the projectile and surface, and a 160 kg filled surface container, the ISAE-SUPAERO setup can reach lower gravity levels and higher impact velocities than the setups used by Goldman and Umbanhower and Altshuler et al. The regime limits for the ISAE-SUPAERO drop tower are based on theoretical values and are dependent on the properties of the granular material being tested (see SectionIV).
III. APPARATUS
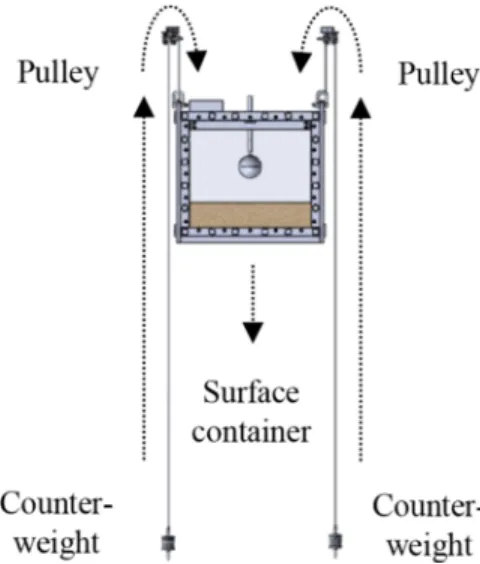
The idea of effective acceleration drives the design of this experiment and results in the following key features. First, the granular surface is provided a constant downward acceleration using an Atwood machine, or a system of pulleys and
coun-FIG. 1. Relative regimes accessible from known Atwood machines. Approx-imate values for the Asthuler et al. setup are based on data extracted from Asthuler et al., Figures 2 and 3.28Approximate values for the Goldman and
Umbanhower setup are based on ranges of collision velocities and gravity levels provided in Goldman and Umbanhower, SectionII.27Theoretical val-ues for the ISAE-SUPAERO setup are calculated as described in SectionIV.
terweights (see Figure2). Next, the projectile and surface are simultaneously released from rest, where the starting height of the surface container and the initial separation distance be-tween the projectile and surface are variable and selected based on the desired collision velocity and effective acceleration. Finally, at the end of the data collection period, the surface container is decelerated at a rate that does not result in damage to either the surface container or projectile.
Figure3shows a technical illustration of the full experi-ment, with reference to its six primary components: The sup-port structure, the counterweight and pulley system, the sur-face container, the projectile, the release mechanism, and the deceleration system.
A. Design of the drop tower base structure
The experiment uses ISAE-SUPAERO’s existing drop tower, shown in Figure4, for structural support. The drop tower
FIG. 2. Isometric line drawing illustrating the basic operation of an Atwood machine.
FIG. 3. Isometric line drawing of the experiment and existing drop tower structure.
is usually designated for aircraft and material drop-tests34but
has been re-purposed to accommodate a counterweight and pulley system. This system makes it possible for materials to fall according to a predefined acceleration and is key to performing reduced gravity, rather than micro-gravity, testing. The tower provides approximately 5.5 × 0.65 × 0.65 m3 of working space and includes an electronically operated mo-tor and pulley system that can be used to raise the container assembly to the desired height. The tower also features two low-friction guide rails that permit test materials to fall and have an impact normal to the structure’s base.
B. Design of the pulley system
Four low-friction pulleys are mounted at the top of the structure’s frame, and light-weight cords connect the surface
FIG. 4. ISAE-Supaero’s existing drop tower structure. The tower features an electronically operated motor and pulley system for raising test materials and two low-friction rails for keeping the test materials vertically aligned.
container to the counterweights. The counterweights are en-closed inside a hollow tube so that their vertical acceleration and stopping motions can be controlled. The counterweight holders alone weigh 400 g each, and mass can be added to each holder at an increment of 100–250 g. The maximum counter-weight mass that the current system can support, including the holder mass, is 8.8 kg (4.4 kg on each side). However, the holders can be replaced in order to accommodate larger masses. Figure3shows the mounted pulley system, counter-weight, and guide tube components of the assembly.
C. Design of the surface container, release mechanism, and projectile
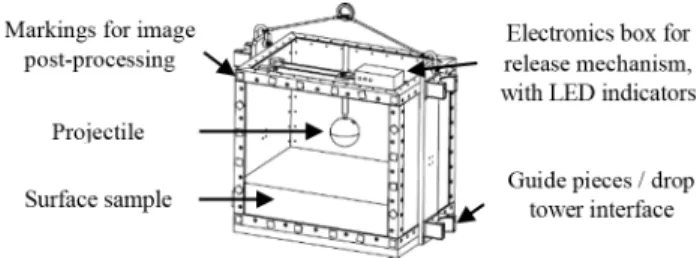
The surface container sub-assembly comprises of three parts: the surface container, the release mechanism, and the projectile. The surface container is sized according to a litera-ture review so that the walls of the container will not influence the rebound dynamics of the collision.27,35If the container is too small, then individual grains may interlock instead of mov-ing in relation to one another as they would if unconstrained. The front and back panels of the surface container are made of 10 mm thick Makrolon polycarbonate material, while the two side panels are made of a light-weight 4 mm thick aluminum alloy. The container is fastened and reinforced at its joints using 2017 aluminum alloy members. With the exception of the opening for the release mechanism, the container is closed on all four sides for safety reasons. A narrow beam traverses the center of the container and acts as a support for the electro-magnetic release mechanism. An electromagnet is mounted at the end of a supported tube, which can be raised and lowered to change the separation distance between the projectile and the surface. The electronics box for controlling the electromagnet is mounted to the top of the container. Square markings of various orientation are placed on the front face of the container for use during the post-processing of the high-speed camera images. Lastly, two guide pieces fasten to the sides of the container and mate with the rails on the drop tower structure. These guide pieces constrain the container’s motion to the vertical direction. Figure5shows an illustration of the surface container and the location of its different features. The total dry mass of the container assembly is 80 kg and it is filled to a height of approximately 17 cm with ∼80 kg of sand. Detailed discussion of the surface material used will be provided in Murdoch et al.36
The release mechanism consists of a permanent electro-magnet and a contact switch. The contact switch is integrated
FIG. 5. Surface container sub-assembly, showing the 10 cm diameter pro-jectile, the electromagnetic release mechanism, and reference markings for image post-processing. The surface container is 62 cm long, 45 cm wide, and 59 cm high.
FIG. 6. Semi-hollow experiment projectile, with two mounted YEI 3-Space Sensors.
into the release hook of the surface container such that the switch opens with the container’s release. Using an onboard battery system and an electronic control card, the electro-magnet is activated after the switch is opened. The activation of the electromagnet cancels the magnetic field of the permanent magnet allowing the projectile to fall. The time between the contact switch opening and the activation of the electromagnet can be adjusted via the onboard electronics to be between ∼40 and 400 ms. For these experiments, the shortest time (40 ms) was used. Testing confirms that the magnetic field generated by the electromagnet does not distort the accelerometers’ measurements. A light-emitting diode (LED) on the surface container’s electronics box indicates when the contact switch is tripped so that the high speed camera images can be synchro-nized with the accelerometer data during post-processing.
The experiment’s projectile, shown in Figure6, is fabri-cated out of 2017 aluminum alloy and is designed to hold two wireless accelerometers (see Section III E). Spherical markings of various radii are placed outside of the sphere and are used for target monitoring during the post-processing of the high-speed camera images.
D. Design of the deceleration system
The surface container is decelerated using two 7 cm thick honeycomb panels. The HexWeb HRH-10 Aramid Fiber panels have a cell size of 4.8 mm and a density of 96 kg/m3. Together, the panels can absorb at least 5 kJ of energy or the equivalent energy of the falling surface container in the most extreme test scenario used in these trials (3 m drop height).
E. Data acquisition
In the experimental setup, two different methods are available for capturing the motion of surface container and projectile. First, 3-Space Sensors, sold by YEI Technology, are mounted to the projectile and surface container. These sensors are data-logging devices that contain an Attitude and Heading Reference System (AHRS), an Inertial Measurement Unit (IMU), and a micro-SD card for on-board data storage. The YEI 3-Space Sensors were specifically selected because of their low mass (28 g), low dynamic range (selectable from ±2 g/±4 g/±8 g with a noise density of 99 µg/√Hz), and high shock resistance (up to 5000 g).37 These features allow the
sensors to record the impact between the projectile and the sand with high precision and to survive to the final shock at the end of the drop. The sensors can also be integrated into the projectile without impacting its desired design features, such as size and weight. In addition to the accelerometers, an Ultima
APX-RS Photron FASTCAM with a Sigma 24-70 mm f/2.8
DG lens is used to capture high-speed images of the projectile collision at 1000 frames per second and a 1024 × 1024 pixel resolution. The camera was placed at a distance of ∼2.7 m from front of the surface container, and a focal length of 24 mm was used for the lens.
IV. THEORY
In order to customize this novel Atwood setup for different experimental trials, several attributes of the system must be calculated. For example, the available ranges of counter-weight masses, separation distances between the projectile and container, and starting heights of the container must be identi-fied. SectionsIV B–IV Dprovide a theoretical understanding of the system and the scientific trials that are consequentially available given the setup’s physical constraints.
A. Sizing of the Atwood machine counterweights
The “reduced-gravity” element of the experiment is intro-duced through the use of a counterweight and pulley system, which allows the surface container to have a constant down-ward acceleration less than that of gravity. If pulley friction and chord elasticity are neglected, then the controlled acceleration is simply a function of mass. The expression for the surface container’s acceleration asis derived by balancing the forces on the container (subscript, s) and counterweights (subscript, cw) and is given by Equation(1), where msis the mass of the surface container and mc wis the total combined mass of all counterweights, as= g ( ms− mc w ms+ mc w ) . (1)
B. Calculating the required starting height for experimental trials
It is necessary to calculate the starting drop height of each experimental trial so that a prediction can be made as to where the collision takes place along the height of the drop tower. Having this information serves two purposes. First, it helps bound what effective accelerations and collision velocities can be achieved within the physical limits of the drop tower, and second, it provides an estimate for where the high-speed cameras should be positioned in order to record the collision and rebound phases of the test.
The total drop height can be described by four phases experienced by the projectile: a free-fall phase, a collision phase, a rebound phase, and a deceleration phase. The freefall phase of the experiment begins when the surface (subscript, s) and projectile (subscript, p) are released from rest and ends when the two objects make contact for the first time. The collision phase begins at the end of the free-fall phase and ends
when the projectile returns to the same position relative to the surface, after experiencing some level of surface deformation. Even though the projectile may never return to its starting position, such as in the case of a purely inelastic collision, the definition of this phase assumes it does in order to size for the most extreme height case. The rebound phase begins at the end of the collision phase and ends shortly before the projectile impacts the surface for a second time. The duration of the rebound phase depends on the collision’s coefficient of restitution (COR) or ratio of energy lost during the collision. For the purposes of this calculation, a value for the collision’s COR is estimated from a literature review (see SectionIV C), and the rebound phase is considered to begin at the end of the collision phase and end when the projectile has reached a maximum theoretical separation from the surface. Using this alternative definition for the rebound phase decreases the total height of the experiment while still providing an adequate window of time to observe the projectile’s rebound behavior. Finally, the deceleration phase begins at the end of the rebound phase and ends as soon as the surface container is brought to a complete stop.
The theoretical distance traveled and time elapsed during each phase can be derived from kinematic equations and en-ergy conservation. The total height (Htotal) required for each trial is then equal to the sum of the heights for the free-fall, collision, rebound, and deceleration phases (hsd, hsc, hsr, and hsdec, respectively),
Htotal= hsd+ hsc+ hsr+ hsdec. (2) The total height as a function of velocity and time is given by Equation(3), where Vc is the collision velocity, asis the acceleration of the surface, g is the acceleration of gravity, Vsc0is the velocity of the surface container at the beginning of the collision phase, tcis the estimated collision time, Vsc F is the velocity of the surface container at the end of the collision phase, and tris the estimated rebound time,
Htotal= V2 c 2 ( as g2− 2a sg + a2s ) + Vsc0tc +1 2ast 2 c+ Vsc Ftr+ 1 2ast 2 r+ hsdec. (3) C. Estimated parameters
Two unknown parameters are required to calculate the to-tal drop height for each experimento-tal trial: the time that elapses during the collision phase (tc) and the collision’s coefficient of restitution (COR) that will determine the rebound time (tr).
Different collision models can be used to predict the colli-sion time, but only when certain properties of the medium are known. For example, if the equivalent stiffness k∗and damping c∗of the sand and projectile under low-gravity conditions were known, then the collision time tccould be estimated using the spring-dashpot collision model shown in Equation(4), where ωdis the damped natural frequency and miis the mass of the impactor,38 tc= π ωd = 2πmi 4k∗m i− c∗2 . (4)
When the Young’s modulus E of the surface material is known, tc can be estimated using Hertz collision theory for the elastic collision of two spheres,
tc= 2.87 ( m∗2 RE∗2V c )15 , (5)
where E∗is the equivalent Young’s modulus of the impactor and surface materials, m∗is the equivalent mass of the two spheres, and R is the reduced radius of the two spheres,39
1 E∗ = 1 − ν12 E1 +1 − ν22 E2 , (6) 1 R = 1 R1 + 1 R2 , (7) 1 m∗= 1 m1+ 1 m2 . (8)
While the Hertz collision model does not accurately repre-sent collisions into granular materials, it can still be used to obtain a lower bound estimate on collision time. For example, using the Hertz collision model, Krijt et al. predict a colli-sion time of 1.4 × 10⁻⁸s for an 8 m/s head-on collision be-tween icy spheres.39 This is the lower-bound collision-time estimate because the Hertzian model considers solid-to-solid body collisions, as opposed to much more inelastic solid-to-granular surface collisions.27,39
Collision times observed in previous granular impact experiments range from 0.04 s to 0.5 s.27,28,40Altshuler et al.
observe the longest collision times of 0.2–0.5 s while studying the sink dynamics of a 23 g sphere into polystyrene beads.28
Goldman and Umbanhower find a collision time of 0.1 s for a 10 g disk impacting glass beads at 60 cm/s, a collision time of 0.08 s for a steel sphere with a 1.91 cm radius impacting glass beads at 2.86 m/s, and a collision time of 0.07 s for a 147 g nylon sphere impacting glass beads at 47 cm/s.27Goldman and
Umbanhower conclude that the collision time for a steel sphere colliding with glass beads is independent on impact velocity for sufficiently high impact velocities but that a regime change occurs for low collision velocities (/1.5 m/s), where collision time actually increases with decreasing impact velocity.27 A study by Ambroso et al. finds a collision time of approximately 0.04 s for a 5 cm diameter wooden sphere impacting glass beads at 226 cm/s.40
Since the properties of sand under low gravity conditions are unknown and the collisions are likely to be inelastic, it is difficult to predict the collision time using the Spring-dashpot and Hertz collision models. In order to size the experiment structure, an estimate of 0.1 s is used for the collision time. This estimate is based on the study by Goldman and Umbanhower. Though results from Altshuler et al. show longer collision times, Goldman and Umbanhower use a more comparable experimental setup and provide an estimate that still allows for a conservative collision-height calculation.
The second unknown parameter in the height equation is the collision’s coefficient of restitution. Space Shuttle payload experiments by Colwell and Taylor and Colwell show that the COR for impacts at less than 12 cm/s are either unobserv-able or as low as 0.02.25,26 At the other extreme, analysis of
the Hayabusa-1 touchdown data on asteroid Itokawa suggests
that the COR is as large as 0.84,16 although there are many uncertainties associated with this measurement. To make an approximation on the height calculation, an average value for the COR is estimated based on lower and upper bound observations from previous impact experiments. The average value is used instead of the highest value because the beginning of the rebound phase can still be observed even if the COR is underestimated.
The lower estimate is taken as 0.02 based on Colwell, and the upper estimate on COR is taken from studies observing low-velocity collisions between centimeter-sized dust aggre-gates in drop tower configurations. Beitz et al. find an average COR of 0.35 ± 0.12 for collision velocities of 0.8–37 cm/s between agglomerates made of SiO2 micrometer-sized dust particles.30In another drop tower experiment that extends the work of Beitz et al., Schräpler et al. develop an expression for COR as a function of impact velocity for collision veloc-ities in the range of 1-10 cm/s.31 This expression, shown in Equation(9), acts as the upper-bound for the COR estimate,
CO Rma x= 0.11Vc−0.51(m/s)
0.51. (9)
Based on the studies of Colwell, Bietz et al., and Schräpler et al., the COR of the collision is estimated using Equation(10)
for collision velocities >1 cm/s. This estimate is not the ex-pected COR of the collision but simply a reasonable guess that will allow for the sizing of the experiment,
CORmean=
0.02+ 0.11Vc−0.51
2 (m/s)
0.51.
(10)
D. Tower capabilities and constraints
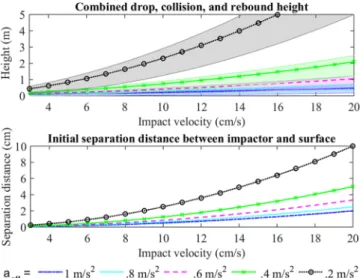
Figure7shows how the separation distance between the projectile and surface material and how the required exper-imental height, from the initial release to the beginning of
FIG. 7. Top: experimental height for different effective surface accelerations and collision velocities. Shading indicates the range of possible height values caused by estimating the coefficient of restitution and collision time. The required experiment height increases as the desired effective acceleration decreases. Bottom: initial separation distance between the projectile and surface material for different effective surface accelerations and collision velocities. The initial separation distance decreases as the desired effective acceleration increases.
the deceleration phase, evolves for different effective surface accelerations and collision velocities. The curves on the plot are constructed using Equation(3), and the shading indicates the range of possible height values caused by estimating the coefficient of restitution and collision time in the calculations, as discussed in SectionIV C. The plot shows that for a given impact velocity, the required height increases as the effective acceleration decreases. Also, for a given impact velocity, initial separation distance decreases as the effective acceleration in-creases. As a consequence, the lowest effective acceleration that can be observed, for a given collision velocity in the experiment, is constrained by the drop tower’s physical height, and the highest effective acceleration that can be observed is limited to a separation distance that is physically reasonable to set up and measure.
V. RESULTS
The performance of the experimental setup is analyzed based on a number of qualitative and quantitative factors, such as projectile and surface material visibility, surface container deceleration, system friction, and release synchronization. The descent of the surface container is of particular interest because the guide rail, pulley, and counterweight guide tube features of the experiment cause the desired acceleration of the surface container to deviate from its theoretical value.
A. Experiment performance and repeatability
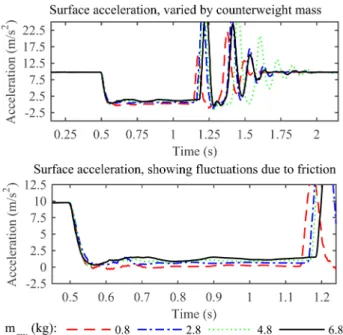
The difference between the surface container’s actual and predicted acceleration is analyzed using accelerometer data from drop tests with varied counterweight masses. The top plot in Figure8shows the container’s vertical acceleration profile for a sand-filled container dropped from a height of 2.20 m
FIG. 8. Top: acceleration profile for a 160 kg, sand-filled container dropped from a height of 2.20 m. The effective acceleration of the surface material increases as counterweight mass increases. Bottom: zoomed-in view of the surface container’s vertical acceleration over the free-fall period. Due to friction, the container’s acceleration fluctuates along the length of the rails, though more so at the top of the rails than the bottom.
TABLE I. Comparison of theoretical acceleration (at h) and experimental accelerations (ae x) for a 160 kg, sand-filled surface container dropped from a height of 2.0 m. The container’s experimental acceleration is determined by averaging the raw accelerometer data over the container’s free-fall period, excluding fluctuations from the container’s initial release. The experimental free-fall duration (te x) is estimated by taking the elapsed time between the peaks in the accelerometer data that indicate the initial release and then impact with the honeycomb panels.
mcw (kg) te x (s) at h (m/s2) ae x (m/st2) % diff in a 0.8 0.645 9.71 9.62 0.93 2.8 0.667 9.47 9.16 3.38 4.8 0.674 9.24 8.87 4.02 6.8 0.684 9.01 8.63 4.31
and resisted by counterweight masses of 0.8, 2.8, 4.8, and 6.8 kg. The data were smoothed using a low pass filter with a cutoff frequency of 10 Hz. As expected, the surface material’s effective acceleration decreases with increasing counterweight mass. Based on Equation(1), a 160 kg surface container should have accelerations of 9.71, 9.47, 9.24, and 9.01 m/s2for coun-terweight masses of 0.8, 2.8, 4.8, and 6.8 kg, respectively. The container’s acceleration during the experimental trials is determined by averaging the raw accelerometer data during the container’s free-fall period, excluding fluctuations from the container’s initial release. TableIlists the theoretical and experimental accelerations of the surface container for the different trials depicted in Figure8. The percent difference be-tween the actual and predicted accelerations range from 0.93% to 4.31%, increasing with increasing counterweight mass.
Also as expected, the container’s free-fall duration in-creases as more counterweights are added to the system. The duration of the free-fall phase can be estimated from the exper-imental trials by taking the elapsed time between the peaks in the accelerometer data that indicate the container’s initial release and then its impact with the honeycomb panels. TableI
lists the container’s estimated free-fall duration for the 2.0 m drop tests.
The accelerometer data from these trials are also used to make observations about the combined friction in the guide rails, pulleys, and counterweight guide tubes. The bottom
plot in Figure 8 shows a zoomed-in view of the surface
container’s Y-axis acceleration over the free-fall period. After the container is released, its acceleration fluctuates along the length of the rails, though more so at the top of the rails than the bottom. In addition to friction and cord elasticity, these fluctuations may be caused by deformation in the rails or back-and-forth tilting of the surface container as it falls.
The surface container’s deceleration profile is used to quantify the container’s shock upon impact with the honey-comb and to verify that the container is brought to a controlled stop. Four drop tests were performed at a height of 3 m to verify the functionality of the deceleration system. For these tests, a KISTLER type 8704B500 accelerometer with a range of ±500 g and sensitivity of 10.4 mV/g was fixed on the surface container in order to record the container’s deceleration profile. As seen in Figure9, the surface container experiences a shock of about 80 g at impact. The honeycomb panels successfully prevent the container from becoming damaged after the fall.
FIG. 9. Deceleration profile of the surface container at the end of a 3 m drop, with normalized acceleration on the y-axis and time on the x-axis. The surface container experiences a shock of about 80 g upon impacting two 10 cm thick honeycomb panels.
Accelerometers installed inside of the surface container and projectile are used to analyze the consistency of the elec-tromagnetic release mechanism. Like friction, the conditions of the projectile’s release influence the calibration of the container’s starting height. If the release of the projectile is not synchronized with the release of the container, then the delay needs to be accounted for so that the projectile’s collision with the surface will take place within the camera’s fixed viewing window. Though the release of the surface container and projectile is not perfectly synchronous, initial testing reveals that no additional calibration is required to compensate for the difference.
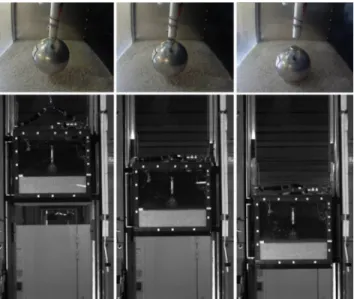
During several of the performance tests, the surface container was partially filled with sand, and high speed cameras were used to capture the container’s descent. The images are used to verify that the sand does not lift and obstruct the view of the projectile during the fall. Figure10shows a sequence of images for a 2.0 m drop test. For this test, the initial separation distance between the projectile and surface material is ∼3.0 cm. The projectile is clearly visible within the
FIG. 10. Images sequence depicting the initial release, free-fall, and collision phases for a 2.0 m drop test. The initial separation distance between the projectile and surface material is ∼3.0 cm. The top row of images is from an AEE MagiCam SD100 camera that was mounted inside of the surface container, and the bottom row of images is still frames from the Ultima APX-RS Photron high-speed camera.
camera frame throughout the release, free-fall, and collision phases of the trial.
These trials are also used to study the packing of the surface material upon impact with the honeycomb. If the sand level changes between the start and finish of the experiment, then a method to re-prepare the sand is required so that the bulk density of the surface material remains consistent be-tween trials. In the calibration tests, it was observed that the sand was no longer level at the end of the deceleration phase. Once the sand was brushed, however, its level measurement was unchanged from its value at the beginning of the trial. One hypothesis is that the sand compresses during its initial shock but becomes disturbed and uncompressed during the oscillations that proceed the shock. The deceleration system naturally regulates the bulk density of the surface material, indicating that no extra treatment of the surface sample is likely to be required between trials.
VI. DISCUSSION
Preliminary verification tests indicate that the experiment setup accomplishes its primary purpose: to provide a surface container with a controllable downward acceleration so that a free-falling projectile may impact a surface in a reduced-gravity state. Figure11shows the acceleration profiles of the projectile and surface container for a scientific trial with a starting drop height of 2.20 m, an initial separation distance be-tween the projectile and surface of 3 cm, and a counterweight mass of 4.8 kg. The data were smoothed using a low pass filter in MATLAB, with a cutoff frequency of 10 Hz. In this trial, the surface has an effective acceleration of approximately 0.82 m/s2. The surface container and projectile are released from rest around the 0.40 second mark. Then, the projectile and surface container are in free-fall until the projectile collides with the surface at 0.75 s. The collision phase lasts for approx-imately 0.19 s, or nearly twice as long as the duration used in theoretical calculations, and does not result in a detectable rebound. After an estimated 0.67 s of free-fall, the surface
FIG. 11. Acceleration profile of the projectile and surface container for a scientific trial with a starting drop height of 2.20 m, an initial separation distance between the projectile and surface of 3.0 cm, and a counterweight mass of 4.8 kg. The surface has an effective acceleration of approximately 0.82 m/s2. The collision phase lasts for approximately 0.19 s and does not result in a detectable rebound.
container collides with the honeycomb panels and begins to decelerate. A complete analysis of the collision dynamics from this trial, as well as other trials with varying parameters, will be part of a future study.
The combined realities of friction and air drag cause the container’s downward acceleration to deviate from its theoret-ical value. There is also a significant shock that can be observed on the surface sensor (at ∼0.5 s in Figure11) shortly after the release when the chain, visible in Figure5, falls onto the box. This is, however, not problematic as long as the chain impact occurs well before the projectile collides with the sand. In the experiment’s current state, friction is difficult to correct for because it varies significantly with time. However, to reduce the impacts of friction on the container’s acceleration profile, a lubricate can be added and re-applied to the guide rails be-tween trials. The experimental trials can also be configured so that the drop height is skewed towards the bottom of the tower, where the container’s acceleration profile tends to fluctuate the least.
Without adding additional counterweight mass to the sys-tem, the surface container is naturally slowed to a downward acceleration of approximately 0.1 m/s2, marking the lowest possible effective acceleration that the setup can achieve. This acceleration is within the scope of planned trials and is less than that of asteroids (1) Ceres and (4) Vesta, with surface grav-ities of 0.29 m/s2and 0.25 m/s2, respectively.41,42The largest
effective acceleration that has currently been tested (1 m/s2) is comparable to the surface gravity of Saturn’s moon Enceladus. Accelerations lower than 0.1 m/s2can be achieved by re-designing the setup for a free-falling container. This would eliminate the constraints that rail friction imposes on the system. In addition, the unique experimental data obtained in these trials may also be valuable to benchmark different numerical simulation approaches (distinct element method, finite element method, etc.). These simulations can then subse-quently be used to extrapolate the results to even lower gravity regimes.
Measurements of the surface material’s level before and after each trial indicate that the system inherently disturbs the material during the deceleration process, effectively holding the bulk density of the surface material constant between trials. If as few as 2 trials are performed on a given day, then no addi-tional actions are required to prepare the sand between each trial. However, the level of the sand should still be monitored between trials so that it can be treated in the case that packing is observed.
In addition to providing quantitative insight into the setup’s performance, calibration trials help configure the setup’s data acquisition tools and ground support equipment. These activities include optimization of camera placement, camera lighting, and camera and accelerometer settings.
VII. CONCLUSIONS
The presented design has been used to study low-velocity collisions into granular surfaces. The first round of testing used a 10 cm metallic sphere as a projectile and sand as a surface simulant. The collision velocities and effective accelerations
that can be attained in this setup are constrained by the size and physical limitations of the drop tower structure. The sys-tem can currently support effective accelerations of ∼0.1 to 1 m/s2, though higher values can be reached by simply adding more counterweight mass to the pulley sub-system. Other test parameters are easily adjustable and open-up possibilities for future experimentation. For example, the release mechanism can support changes to the size, mass, and shape of the projec-tile, while the container can hold a range of surface simulant depths and materials.
Since the surface materials in this setup are subject to the effects of gravity at all times, this setup does not have the same concern for particulate lift as parabolic flight experiments. Therefore, there are no limitations from the perspective of the initial release as to the size or material of granular matter that can be used. However, it should be noted that air resistance may be a limiting factor in grain-size selection. The interstitial air effect is negligible for grains with diameters >0.1 mm.43,44 This is demonstrated specifically for low-speed impacts into a granular material by Katsuragi and Durian.45 The only constraint to the type of solid material that can be used in the current setup is that it must survive the shock of deceleration. Outside of collision experiments, this setup can be used to test the general strength and structural properties of granular materials in reduced-gravity environments. For instance, the surface container can be redesigned to incorporate penetrom-eters and shear tools. The container can also be redesigned to accept entire mobility or sampling mechanisms in order to validate the mechanism’s at-rest and in-motion surface inter-actions. For these tests, the particle size and effective accel-eration of the surface material can be altered to mimic the properties of asteroids and comets. The limiting factor in using this setup for other experiments is the short duration of the drop time. If the surface container free-falls (i.e., no coun-terweights) from the maximum possible drop height of 5 m, only 1 s elapses before the container impacts the deceleration material.
The drop tower structure, the counterweight and pulley system, and the deceleration system are stand-alone compo-nents of the experiment in the sense that they do not require any redesign or re-calibration in order to be used for other tests. This aspect of the experiment makes it ideal for frequent, inexpensive, and repeatable experimentation.
ACKNOWLEDGMENTS
This project benefited from some financial support from the Centre National d’Etudes Spatiales (CNES) and was a collaborative effort between several departments at ISAE-SUPAERO. Alexandre Cadu and Anthony Sournac, both from the Département Electronique, Optronique et Signal (DEOS) and Systèmes Spatiaux (SSPA), provided extremely valuable help and advice concerning the installation of the electromagnetic release system. Emmanuel Zenou, from the Département d’Ingénierie des Systèmes Complexes (DISC), helped prepare the experiment in such a way to facilitate the image analyses during the data processing. Daniel Gagneux and Thierry Faure, from the Département Mécanique des Structures et Matériaux (DMSM), completed the experiment’s
detailed design and fabrication. Lastly, we thank Jens Biele for his helpful comments on this manuscript.
1J. Biele, S. Ulamec, M. Maibaum, R. Roll, L. Witte, E. Jurado, P. Muñoz, W. Arnold, H.-U. Auster, C. Casas et al.,Science349, aaa9816 (2015). 2S. Ulamec, C. Fantinati, M. Maibaum, K. Geurts, J. Biele, S. Jansen, O.
Küchemann, B. Cozzoni, F. Finke, V. Lommatsch, A. Moussi-Soffys, C. Delmas, and L. O’Rourke,Acta Astronaut.125, 80 (2016).
3Y. Tsuda, M. Yoshikawa, M. Abe, H. Minamino, and S. Nakazawa,Acta
Astronaut.90, 356 (2013).
4T. Ho, R. Findlay, C. Ziach, C. Krause, M. Lange, J. Reill, M. Deleuze, S. Ulamec, J. Biele, R. Jaumann et al., in Lunar and Planetary Institute Science Conference Abstracts (Lunar and Planetary Institute, 2014), Vol. 45. 5Patrick Michel, A. Cheng, M. Küppers, P. Pravec, J. Blum, M. Delbo, S.
F. Green, P. Rosenblatt, K. Tsiganis, J. B. Vincent, J. Biele, V. Ciarletti, A. Hérique, S. Ulamec, I. Carnelli, A. Galvez, L. Benner, S. P. Naidu, O. S. Barnouin, D. C. Richardson, A. Rivkin, P. Scheirich, N. Moskovitz, A. Thirouin, S. R. Schwartz, A. Campo Bagatin, and Y. Yu, “Science case for the Asteroid Impact Mission (AIM): A component of the Asteroid Impact & Deflection Assessment (AIDA) mission,”Advances in Space Research
57(12), 2529–2547 (2016).
6A. F. Cheng, J. Atchison, B. Kantsiper, A. S. Rivkin, A. Stickle, C. Reed, A. Galvez, I. Carnelli, P. Michel, and S. Ulamec,Acta Astronaut.115, 262 (2015).
7A. W. Harris,Proc. Int. Astron. Union1, 449 (2005).
8H. Campins, J. P. Emery, M. Kelley, Y. Fernández, J. Licandro, M. Delbó, A. Barucci, and E. Dotto,Astron. Astrophys.503, L17 (2009).
9B. Gundlach and J. Blum,Icarus223, 479 (2013).
10N. A. Moskovitz, S. Abe, K.-S. Pan, D. J. Osip, D. Pefkou, M. D. Melita, M. Elias, K. Kitazato, S. J. Bus, F. E. DeMeo et al.,Icarus224, 24 (2013). 11R. Sullivan, R. Greeley, R. Pappalardo, E. Asphaug, J. M. Moore, D. Morri-son, M. J. S. Belton, M. Carr, C. R. Chapman, P. Geissler et al.,Icarus120, 119 (1996).
12M. H. Carr, R. L. Kirk, A. McEwen, J. Veverka, P. Thomas, J. W. Head, and S. Murchie,Icarus107, 61 (1994).
13P. C. Thomas, J. Veverka, J. F. Bell, B. E. Clark, B. Carcich, J. Joseph, M. Robinson, L. A. McFadden, M. C. Malin, C. R. Chapman et al.,Icarus140, 17 (1999).
14M. S. Robinson, P. C. Thomas, J. Veverka, S. L. Murchie, and B. B. Wilcox,
Meteorit. Planet. Sci.37, 1651 (2002).
15J. Veverka, M. Robinson, P. Thomas, S. Murchie, J. F. Bell, N. Izenberg, C. Chapman, A. Harch, M. Bell, B. Carcich et al.,Science289, 2088 (2000). 16H. Yano, T. Kubota, H. Miyamoto, T. Okada, D. Scheeres, Y. Takagi, K.
Yoshida, M. Abe, S. Abe, O. Barnouin-Jha et al.,Science312, 1350 (2006). 17R. Jaumann, D. A. Williams, D. L. Buczkowski, R. A. Yingst, F. Preusker, H. Hiesinger, N. Schmedemann, T. Kneissl, J. B. Vincent, D. T. Blewett et al.,
Science336, 687 (2012).
18N. Murdoch, P. Sanchez, S. R. Schwartz, and H. Miyamoto, “Asteroid surface geophysics,” in Asteroids IV, Space Science Series, University of Arizona Press, 2015.
19P. G. Hofmeister, J. Blum, and D. Heißelmann,AIP Conf. Proc.1145, 71 (2009).
20N. Murdoch, B. Rozitis, S. F. Green, T. de Lophem, P. Michel, and W. Losert,
Granular Matter15, 129 (2013).
21N. Murdoch, B. Rozitis, K. Nordstrom, S. F. Green, P. Michel, T. de Lophem, and W. Losert,Phys. Rev. Lett.110, 018307 (2013).
22C. Güttler, I. von Borstel, R. Schräpler, and J. Blum,Phys. Rev. E87, 044201 (2013).
23A. Dove and J. E. Colwell, AGU Fall Meeting Abstracts (American Geo-physical Union, 2013), Vol. 1, p. 01.
24J. Colwell, J. Brisset, A. Dove, A. Whizin, H. Nagler, and N. Brown, European Planetary Science Congress, 2015.
25J. E. Colwell and M. Taylor,Icarus138, 241 (1999). 26J. E. Colwell,Icarus164, 188 (2003).
27D. I. Goldman and P. Umbanhowar,Phys. Rev. E77, 021308 (2008). 28E. Altshuler, H. Torres, A. González-Pita, G. Sánchez-Colina, C.
Pérez-Penichet, S. Waitukaitis, and R. C. Hidalgo,Geophys. Res. Lett.41(9), 3032–3037, doi:10.1002/2014GL059229 (2014).
29M. Paton, S. Green, A. Ball, J. Zarnecki, and A.-M. Harri,Adv. Space Res. 56, 1242 (2015).
30E. Beitz, C. Güttler, J. Blum, T. Meisner, J. Teiser, and G. Wurm,Astrophys.
J.736, 34 (2011).
31R. Schräpler, J. Blum, A. Seizinger, and W. Kley,Astrophys. J.758, 35 (2012).
32D. Heißelmann, J. Blum, H. J. Fraser, and K. Wolling,Icarus206, 424 (2010).
33D. J. Scheeres, C. M. Hartzell, P. Sánchez, and M. Swift,Icarus210, 968 (2010).
34H. A. Israr, S. Rivallant, C. Bouvet, and J.-J. Barrau,Composites, Part A62, 16 (2014).
35W. K. Hartmann,Icarus33, 50 (1978).
36N. Murdoch, I. Avila Martinez, E. Zenou, C. Sunday, O. Cherrier, A. Cadu, and Y. Gourinat, “An experimental study of low velocity impacts into granular material in reduced gravity” (unpublished).
37YEI Technology, YEI 3-Space Sensor Data-logging Technical Brief, 2014. 38M. Nagurka and S. Huang, in Proceedings of the 2004 American Control
Conference(IEEE, 2004), Vol. 1, pp. 499–504.
39S. Krijt, C. Güttler, D. Heißelmann, C. Dominik, and A. G. G. M. Tielens,
J. Phys. D: Appl. Phys.46, 435303 (2013).
40M. A. Ambroso, R. D. Kamien, and D. J. Durian,Phys. Rev. E72, 041305 (2005).
41C. T. Russell, C. A. Raymond, A. Coradini, H. Y. McSween, M. T. Zuber, A. Nathues, M. C. De Sanctis, R. Jaumann, A. S. Konopliv, F. Preusker et al.,
Science336, 684 (2012).
42B. Carry, C. Dumas, M. Fulchignoni, W. J. Merline, J. Berthier, D. Hestrof-fer, T. Fusco, and P. Tamblyn,Astron. Astrophys.478, 235 (2008). 43H. Katsuragi et al., Physics of Soft Impact and Cratering (Springer,
2016).
44H. K. Pak, E. Van Doorn, and R. P. Behringer,Phys. Rev. Lett.74, 4643 (1995).