HAL Id: insu-02269675
https://hal-insu.archives-ouvertes.fr/insu-02269675
Submitted on 23 Aug 2019
HAL is a multi-disciplinary open access
archive for the deposit and dissemination of
sci-entific research documents, whether they are
pub-lished or not. The documents may come from
teaching and research institutions in France or
abroad, or from public or private research centers.
L’archive ouverte pluridisciplinaire HAL, est
destinée au dépôt et à la diffusion de documents
scientifiques de niveau recherche, publiés ou non,
émanant des établissements d’enseignement et de
recherche français ou étrangers, des laboratoires
publics ou privés.
Distributed under a Creative Commons Attribution| 4.0 International License
Underestimation of the Tambora effects in North
American taiga ecosystems
Fabio Gennaretti, Etienne Boucher, Antoine Nicault, Guillermo
Gea-Izquierdo, Dominique Arseneault, Frank Berninger, Martine Savard,
Christian Begin, Joel Guiot
To cite this version:
Fabio Gennaretti, Etienne Boucher, Antoine Nicault, Guillermo Gea-Izquierdo, Dominique Arseneault,
et al.. Underestimation of the Tambora effects in North American taiga ecosystems.
Environmen-tal Research Letters, IOP Publishing, 2018, 13 (3), pp.034017. �10.1088/1748-9326/aaac0c�.
�insu-02269675�
LETTER • OPEN ACCESS
Underestimation of the Tambora effects in North
American taiga ecosystems
To cite this article: Fabio Gennaretti et al 2018 Environ. Res. Lett. 13 034017
View the article online for updates and enhancements.
Related content
Diverse growth trends and climate responses across Eurasia’s boreal forest Lena Hellmann, Leonid Agafonov, Fredrik Charpentier Ljungqvist et al.
-A new archive of large volcanic events over the past millennium derived from reconstructed summer temperatures L Schneider, J E Smerdon, F Pretis et al.
-European summer temperatures since Roman times
J Luterbacher, J P Werner, J E Smerdon et al.
Environ. Res. Lett. 13 (2018) 034017 https://doi.org/10.1088/1748-9326/aaac0c
LETTER
Underestimation of the Tambora effects in North
American taiga ecosystems
Fabio Gennaretti1,2,9 , Etienne Boucher3, Antoine Nicault4, Guillermo Gea-Izquierdo5, Dominique Arseneault6, Frank Berninger7, Martine M Savard8, Christian B´egin8and Joel Guiot1
1 Aix Marseille University, CNRS, IRD, Coll France, CEREGE, Aix-en-Provence, 13545, France 2 Université de Lorraine, AgroParisTech, INRA, UMR1434 Silva, Nancy, 54000, France
3 D´epartement de G´eographie and GEOTOP, Universit´e du Qu´ebec `a Montr´eal, Montr´eal, H3C3P8, Canada 4 Aix Marseille University, CNRS, ECCOREV, Aix-en-Provence, 13545, France
5 Departamento de Sistemas y Recursos Forestales, INIA-CIFOR, Madrid, 28040, Spain
6 D´epartement de Biologie, Chimie et G´eographie, Universit´e du Qu´ebec `a Rimouski, Rimouski, G5L3A1, Canada 7 Department of Forest Sciences, University of Helsinki, Helsinki, 00014, Finland
8 Geological Survey of Canada, Natural Resources Canada, G1K9A9, Qu´ebec, Canada 9 Author to whom any correspondence should be addressed.
OPEN ACCESS
RECEIVED
12 October 2017
REVISED
3 January 2018
ACCEPTED FOR PUBLICATION
31 January 2018
PUBLISHED
23 February 2018
Original content from this work may be used under the terms of the
Creative Commons Attribution 3.0 licence. Any further distribution of this work must maintain attribution to the author(s) and the title of the work, journal citation and DOI.
E-mail:[email protected]
Keywords: tambora legacy, Eastern Canada, regional climate responses, terrestrial biosphere responses, forest demography, mechanistic
understanding, process-based modeling
Supplementary material for this article is availableonline
Abstract
The Tambora eruption (1815 AD) was one of the major eruptions of the last two millennia and has no
equivalents over the last two centuries. Here, we collected an extensive network of early
meteorological time series, climate simulation data and numerous, well-replicated proxy records from
Eastern Canada to analyze the strength and the persistence of the Tambora impact on the regional
climate and forest processes. Our results show that the Tambora impacts on the terrestrial biosphere
were stronger than previously thought, and not only affected tree growth and carbon uptake for a
longer period than registered in the regional climate, but also determined forest demography and
structure. Increased tree mortality, four times higher than the background level, indicates that the
Tambora climatic impact propagated to influence the structure of the North American taiga for
several decades. We also show that the Tambora signal is more persistent in observed data
(temperature, river ice dynamics, forest growth, tree mortality) than in simulated ones (climate and
forest-growth simulations), indicating that our understanding of the mechanisms amplifying volcanic
perturbations on climates and ecosystems is still limited, notably in the North American taiga.
Introduction
On 10 April 1815, the Tambora volcano, located in the Sumbawa island in Indonesia, entered into the culmi-nating phase of a large Plinian eruption which had huge local and global impacts on climate, the environment and human societies (Harington1992, Oppenheimer
2003, Raible et al2016). Massive injection of at least 60 teragrams (Tg) of SO2 into the atmosphere pro-duced stratospheric sulfate aerosols which decayed in concentration over three years and shielded the earth from incoming solar radiation (Self et al2004). Con-sequently, global land temperatures dropped by about 1◦C in 1816, which is known as the ‘year without a
summer’, and remained low for 6–10 years according to simulation studies (Raible et al 2016). This cli-matic perturbation occurred during a period of reduced solar irradiance (Dalton minimum) which was also impacted by other strong volcanic eruptions (Wag-ner and Zorita2005), thus culminating in one of the coldest episodes of the ‘Little Ice Age’.
Although the Tambora eruption is quite recent in historical terms, its impacts are much better con-strained in Europe than elsewhere because of the denser network of historical sources, proxy records and early meteorological stations (Brugnara et al 2015). Furthermore, many discrepancies exist on the inten-sity and duration of the Tambora climatic impact as
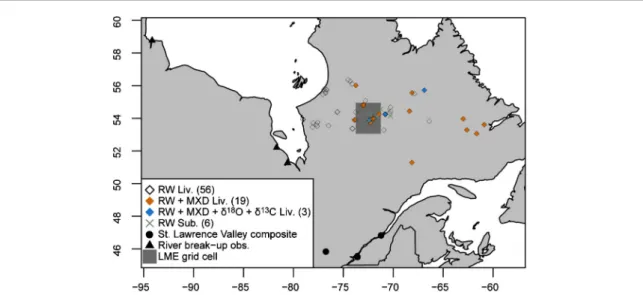
Figure 1. Data location. The number of sites with specific tree-ring proxy records is within brackets. RW Liv. is ring width chronologies
from living trees, RW Sub. is ring width chronologies from subfossil trees, MXD is ring maximum density chronologies, LME is Last Millennium Ensemble.
detected by different observed (e.g. weather obser-vations, tree-ring proxies) and simulated records (B¨untgen et al 2015). These discrepancies remain largely unexplained because of the poor mechanis-tic understanding of the responses of the climate and the biosphere at the regional level. For example, the Tambora impact on the carbon cycle is poorly under-stood. The atmospheric CO2concentration was slightly reduced for 15 years after the Tambora erupted (Mac-Farling Meure et al2006), likely because the carbon uptake over land increased. This was driven by the lower temperatures, which could have reduced ecosys-tem respiration in northern latitudes and increased net primary production in the tropics (Tjiputra and Otter˚a2011, Kandlbauer et al2013). However, there is no consensus on the terrestrial biosphere responses and associated mechanisms at regional level (Raible
et al 2016). For example, we do not know how
northern forest ecosystems reacted to the Tambora abrupt perturbation in terms of wood biomass assim-ilation and forest demography (i.e. tree mortality and recruitment), which are significant components of the regional carbon budget.
This paper focuses on the Tambora impacts in East-ern Canada (figure1) where many individual records and sources show that the volcanic perturbation on climate was particularly strong. The Hudson’s Bay Company and the Moravian missionary archives report extremely cold temperatures and thick and persistent sea-ice conditions in the Hudson Bay and along the Labrador coast from October 1815 to March 1818, at the beginning of a generally cold 60 year period (Wil-son1992, D’Arrigo et al2003). These harsh climatic conditions contributed to poor hunting success, crop failure and famines afflicting native people, as well as European traders and colonists from Ontario to the Labrador coast (Suffling and Fritz1992, D’Arrigo et al
2003). In southern Quebec, severe winters between 1816 and 1819 caused the formation of exceptional
ice bridges on the St. Lawrence River near Quebec City for four consecutive years (Houle et al 2007). The Tambora impact in Eastern Canada is also vis-ible in biological proxy records. The lowest 1816 anomalies recorded in a Northern Hemisphere net-work of tree-ring density measurements come from the Quebec-Labrador Peninsula (Briffa et al 1998). Simultaneously and in the same region, we detect the beginning of a 40 year regime shift to the lowest val-ues of the last millennium in ring width chronologies (Gennaretti et al2014c). Unfavorable climatic condi-tions during the first half of the 19th century are also detectable in pollen datasets (Viau et al2012),𝛿18O cellulose of Sphagnum mosses (Bilali et al2013), and reconstructions of spruce height growth (Vall´ee and Payette2004). These climatic, historical and biological impacts are in line with the idea, corroborated by model simulation experiments, that Eastern Canada may be especially sensitive to volcanic forcing, if an ampli-fication by subsequent North Atlantic sea-ice-ocean feedbacks takes place (Otter˚a et al2010, Miller et al
2012). However, a comprehensive study merging sev-eral kinds of observed and simulated annually-resolved data from Eastern Canada during the Tambora time has yet to be carried out.
Here, we present an extensive network composed of early meteorological observations, climate simula-tions, and river and tree-ring proxy records to analyze the Tambora impacts in Eastern Canada. We evaluate the propagation of the of the Tambora signal through the regional climate and the forest ecosystems. As it has been shown for other regions or at the global scale (Segschneider et al2013, B¨untgen et al 2015), we hypothesize that the persistence of volcanic signals in biological records and in ecosystem carbon uptake may be longer than in the climate system. We also reconstruct tree mortality in the Eastern Canadian taiga during the early 19th century to analyze whether the Tambora eruption severely affected forest demography
Environ. Res. Lett. 13 (2018) 034017
and structure with long-term consequences. We then discuss the mechanisms that could have amplified the volcanic impact and that are not taken into account by ecophysiological models. Finally, we compare the likely impacts on forest carbon uptake of Tambora-like eruptions simulated under past (early 19th century) and current (last decades) climate conditions.
Materials and methods
Hydroclimate observations
We collected observed data from early meteorological records and annals of river break-up dates. The mete-orological records come from historical and modern observations from several observers and three locations in Southern Quebec: Montreal, Quebec City and Fort Coulonge (figure 1). These observations were com-piled by Slonosky (2014,2015),www.ncdc.noaa.gov/ paleo-search/study/16336into two unique time series for the St. Lawrence Valley of daily minimum and max-imum temperature values. Here we used the mean of the two time series over the 1803–2010 period (St. Lawrence Tmean hereafter). The river break-up dataset consists of the first break-up dates of river estuaries on the west coast of the Hudson and James Bays in the 18th and 19th centuries. These data were compiled by Moodie and Catchpole (1975) and used in a regional multi-proxy climate reconstruction (Guiot1985). We retained three rivers and locations with more complete data over the 1736–1866 period: Churchill Factory, Fort Albany and Moose Factory (figure1, dataset S1 available atstacks.iop.org/ERL/13/034017/mmedia).
Simulated climate
Thirteen climate simulations with all transient forc-ings of the Last Millennium Ensemble project (LME; Otto-Bliesner et al2016,www.cesm.ucar.edu/ projects/community-projects/LME/) were used to fur-ther evaluate the temporal and spatial climate impacts of the Tambora eruption over Eastern Canada. The LME offers the possibility to analyze a large ensemble of simulations varying for initial conditions (background state of the climate system at the beginning of the model runs) but conducted with the same up-to-date model version (CESM-CAM5_CN developed primar-ily at the National Center for Atmospheric Research) and using the same set of forcings over the 850–2005 period. In this way, we limit uncertainties due to the use of different models and forcing records which would complicate our analysis, but at the same time we can explore the natural forcing and internal vari-ability of the climate system with multiple simulations. For each simulation, we extracted the following climate variables: reference height (two meters) mean-maximum-minimum temperature, total precipitation and net solar flux at surface. These data were used to produce annual time series plots, monthly anomalies plots, and maps. A simple post-processing
method was applied to the data of the grid node in the middle of our study region in Eastern Canada (figure 1). This consisted in correcting each vari-able by the difference between its 1950–2005 average and the average value in the NRCan observational dataset (the gridded interpolated Canadian database of daily minimum–maximum temperature and pre-cipitation for 1950–2015; Hutchinson et al 2009,
http://cfs.nrcan.gc.ca/projects/3/4).
Tree-ring proxies and forest carbon
An extensive network of tree-ring temperature-sensitive proxy records covering the central Quebec-Labrador peninsula and always including the 1800–1850 period was assembled to analyze the Tamb-ora impact in Eastern Canada (figure1). This network includes data from living and subfossil spruce trees. All records from living trees go back at least to 1800 AD and come from Nicault et al (2014a, 2014b) and Naulier et al (2015), namely, 56 ring width chronologies (hereafter RW Liv.) calculated using the age-band standardization method (Briffa et al2001), 19 maximum density chronologies (MXD) and three
𝛿18O and 𝛿13C chronologies (rings were sampled at
a two-year resolution for the isotopic chronologies). Additionally, ring width data were derived from sub-fossil black spruces (tree remains into lakes) collected from six sites (Gennaretti et al 2014c). These data were assembled into six site-specific and two cam-bial age-specific chronologies covering the 910–2011 period (RW Sub.) using the regional curve standard-ization pivot correction method which was designed to reduce the impact of varying sampling heights in the used material (Autin et al 2015). Decadal tree-mortality rates at these same six sites were reconstructed from the outermost tree-ring dates of the subfossil trees. However, it must be noted that the outermost tree-rings are eroded with the time (Gennaretti et al
2014b) and that, as a consequence, the retrieved dates of tree deaths are antedated by some years.
The impact of the Tambora eruption on boreal forest aboveground carbon assimilation in eastern Canada was firstly evaluated through the computation of a wood biomass production index (MWI; g yr−1, Boucher et al2017) at the 19 sites where both tree-ring width and density measurements were available:
For thin slice of wood → BVI𝑡∝ BAI𝑡 MWI𝑡= BVIBW(𝑡)× 𝐷EW(𝑡)+ BVILW(𝑡)×
𝐷LW(𝑡)
(1)
where BVI is the basal volume increment (cm3), BAI is
the basal area increment (cm2), D is the wood den-sity (g cm−3), and EW and LW are the earlywood
and the latewood fractions, respectively. Secondly, the MAIDEN ecophysiological forest model (Misson
2004, Gea-Izquierdo et al2015), recently adapted for boreal black spruce sites (Gennaretti et al2017), was used to simulate the forest gross primary produc-tion (GPP) in the study region in Eastern Canada 3
1750 1800 1850 1900 1950 2000 180 160 140 120 Year DO Y Churchill Factory Fort Albany Moose Factory 0.00 0.06 180 160 140 120 pdf DO Y (c) (d) 1750 1800 1850 1900 1950 2000 0 2 468 1 0 1 2 Year Te mperature (°C) St. Lawrence Tmean 2 6 10 −10 −5 0 5 10 Month Te mperature anomaly (°C) (a) (b)
Figure 2. Hydroclimate observations. St. Lawrence annual Tmean time series (a) and 1816 monthly anomalies ((b); black: 1816
anomalies, grey: 90% confidence intervals computed with data over the 1803–1814 and 1818–2010 period). River estuaries’ first break-up date time series ((c); thin lines: annual values, bold lines: three-year running means; note that the y-axis is inverted and lower values correspond to later first break-up in spring) and their 1816 anomalies ((d); pdfs are empirical probability density functions and are computed with the running mean data over the 1736–1814 and 1818–1866 period, horizontal lines are 1816 values). In (a) and (c) vertical lines are important eruption years (see table1; Tambora is in red). DOY is the day of year.
Table 1. Years of large eruptions plotted in the figures and derived
from Gao et al (2008, global total stratospheric sulfate aerosol injection>15 Tg), Crowley and Unterman (2013, satellite aerosol optical depth>0.1), Esper et al (2013, eruptions classified as large events) or Sigl et al (2013,2015, eruptions classified as large events). Year Volcano Location 1739 Shikotsu Japan 1755 Katla Iceland 1783 Laki Iceland 1809 Unknown Unknown 1815 Tambora Indonesia 1831 Babuyan Philippines 1835 Cosiguina Nicaragua 1854 Shiveluch Russia 1875 Askja Iceland 1883 Krakatau Indonesia 1902 Santa Maria Guatamala 1907 Ksudach Russia 1912 Katmai USA 1913 Colima Mexico 1956 Bezymianny Russia 1963 Agung Indonesia 1991 Pinatubo Indonesia
during the Tambora time. We used as MAIDEN inputs daily minimum–maximum temperature and precipi-tation values extracted by the 13 LME simulations and CO2concentration data obtained by interpolating to
daily resolution the ice core CO2 record of MacFar-ling Meure et al (2006). The parameters used to run MAIDEN were sampled from their posterior distribu-tions described in Gennaretti et al (2017).
Statistical significance of the 1816 anomaly
The significance of the 1816 anomaly just after the 1815 Tambora eruption was verified in all the used datasets by comparing the 1816 values to the distribution of the data excluding the years most impacted by the Tambora (1815–1817). For climate simulations, we also com-pared the 1816 anomalies in the study area against the distribution of the 1816 anomalies from elsewhere (see figures2–5).
Results
The large amount of collected data, including hydro-climate observations, hydro-climate simulations and tree-ring proxies, is well-spread over Eastern Canada (figure
1). The St. Lawrence annual mean temperature (Tmean) time series indicates that the Tambora erup-tion induced a significant cooling over three years in
Environ. Res. Lett. 13 (2018) 034017
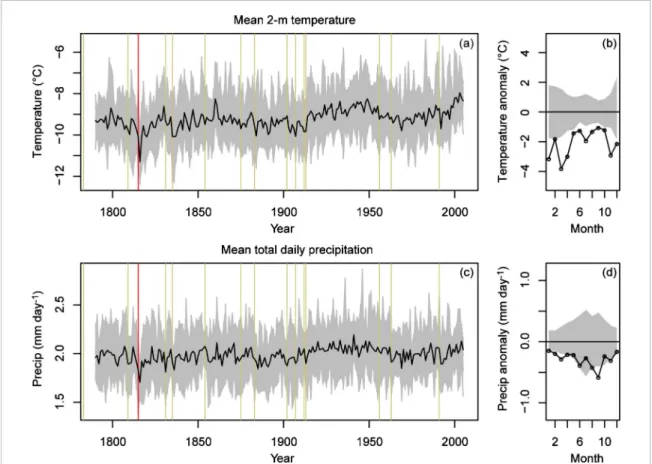
Figure 3. LME simulated values for the grid node in the middle of our study region in Eastern Canada. Mean 2 m temperature annual
time series ((a); black: mean of the 13 members, grey: inter-member spread) and 1816 monthly anomalies in the mean ensemble time series relative to the monthly-specific median value ((b); black: 1816 anomalies, grey: 90% confidence intervals computed with data over the 1790–1814 and 1818–2005 period of the mean ensemble time series). Mean total daily precipitation time series (c) and 1816 monthly anomalies (d). In (a) and (c) vertical lines are important eruption years (see table1; Tambora is in red).
Southern Quebec (1816–1818) with maximum 1816 negative anomalies up to −5◦C in spring and sum-mer (figure 2). At the same time, the first break-up date of the main rivers on the west coast of the Hud-son/James Bays was delayed by about 10 d and was especially late in 1817 indicating cold winter/spring conditions (figure2). Comparatively, climate simula-tions of the LME project highlight that the Tambora produced negative anomalies in Eastern Canada on both temperature and precipitation time series (figure
3), but these anomalies lasted only one year and the 1816 temperature anomalies were more negative in winter than in summer (the opposite was shown by the St. Lawrence Tmean). The LME simulations also highlight that Eastern Canada was one of the regions of the world displaying the coldest temperature anoma-lies in 1816 which was a cold year almost everywhere (figures4(a)–(b)). These anomalies in Eastern Canada were not associated with a reduction of solar irradi-ance (figures4(e)–(f)), suggesting that they were caused by some climate feedbacks or teleconnections affecting the atmospheric circulation. The 1816 global picture is much more complicated for precipitation anomalies (figures4(c)–(d)). Some regions of the world displayed wet anomalies and others displayed dry anomalies, such as Eastern Canada.
Tree-ring proxy records in Eastern Canada were strongly impacted by the Tambora eruption and, to a
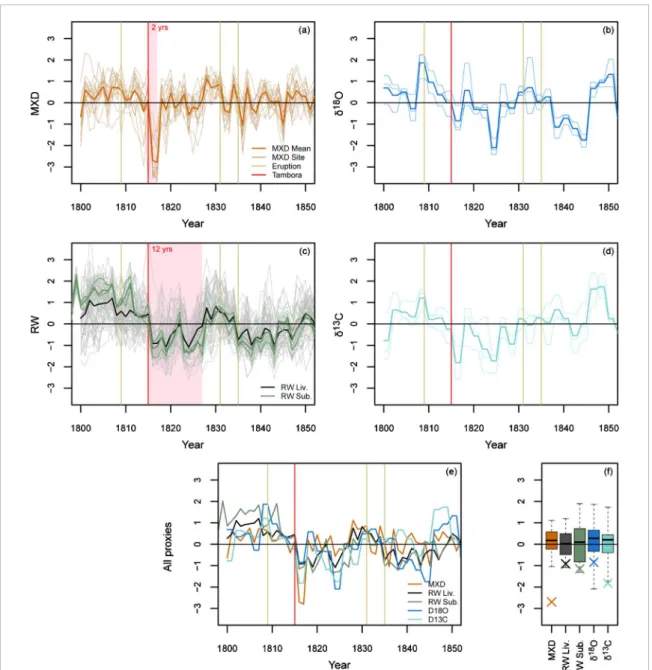
lesser extent, by the other large eruptions of the first half of the 19th century (figure5). The strength and the persistence of the impact depend on the proxy. The MXD time series show the lowest indexes in 1816 and 1817, which are followed by fast recovery. Conversely, the RW time series drop down in 1816 and remain low for about 12 years, with the exception of normal growth in 1822. The recovery process was almost completed in 1828 but the 1831 Babuyan and the 1835 Cosiguina eruptions reduced the growth again. A similar response is shown by the isotopic proxies (𝛿18O and𝛿13C), with
particularly low values in 1824 and 1825 (these years are negative anomalies for all proxies). Although RW data come from a large region in Eastern Canada (figure
1), the behavior of the RW time series (figure 5(c)) is extremely consistent whatever the site, the material used (living or subfossil trees), and the tree cambial age (subfossill trees with cambial ages< 50 years or cambial
ages> = 50 years).
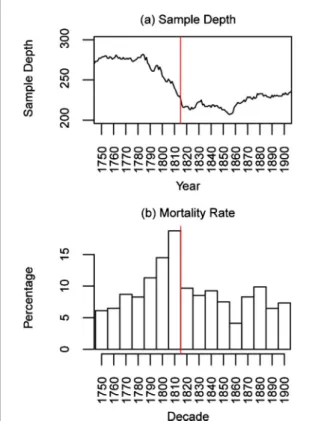
The RW data from subfossil trees allow the anal-ysis of the Tambora impact on tree mortality. These data are extremely robust due to the high sample depth (overall replication always over 200 trees; figure6(a)), which declines up to the Tambora eruption suggesting that a massive tree mortality was likely linked to this event. Figure6(b) indicates that 19% of the trees died in the decade ending in 1815 and 15% in the decade ending in 1805. Note that tree mortality is slightly 5
Figure 4. Average 1816 global anomaly fields of the 13 member LME ensemble relative to the 25 year period between 1790 and 1814.
We show anomalies of mean 2 m temperature ((a);◦C), mean total daily precipitation ((c); mm day−1), and mean net solar flux at
surface ((e); W m−2). White areas denote non-significant anomalies (one-sample Wilcoxon test with p> 0.05; n = 13). In (b), (d) and
(f) the value of the grid point in the middle of our study region in Eastern Canada is indicated by a red horizontal line and is compared to the distribution of the values in the maps (PDFs).
antedated here because it is reconstructed with the outermost tree-ring dates and subfossil trees lose, through erosion, an average of 3.2 outermost rings per century, a rate subjected to high variations accord-ing to the conditions of preservation (Gennaretti et
al 2014b). This indicates that the actual death date of the trees should be closer to 1816 and that the
mortality caused by the Tambora (post 1815) should be likely higher than 20%, meaning four times higher than the background level. The subsequent eruptions (e.g. the 1835 Cosiguina eruption) were not associated to any detectable mortality events likely because a large portion of the most vulnerable trees had already died after the Tambora eruption.
Environ. Res. Lett. 13 (2018) 034017
Figure 5. Tree-ring proxy time series in Eastern Canada over the 1800–1850 time period. In (a)–(d) we see single site (19 MXD
chronologies in (a); 3𝛿18O chronologies in (b); 56 RW Liv. and 6 RW Sub. chronologies in (c); 3𝛿13C chronologies in (d)) and
mean multisite chronologies. All data are transformed in z-scores. The red shadow in (a) and (c) highlights the years impacted by the Tambora. Two cambial age-specific multisite chronologies are also shown in (c) for the subfossil material (bold green dotted lines; cambial ages< 50 years and cambial ages > = 50 years). The independent multisite chronologies are compared in (e). The (f) plot shows the 1816 anomalies (crosses) relative to the distribution of the data over the 1800–1814 and 1818–1850 period (quartiles and extreme values). In (a)–(e) vertical lines are important eruption years (see table1; Tambora is in red). MXD is ring maximum density chronologies, RW Liv. and Sub. are ring width chronologies from living and subfossil trees, respectively.
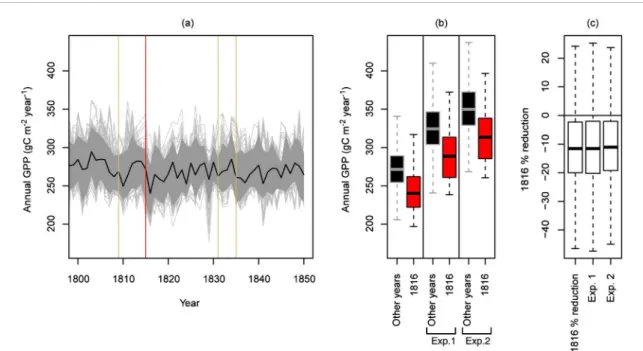
If we use the computed wood biomass produc-tion index at 19 sites as a proxy of the boreal forest aboveground carbon assimilation in eastern Canada, we can conclude that carbon dynamics are very simi-lar to ring width variations (figure7). This is because the coefficient of variation (ratio of the standard devi-ation to the mean) of the basal volume increments is nine times larger than that of wood density values (see equation1). Consequently, the Tambora impact seems to last 12 years such as for RWs. This long-term impact is not captured by the MAIDEN simulations of black spruce GPP values during the Tambora time
(figure 8). Indeed, these simulations only show one important negative anomaly in 1816 with a median percent reduction of GPP values of −11.6%. This lack of persistence is likely due to a combination of reasons: (1) the LME time series used as MAIDEN input underestimate the persistence of the Tamb-ora impact on the regional climate (compare figures
2(a) and 3(a)); (2) the real mechanism forcing the physiological persistence of poor growth over sev-eral years two centuries ago remains unidentified and is not taken into account by ecophysiological forest models.
Figure 6. Sample depth ((a); number of trees) and tree
mortal-ity rate ((b); percentage of tree mortalmortal-ity over the total sample depth per each ten year class) in the subfossil material (all six sites). The Tambora year is the red line.
Figure 7. Wood biomass production index (MWI; values
transformed in z-scores) over the 1800–1850 period at the 19 sites where both tree-ring width and density measurements are available. Vertical lines are important eruption years (see table1; Tambora is in red).
Discussion
Our results illustrate that the legacy effects of the Tamb-ora eruption in Eastern Canada depend on the record. There are significant differences between hydrocli-mate observations and the specific proxy records. The amplitude of the 1816 anomaly in the early tem-perature observations is similar to that in the ring width and𝛿13C time series. In contrast, ring density
records appear to be overly sensitive (figure9), a result consistent with the findings of Tingley et al (2014)
pointing out the impact on wood density of reduced light availability after volcanic eruptions. However, ring width and𝛿13C values show a much longer persistence of the Tambora impact (12 years) than temperature observations (three years) and ring density (two years). Ring width records are known to have a smoothed delayed response to volcanic events (Esper et al2015) because carbon dynamics in trees are generally the results of processes occurring during the current and the previous years (e.g. tree damage and recovery processes, accumulation of stored non-structural car-bohydrates; see Carbone et al 2013). On the other hand, 𝛿13C values are a proxy of the plant intrinsic
water use efficiency (Moreno-Guti´errez et al2012, Far-quhar et al1989, McCarroll and Loader2004), which is directly related to the net photosynthetic rate and inversely related to the stomatal conductance. Conse-quently, the low𝛿13C values after the Tambora eruption indicates a slow photosynthetic rate that lasted for some years and/or an increase of stomatal conduc-tance after foliage losses (see Berninger et al2000). These findings highlight that different biases may be present in reconstructions based on specific proxies and that multi-proxy approaches should be preferred. The post-Tambora three-year persistence detected in annual temperature observations may seem quite short because simulations studies have shown that Eastern Canada could be sensitive to strong volcanic erup-tions, especially in volcanic active periods such as the early 19th century. Indeed, eruptions may be linked to the inception of longer-term feedbacks (e.g. variation in the Atlantic thermohaline circulation) determining the Atlantic multidecadal variability (Otter˚a et al2010, Miller et al2012, Schleussner and Feulner2013). How-ever, if we exclude tree-ring widths and isotopes, no other annually resolved observation (MXD, historical sources, river and sea-ice observations) shows a Tamb-ora impact longer than four years in Eastern Canada (see data collected for this study and references cited in the introduction). Consequently, our results suggest a longer persistence of the Tambora signal in some spe-cific Eastern Canada tree-ring proxy records than in the regional climate, which is in accordance with what has been found in Europe (B¨untgen et al2015).
Tree-ring data are excellent climate proxy records and, more specifically, are archives of changes in for-est processes. Here, using our ring width and density data, we suggest that the carbon uptake of the black spruce trees in Eastern Canada was dampened for 12 years following the Tambora (figure7). Such a long impact on forest processes is also testified by the𝛿13C
time series (figure5). Simulation studies have already shown that volcanic perturbations are longer on land carbon pools than on global climate because of slower recovery processes (Segschneider et al2013). However, our findings highlight that the Tambora legacy in East-ern Canada may be even longer than one or two decades because the eruption also triggered a massive tree mor-tality episode (figure6). Consequently, the Tambora
Environ. Res. Lett. 13 (2018) 034017
Figure 8. Black spruce forest GPP time series simulated by MAIDEN in the middle of our study region in Eastern Canada (a). The
average of 130 simulations is shown (black line; ten simulations per each LME-member climate record sampling the MAIDEN sensitive parameters from their plausible distributions for the study region; see Gennaretti et al2017) as well as the 80% confidence interval (dark grey shadow) and the outlier simulations (light grey thin lines). Vertical lines are important eruption years (see table1, Tambora is in red). The boxes and whiskers in (b) show the distribution of the simulated values over the 1800–1814 and 1818–1850 period compared to the distribution for the year 1816. The GPP percent reduction in 1816 relative to the other years is shown in (c). In (b) and (c), the distributions obtained in the experiment 1 (fixed CO2concentration equal to the 1985–2005 mean) and the experiment 2 (CO2 as in experiment 1 and temperature and precipitation time series modified by constant deltas: +0.56◦C and +0.74% respectively) are also shown.
impact on tree density could have persisted until the present because, in the study region, forest grows slowly and was almost unable to regenerate by seed during the Little Ice Age (Payette et al2008). Indeed, the com-plete maturation of black spruce embryos needs at least 800 growing degree-days (above 5◦C; Meunier et al
2007), a threshold still not attained today in the center of the study region. Thus, each mortality event may be associated with a persistent shift in forest structure and composition (Gennaretti et al2014a).
We suggest two complementary hypotheses to explain the mortality event and the long persistence of the Tambora impact on the forest even if more favorable climatic conditions were reestablished four-five years after the eruption. The first hypothesis is related to the occurrence of frost damages, followed by long-term recovery processes to rebuild the canopy photosynthetic capacity. This mechanism would be in part similar to that suggested by Fayle et al (1992). Immature shoot development during short growing seasons combined with needle and bud erosion dur-ing the cold winters in 1816-17 most likely damaged upper crowns of dominant trees, leading to growth form regression and increased stem mortality. The plausibility of this mechanism is supported by the finding of Arseneault and Payette (1997) that growth forms and ring widths of black spruce at a treeline site were severely impacted for several decades following a series of strong volcanic eruptions during the 1450s (Esper et al 2017). Similarly, an extended episode of tree mortality in a Labrador treeline forest stand
during the early 19th century has been attributed to progressive erosion of foliage and buds by severe win-ter conditions (Payette2007). The second hypothesis is related to a likely frost disturbance of the ‘rootable’ soil layer. The 19th century is known to be a period with intense ice-wedge and permafrost activity in North-eastern Canada (Kasper and Allard2001). Although permafrost is generally absent from forested sites in Quebec-Labrador, due to high winter precipitation and snow retention (Payette2001), short-term cool-ing events (three-four years), such as the one produced by the Tambora, could have resulted in deeper freezing and shorter frost-free season. This mechanism could have been amplified by a thin snow cover in 1816, as suggested by climate simulations (figure3(d)), and by the presence of an insulating moss-Sphagnum mat, as it is the case in several taiga forest stands, that would have preserved the frozen soil.
Our results illustrate that the Tambora imprint in Eastern Canada is more persistent on observed data than on simulated ones (climate and forest-growth sim-ulations). The LME mean temperature records show a stronger 1816 anomaly than climate observations (figure 9), but the low anomalies last one year only (figure3). Indeed, at the regional level, decadal climate responses to volcanic eruptions may be controlled by the internal climate variability and by the background state of the climate system (e.g. the climatic impact of an eruption on a specific region can differ according to the preceding atmospheric and oceanic state; Zanchet-tin et al 2013). Consequently, the clear 6–10 year 9
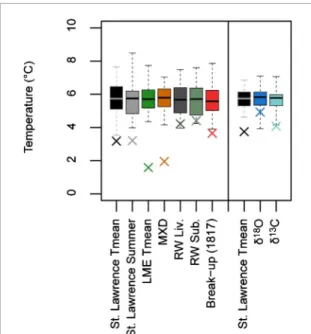
Figure 9. 1816 anomalies (crosses) in specific records: St.
Lawrence Tmean and summer (July–August means) temper-ature values, Last Millennium Ensemble (LME) 2 m mean temperature, ring maximum density chronologies (MXD), ring width chronologies from living trees (RW Liv.), ring width chronologies from subfossil trees (RW Sub.), the mean first break-up date at Fort Albany and Moose Factory,𝛿18O and
𝛿13C. All records are scaled to have same mean and
vari-ance than St. Lawrence Tmean over the 1800–1850 period. Boxes and whiskers show quartiles and extreme values of the data over the 1800–1814 and 1818–1850 period. For the river break-up record, the cross highlights the 1817 anomaly which is the lowest anomaly following the Tambora in this record. In the right side of the figure, the St. Lawrence Tmean record was preprocessed to have a two-year resolution and to be comparable to the𝛿18O and𝛿13C tree-ring records.
post-Tambora negative temperature anomalies sim-ulated by different GCMs at the global scale (Raible
et al2016) are much noisier at the regional scale. The
absence of a reduction of the solar flux at surface over Eastern Canada in 1816 (figure4(e)) seems to repre-sent a LME bias because reduced light availability is suggested by our observed data (ring density and𝛿13C
low values). The short-term temperature anomaly in the LME records contributed to the short-term reduc-tion of black spruce primary producreduc-tion simulated by MAIDEN in the study area (figure8). However, this short-term effect may be primarily explained by the fact that both hypotheses formulated in the previous paragraph are linked to mechanisms that are not taken into account by process-based vegetation models. Con-sequently, although MAIDEN is able to consider the influence of carbon stored during previous years on stand carbon dynamics (Gennaretti et al 2017), our GPP simulations only show a post-Tambora anomaly of one year. The 11.6% GPP reduction simulated by MAIDEN in 1816 may had partially or completely been counteracted by a concomitant reduction in soil respiration (not simulated by MAIDEN), which is known to occur in northern latitudes following vol-canic eruptions (Tjiputra and Otter˚a2011, Kandlbauer
et al2013). For all these reasons, the response of the
studied boreal ecosystem in terms of net ecosystem production following the Tambora and the investi-gation of the mechanisms amplifying the volcanic perturbation remain interesting topics for future studies.
Ultimately, our study may help anticipate the effects of a future Tambora-like eruption on the eastern Cana-dian boreal forest carbon uptake. At the global scale, some simulation studies have shown that Tambora-like eruptions occurring in the 21th century could delay the upcoming warming by approximately two decades and could significantly increase the terrestrial global car-bon uptake (Tjiputra and Otter˚a2011, Schurer et al
2015). This global picture is much more uncertain at the regional scale. For our study region, we compared the 1816 GPP anomalies simulated by MAIDEN for black spruce forests (figure 8) with those simulated with modified versions of the early 19th century input climate. In the first experiment, we fixed the atmo-spheric CO2concentration data to the mean value of the 1985–2005 period (358 ppm; +74 ppm relative to 1800–1850; MacFarling Meure et al2006). The simu-lated GPP values increased by about 50 g C m−2year−1
(figure8(b)) but the 1816 relative percent reduction (figure 8(c)) remained practically unchanged. In the second experiment, in addition to the CO2 modifi-cation, we also modified the LME temperature and precipitation time series to have their 1800–1850 mean equal to their 1985–2005 mean: +0.56◦C for tempera-ture and +0.74% for precipitation. Although these are small climatic deltas, the average GPP values increased an additional 25 g C m−2year−1(figure8(b)). However,
the 1816 relative percent reduction remained very sim-ilar and only just slightly smaller (the median values shifted from −11.6% to −11.0%; figure8(c)). These analyses suggest that immediately after Tambora-like events, similar or slightly reduced impacts to those of the early 19th century can be expected on the Eastern Canada forest carbon uptake. However, the persis-tence of the impact and the tree mortality should be reduced in the current and future warmer climate if the triggering mechanisms are those suggested above. Furthermore, the regenerative potential of black spruce forests following disturbances is higher today than in the 19th century (Meunier et al2007).
Conclusion
In this study, we collected a large amount of data from different and complementary sources over East-ern Canada, to provide an in-depth evaluation of the Tambora impact on climate and forest processes. We confirm the results of previous studies for other regions, showing that the terrestrial biosphere is much more sensitive to volcanic eruptions than the climate sys-tem. We point out that the Tambora legacy on the structure of the North American taiga could have per-sisted until the present. Indeed, the eruption caused a
Environ. Res. Lett. 13 (2018) 034017
mortality event of the dominant trees during an unfa-vorable period for forest regeneration. We suggest two mechanisms to explain the observed tree mortality and the persistence of the Tambora impact on the forest carbon uptake: (1) frost damages eroding the spruce growth forms; (2) deeper freezing and shorter frost-free season in the soil. These mechanisms are not considered by process-based vegetation models, which underesti-mate the Tambora legacy on northern ecosystems.
Acknowledgments
This project has received funding from the Euro-pean Union’s Horizon 2020 research and innovation programme under the Marie Sklodowska-Curie grant agreement No 656896.
ORCID iDs
Fabio Gennaretti https://orcid.org/0000-0002-8232-023X
References
Arseneault D and Payette S 1997 Reconstruction of millennial forest dynamics from tree remains in a subarctic tree line peatland Ecology78 1873–83
Autin J, Gennaretti F, Arseneault D and B´egin Y 2015 Biases in RCS tree ring chronologies due to sampling heights of trees
Dendrochronologia36 13–22
Bilali H E, Patterson R T and Prokoph A 2013 A Holocene paleoclimate reconstruction for eastern Canada based on
𝛿18O cellulose of Sphagnum mosses from Mer Bleue Bog Holocene 23 1260–71
Berninger F, Sonninen E, Aalto T and Lloyd J 2000 Modeling 13 C discrimination in tree rings Glob. Biogeochem. Cycles14
213–23
Boucher E, Nicault A, Arseneault D, B´egin Y and Karami M P 2017 Decadal variations in Eastern Canada’s taiga wood biomass production forced by ocean-atmosphere interactions Sci. Rep.
7 2457
Briffa K R, Jones P D, Schweingruber F H and Osborn T J 1998 Influence of volcanic eruptions on Northern Hemisphere summer temperature over the past 600 years Nature393 450–5
Briffa K R, Osborn T J, Schweingruber F H, Harris I C, Jones P D, Shiyatov S G and Vaganov E A 2001 Low-frequency temperature variations from a northern tree ring density network J. Geophys. Res. D Atmos.106 2929–41
Brugnara Y et al 2015 A collection of sub-daily pressure and temperature observations for the early instrumental period with a focus on the ‘year without a summer’ 1816 Clim. Past
11 1027–47
B¨untgen U et al 2015 Tree-ring amplification of the early nineteenth-century summer cooling in central europe J. Clim.
28 5272–88
Carbone M S, Czimczik C I, Keenan T F, Murakami P F, Pederson N, Schaberg P G, Xu X and Richardson A D 2013 Age, allocation and availability of nonstructural carbon in mature red maple trees New Phytol.200 1145–55
Crowley T J and Unterman M B 2013 Technical details concerning development of a 1200 year proxy index for global volcanism
Earth Syst. Sci. Data5 187–97
D’Arrigo R, Buckley B, Kaplan S and Woollett J 2003 Interannual to multidecadal modes of labrador climate variability inferred from tree rings Clim. Dyn.20 219–28
Esper J, B¨untgen U, Luterbacher J and Krusic P J 2013 Testing the hypothesis of post-volcanic missing rings in temperature sensitive dendrochronological data Dendrochronologia31
216–22
Esper J, Schneider L, Smerdon J E, Sch¨one B R and B¨untgen U 2015 Signals and memory in tree-ring width and density data
Dendrochronologia35 62–70
Esper J, B¨untgen U, Hartl-Meier C, Oppenheimer O and Schneider L 2017 Northern Hemisphere temperature anomalies during the 1450s period of ambiguous volcanic forcing Bull. Volcanol.
79 41
Fayle D C, Bentley C V and Scott P A 1992 How did treeline white spruce at Churchill, Manitoba respond to conditions around 1816 The Year Without a Summer (Ottawa: Canadian Museum of Nature) pp 281–90
Farquhar G D, Ehleringer J R and Hubick K T 1989 Carbon isotope discrimination and photosynthesis Annu. Rev. Plant. Physiol.
Plant. Mol. Biol.40 503–37
Gao C, Robock A and Ammann C 2008 Volcanic forcing of climate over the past 1500 years: An improved ice core-based index for climate models J. Geophys. Res. Atmos.113 D23111
Gea-Izquierdo G, Guibal F, Joffre R, Ourcival J M, Simioni G and Guiot J 2015 Modelling the climatic drivers determining photosynthesis and carbon allocation in evergreen Mediterranean forests using multiproxy long time series
Biogeosciences12 3695–712
Gennaretti F, Arseneault D and B´egin Y 2014a Millennial disturbance-driven forest stand dynamics in the Eastern Canadian taiga reconstructed from subfossil logs J. Ecol.102
1612–22
Gennaretti F, Arseneault D and B´egin Y 2014 b Millennial stocks and fluxes of large woody debris in lakes of the North American taiga J. Ecol.102 367–80
Gennaretti F, Arseneault D, Nicault A, Perreault L and B´egin Y 2014 c Volcano-induced regime shifts in millennial tree-ring chronologies from northeastern North America Proc. Natl
Acad. Sci. USA111 10077–82
Gennaretti F, Gea-Izquierdo G, Boucher E, Berninger F, Arseneault D and Guiot J 2017 Ecophysiological modeling of
photosynthesis and carbon allocation to the tree stem in the boreal forest Biogeosci. 14 4851–66
Guiot J 1985 Reconstruction of seasonal temperatures and sea-level pressures in the Hudson Bay area back to 1700 Climatol. Bull.
19 11–59
Harington C R 1992 The year without a summer? World climate in 1816 (Ottawa: Canadian Museum of Nature)
Houle D, Moore J-D and Provencher J 2007 Ice bridges on the St. Lawrence river as an index of winter severity from 1620–1910
J. Clim. 20 757–64
Hutchinson M F, McKenney D W, Lawrence K, Pedlar J H, Hopkinson R F, Milewska E and Papadopol P 2009 Development and testing of Canada-wide interpolated spatial models of daily minimum-maximum temperature and precipitation for 1961–2003 J. Appl. Meteorol. Climatol.48
725–41
Kandlbauer J, Hopcroft P O, Valdes P J and Sparks R S J 2013 Climate and carbon cycle response to the 1815 Tambora volcanic eruption J. Geophys. Res. Atmos. 118
12497–507
Kasper J N and Allard M 2001 Late-Holocene climatic changes as detected by the growth and decay of ice wedges on the southern shore of Hudson Strait, northern Qu´ebec, Canada
Holocene 11 563–77
MacFarling Meure C, Etheridge D, Trudinger C, Steele P, Langenfelds R, van Ommen T, Smith A and Elkins J 2006 Law Dome CO2, CH4and N2O ice core records extended to 2000 years BP Geophys. Res. Lett.33 L14810
McCarroll D and Loader N J 2004 Stable isotopes in tree rings
Quaternary Sci. Rev.23 771–801
Meunier C, Sirois L and B´egin Y 2007 Climate and Picea mariana seed maturation relationships: a multi-scale perspective Ecol.
Monogr. 77 361–76
Miller G H et al 2012 Abrupt onset of the Little Ice Age triggered by volcanism and sustained by sea-ice/ocean feedbacks Geophys.
Res. Lett.39 L02708
Misson L 2004 MAIDEN: a model for analyzing ecosystem processes in dendroecology Can. J. Forest Res.34 874–87
Moodie D W and Catchpole A J W 1975 Environmental Data from
Historical Documents by Content Analysis: Freeze-up and Break-up of Estuaries on Hudson Bay (Winnipeg: Department
of Geography University of Manitoba) 1714–871 Moreno-Guti´errez C, Dawson T E, Nicol´as E and Querejeta J I
2012 Isotopes reveal contrasting water use strategies among coexisting plant species in a mediterranean ecosystem New
Phytol.196 489–96
Naulier M, Savard M, B´egin C, Marion J, Nicault A and B´egin Y 2015 Temporal instability of isotopes–climate statistical relationships–A study of black spruce trees in northeastern Canada Dendrochronologia34 33–42
Nicault A, Boucher E, B´egin C, Guiot J, Marion J, Perreault L, Roy R, Savard M and B´egin Y 2014a Hydrological reconstruction from tree-ring multi-proxies over the last two centuries at the Caniapiscau Reservoir, northern Qu´ebec, Canada J. Hydrol.
513 435–45
Nicault A et al 2014b Spatial analysis of the black spruce (Picea
mariana [MILL] B.S.P.) radial growth response to climate in
northern Qu´ebec, Canada Can. J. Forest Res. 45 343–52 Oppenheimer C 2003 Climatic, environmental and human
consequences of the largest known historic eruption: Tambora volcano (Indonesia) 1815 Prog. Phys. Geogr.27 230–59
Otter˚a O H, Bentsen M, Drange H and Suo L 2010 External forcing as a metronome for Atlantic multidecadal variability Nat.
Geosci.3 688–94
Otto-Bliesner B L, Brady E C, Fasullo J, Jahn A, Landrum L, Stevenson S, Rosenbloom N, Mai A and Strand G 2016 Climate variability and change since 850 CE: an ensemble approach with the community earth system model Bull. Am.
Meteorol. Soc.97 735–54
Payette S 2001 Les processus et les formes p´eriglaciaires ´Ecologie
des tourbi`eres du Qu´ebec-Labrador. Les Presses de l’universit´e Laval, Québec ed S Payette and L Rochefort pp 199–239
Payette S 2007 Contrasted dynamics of northern Labrador tree lines caused by climate change and migrational lag Ecology88
770–80
Payette S, Filion L and Delwaide A 2008 Spatially explicit fire-climate history of the boreal forest-tundra (Eastern Canada) over the last 2000 years Phil. Trans. R Soc. B Biol. Sci.
363 2301–16
Raible C C et al 2016 Tambora 1815 as a test case for high impact volcanic eruptions: Earth system effects Wiley Interdiscip. Rev.
Clim. Change 7 569–89
Schleussner C F and Feulner G 2013 A volcanically triggered regime shift in the subpolar North Atlantic Ocean as a possible origin of the Little Ice Age Clim. Past9 1321–30
Schurer A P, Hegerl G C and Obrochta S P 2015 Determining the likelihood of pauses and surges in global warming Geophys.
Res. Lett.42 5974–82
Segschneider J, Beitsch A, Timmreck C, Brovkin V, Ilyina T, Jungclaus J, Lorenz S J, Six K D and Zanchettin D 2013 Impact of an extremely large magnitude volcanic eruption on the global climate and carbon cycle estimated from ensemble earth system model simulations Biogeosciences10
669–87
Self S, Gertisser R, Thordarson T, Rampino M and Wolff J 2004 Magma volume, volatile emissions, and stratospheric aerosols from the 1815 eruption of tambora Geophys. Res. Lett.31
L20608
Sigl M et al 2013 A new bipolar ice core record of volcanism from WAIS Divide and NEEM and implications for climate forcing of the last 2000 years J. Geophys. Res. Atmos.118
1151–69
Sigl M et al 2015 Timing and climate forcing of volcanic eruptions for the past 2, 500 years Nature523 543–9
Slonosky V 2014 Historical climate observations in Canada: 18th and 19th century daily temperature from the St. Lawrence Valley, Quebec Geosci. Data J.1 103–20
Slonosky V C 2015 Daily minimum and maximum temperature in the St-Lawrence Valley, Quebec: two centuries of climatic observations from Canada Int. J. Climatol.35 1662–81
Suffling R and Fritz R 1992 The Ecology of a Famine: Northwestern
Ontario in 1815–17 ed C Harington (Ottawa: Canadian
Museum of Nature) pp 203–17
Tingley M P, Stine A R and Huybers P 2014 Temperature reconstructions from tree-ring densities overestimate volcanic cooling Geophys. Res. Lett.41 7838–45
Tjiputra J F and Otter˚a O H 2011 Role of volcanic forcing on future global carbon cycle Earth Syst. Dyn.2 53–67
Vall´ee S and Payette S 2004 Contrasted growth of black spruce (Picea mariana) forest trees at treeline associated with climate change over the last 400 years Arctic Antarct. Alpine Res.36
400–6
Viau A E, Ladd M and Gajewski K 2012 The climate of North America during the past 2000 years reconstructed from pollen data Glob. Planet Change 84 75–83
Wagner S and Zorita E 2005 The influence of volcanic, solar and CO2forcing on the temperatures in the dalton minimum 1790–1830: a model study Clim. Dyn. 25 205–18
Wilson C 1992 Climate in Canada, 1809-20: three approaches to the Hudson’s Bay company archives as an historical database
The Year Without a Summer (Ottawa: Canadian Museum of
Nature) 162–84
Zanchettin D, Bothe O, Graf H F, Lorenz S J, Luterbacher J, Timmreck C and Jungclaus J H 2013 Background conditions influence the decadal climate response to strong volcanic eruptions J. Geophys. Res. D Atmos.118


![Hvat er tað ímyndaða Norður? Etiskar grundreglur [Qu'est-ce que l'imaginaire du Nord? Principes éthiques — traduction en féroïen]](data:image/gif;base64,R0lGODlhAQABAIAAAP///wAAACH5BAEAAAAALAAAAAABAAEAAAICRAEAOw==)