HAL Id: hal-01118359
https://hal-mines-paristech.archives-ouvertes.fr/hal-01118359
Submitted on 18 Feb 2015
HAL is a multi-disciplinary open access
archive for the deposit and dissemination of
sci-entific research documents, whether they are
pub-lished or not. The documents may come from
teaching and research institutions in France or
abroad, or from public or private research centers.
L’archive ouverte pluridisciplinaire HAL, est
destinée au dépôt et à la diffusion de documents
scientifiques de niveau recherche, publiés ou non,
émanant des établissements d’enseignement et de
recherche français ou étrangers, des laboratoires
publics ou privés.
Distributed under a Creative Commons Attribution| 4.0 International License
Estimating the photosynthetically active radiation under
clear skies by means of a new approach
William Wandji Nyamsi, Bella Espinar, Philippe Blanc, Lucien Wald
To cite this version:
William Wandji Nyamsi, Bella Espinar, Philippe Blanc, Lucien Wald. Estimating the
photosyntheti-cally active radiation under clear skies by means of a new approach. Advances in Science and Research,
Copernicus Publications, 2015, 12, pp.5 - 10. �10.5194/asr-12-5-2015�. �hal-01118359�
Adv. Sci. Res., 12, 5–10, 2015 www.adv-sci-res.net/12/5/2015/ doi:10.5194/asr-12-5-2015
© Author(s) 2015. CC Attribution 3.0 License.
EMS
Ann
ual
Meeting
&
10th
European
Conf
erence
on
Applied
Climatology
(ECA
C)
Estimating the photosynthetically active radiation under
clear skies by means of a new approach
W. Wandji Nyamsi, B. Espinar, P. Blanc, and L. Wald
MINES ParisTech, PSL Research University, O. I. E. – Centre Observation, Impacts, Energy, Sophia Antipolis CEDEX, France
Correspondence to: W. Wandji Nyamsi (william.wandji@mines-paristech.fr)
Received: 2 December 2014 – Accepted: 26 January 2015 – Published: 18 February 2015
Abstract. The k-distribution method and the correlated-k approximation of Kato et al. (1999) is a computa-tionally efficient approach originally designed for calculations of the broadband solar radiation by dividing the solar spectrum in 32 specific spectral bands from 240 to 4606 nm. This paper describes a technique for an ac-curate assessment of the photosynthetically active radiation (PAR) from 400 to 700 nm at ground level, under clear-sky conditions using twelve of these spectral bands. It is validated against detailed spectral calculations of the PAR made by the radiative transfer model libRadtran. For the direct and global PAR irradiance, the bias is −0.4 W m−2 (−0.2 %) and −4 W m−2(−1.3 %) and the root mean square error is 1.8 W m−2 (0.7 %) and 4.5 W m−2(1.5 %). For the direct and global Photosynthetic Photon Flux Density, the biases are of about
+10.3 µmol m−2s−1(+0.8 %) and 1.9 µmol m−2s−1(−0.1 %) respectively, and the root mean square error is 11.4 µmol m−2s−1(0.9 %) and 4.0 µmol m−2s−1(0.3 %). The correlation coefficient is greater than 0.99. This technique provides much better results than two state-of-the-art empirical methods computing the daily mean of PAR from the daily mean of broadband irradiance.
1 Introduction
Photosynthetically active radiation, abbreviated in PAR, is the solar radiation in the range [400, 700] nm that can be used by organisms via the process of photosynthesis. PAR is defined as the incident power per unit surface for this spec-tral interval and may be expressed in W m−2. PAR is also a measure of the photosynthetic photon flux density, abbrevi-ated in PPFD and expressed in µmol m−2s−1, and is defined as the number of the incident photons per unit time per unit surface. Both units are linked by the widely used approxi-mation 1 W m−2≈4.57 µmol m−2s−1(McCree, 1972). PAR
is a portion of the total, also known as broadband, solar ir-radiance. Whatever the spectral interval, the solar radiation available at ground level on a horizontal plane is called the global radiation. The global is the sum of the direct compo-nent that comes from the direction of the sun and the diffuse component that comes from the rest of the sky vault. Let note respectively G, PGand QP, the global broadband irradiance,
the global PAR irradiance, and the global PPFD at ground level.
In situ measurements of PAR are rare in space and time. This scarcity leads researchers and practitioners to calculate PAR from the global broadband solar irradiance by empirical means. For example, Udo and Aro (1999) proposed a ratio of 2.079 between the daily mean of G and the daily mean of
QP:
QP=2.079G (1)
where the constant 2.079 is in µmol J−1. Jacovides et al. (2004) suggested a ratio of 1.919. These authors acknowl-edge that the actual ratio depends on the sky conditions and atmospheric properties.
Other approaches to PAR assessment and more generally to assessment of the solar radiation in any spectral inter-val are atmospheric radiative transfer models (RTM). Be-sides the difficulty in knowing all inputs requested by RTMs, their main disadvantage is the computational load because many spectral calculations must be performed. Several meth-ods have been proposed to reduce the number of calcula-tions. Among them, are the k-distribution method and the correlated-k approximation proposed by Kato et al. (1999)
6 W. Wandji Nyamsi et al.: Estimating the photosynthetically active radiation under clear skies
Table 1.KB covering and close to PAR spectral interval, selected sub-intervals δ λi, slopes and intercepts of the affine functions between the
clearness indices in KB and sub-intervals δ λiobtained from libRadtran simulations.
KB Interval 1 λ, Sub-interval δ λ, Global Direct normal
nm nm (#i) Slope ai Intercept bi Slope ci Intercept di
6 363–408 385–386 (#1) 0.9987 −0.0023 1.0030 −0.0032 7 408–452 430–431 (#2) 1.0026 −0.0004 0.9995 0.0013 8 452–518 484–485 (#3) 1.0034 0.0005 0.9979 0.0000 9 518–540 528–529 (#4) 0.9998 −0.0005 1.0008 −0.0013 10 540–550 545–546 (#5) 1.0001 0.0003 1.0003 −0.0003 11 550–567 558–559 (#6) 1.0004 0.0004 0.9997 0.0012 569–570 (#7) 0.9960 −0.0119 1.0024 −0.0100 12 567–605 586–587 (#8) 1.0123 0.0064 0.9929 0.0267 589–590 (#9) 0.9568 −0.0109 0.9804 −0.0434 602–603 (#10) 1.0150 0.0167 1.0051 0.0212 13 605–625 615–616 (#11) 1.0004 0.0009 0.9977 0.0033 625–626 (#12) 1.0104 −0.0174 1.0622 −0.0551 14 625–667 644–645 (#13) 1.0072 0.0029 0.9960 0.0154 656–657 (#14) 0.9915 0.0068 0.9698 0.0205 15 667–684 675–676 (#15) 1.0006 0.0007 0.9978 0.0036 685–686 (#16) 1.0473 0.0212 0.9681 0.1036 16 684–704 687–688 (#17) 0.9602 −0.0130 1.0041 −0.0531 694–695 (#18) 0.9828 −0.0153 1.0323 −0.0642 17 704–743 715–716 (#19) 1.0262 0.0121 0.9771 0.0596
whose approach is implemented in several RTMs. This ap-proach was originally designed as a very efficient way to speed up computations of G and its direct component by us-ing 32 specific spectral intervals across the solar spectrum from 240 to 4606 nm. Hereafter, these spectral intervals are abbreviated in KB. This article deals with the assessment of the PAR – irradiance and PPFD – using the irradiance of each KB covering the PAR spectral range in clear sky conditions.
2 Problem statement
The global PAR irradiance PGis mathematically defined as:
PG= 700
Z
400
Gλdλ (2)
where Gλis the global spectral irradiance, λ the wavelength
and the integration is made between 400 and 700 nm. The global PPFD QPis similarly defined as:
QP= 1 hc 700 Z 400 Gλλdλ (3)
where h is the Planck’s constant and c the velocity of light. The direct normal irradiance is the irradiance received on a plane always facing the sun rays with a normal incidence. Let note respectively B, PB, and QPB, the direct normal
broad-band irradiance, the direct normal PAR irradiance, and the direct normal PPFD: PB= 700 Z 400 Bλdλ (4) QPB= 1 hc 700 Z 400 Bλλdλ (5)
where Bλis the direct normal spectral irradiance.
The integral may be replaced by a Riemann sum using very narrow spectral intervals or bands, hereafter abbrevi-ated NB. Here, we chose δ λ = 1 nm, assuming that the op-tical properties of the atmosphere do not change over 1 nm. If λi denotes now the center wavelength of each NB of width
δ λ, it comes: PG= 300 X i=1 Gδλi (6) QP= 1 hc 300 X i=1 Gδλiλi. (7)
Similar equations hold for PBand QPB.
The PAR spectral band [400, 700] nm is covered by 11 KB, from #6 [363, 408] nm to #16 [684, 704] nm (Table 1). Wandji Nyamsi et al. (2014) demonstrated that as a whole the approach of Kato et al. (1999) offer accurate estimates of the spectral irradiance in most of the 32 KB when compared to detailed spectral calculations in clear sky and cloudy con-ditions, and especially for the KB #6 to 16. It follows that the
PAR may be computed by a Riemann sum based on 11 KB instead of 300 NBs. KB #6 and #16 are partly outside the PAR range. One solution is a weighted sum based on the overlap between KBj and the PAR interval. The weight wj
of KBj may be defined as follows:
wj =1, if j is not 6 or 16 w6=(408 − 400)/(408 − 363) = 0.1778 w16=(700 − 684)/(704 − 684) = 0.80 and PG= 16 X j =6 GKBjwj (8) QP= 1 hc 16 X j =6 GKBjwjλKBj (9)
where GKBj is the global irradiance for KBj and λKBj the
center wavelength of KBj. Similar equations hold for PBand
QPB. However, Wandji Nyamsi et al. (2014) reported a
rel-ative root mean square error less than 2 % between detailed spectral calculations and the approach by Kato et al. (1999) for each KB, from #6 to #16. Though small this error may be decreased for the PAR by the technique proposed in this article.
3 Description of the technique
Actually, the bandwidth in several KB is larger than 30 nm and may be considered large for estimating PAR in an accu-rate manner. The concept underlying the proposed technique is to determine several narrower spectral bands NB whose transmissivities are correlated to those of the KB and then use these transmissivities in a linear interpolation process to compute the PAR. This technique is elaborated and validated by the means of the RTM libRadtran (Mayer and Kylling, 2005).
The clearness index KTi and the direct clearness index
KTBi – also called atmospheric transmissivity and direct
at-mospheric transmissivity – are defined as follows:
KTi = Gδλi Eoicos (θs) (10) KTBi= Bδλi Eoi (11)
where θs is the solar zenithal angle; Eoi is the irradiance at
the top of atmosphere on a plane normal to the sun rays for the ith NB. Several solar spectra Eoi have been published.
That of Gueymard (2004) is available in libRadtran and has been used here. By introducing the clearness index in Eqs. (6) and (7), it comes:
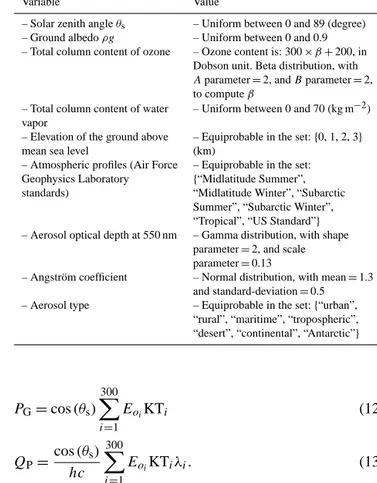
Table 2.Ranges and distributions of values taken by the solar zenith angle, the ground albedo and the 7 variables describing the clear atmosphere.
Variable Value
– Solar zenith angle θs – Uniform between 0 and 89 (degree)
– Ground albedo ρg – Uniform between 0 and 0.9 – Total column content of ozone – Ozone content is: 300 × β + 200, in
Dobson unit. Beta distribution, with Aparameter = 2, and B parameter = 2, to compute β
– Total column content of water – Uniform between 0 and 70 (kg m−2) vapor
– Elevation of the ground above – Equiprobable in the set: {0, 1, 2, 3} mean sea level (km)
– Atmospheric profiles (Air Force – Equiprobable in the set: Geophysics Laboratory {“Midlatitude Summer”, standards) “Midlatitude Winter”, “Subarctic
Summer”, “Subarctic Winter”, “Tropical”, “US Standard”} – Aerosol optical depth at 550 nm – Gamma distribution, with shape
parameter = 2, and scale parameter = 0.13
– Angström coefficient – Normal distribution, with mean = 1.3 and standard-deviation = 0.5 – Aerosol type – Equiprobable in the set: {“urban”,
“rural”, “maritime”, “tropospheric”, “desert”, “continental”, “Antarctic”}
PG=cos (θs) 300 X i=1 EoiKTi (12) QP= cos (θs) hc 300 X i=1 EoiKTiλi. (13)
Similar equations hold for PBand QPB. A set of 60 000 clear
sky atmospheric states is built by the mean of Monte-Carlo technique that will be input to libRadtran. Table 2 reports the nine input variables selected with seven of them describ-ing the clear sky atmosphere: θs, ground albedo, total column
content of water vapor and ozone, the vertical profile of tem-perature, pressure, density, and volume mixing ratio for gases as a function of altitude, the aerosol optical depth at 550 nm, Angström coefficient, and aerosol type, and the elevation of the ground above sea level. The random selection of inputs takes into account the modelled marginal distribution estab-lished from observation proposed by Lefevre et al. (2013) and Oumbe et al. (2011). More precisely, the uniform distri-bution is chosen as a model for marginal probability for all parameters except aerosol optical thickness, Angstrom coef-ficient, and total column content of ozone. The chi-square law for aerosol optical thickness, the normal law for the Angstrom coefficient, and the beta law for total column con-tent of ozone have been selected. The selection of these para-metric probability density functions and their corresponding parameters have been empirically determined from the anal-yses of the observations made in the AERONET network for aerosol properties and from meteorological satellite-based ozone products (Lefevre et al., 2013).
8 W. Wandji Nyamsi et al.: Estimating the photosynthetically active radiation under clear skies
Several plots were made superimposing KTKB and KTi
obtained every nm for the interval [363, 743] nm. A visual inspection of the differences between KTKBand KTi helps
in establishing a set of selected NB, taking into account that the number of these sub-intervals should be as small as pos-sible but still retaining a high accuracy when using a linear interpolation between the sub-intervals to compute the PAR, as explained later. Table 1 reports the 12 KB and the 19 sub-intervals NB. The KB #17 is necessary to obtain NBs en-closing the PAR interval. All KBs contain one NB, except KB #12, 14 and 16, where 4, 3 and 3 NBs were found re-spectively. These bands exhibit strong variations of KTithat
cannot be accounted for with a single NB.
In each selected NB, an affine function is determined by least-square fitting technique:
KTi =aiKTKBj+bi (14)
KTBi=ciKTBKBj+di. (15)
Table 1 also reports the slope and intercept for the global and direct clearness indices for each selected NB. This set of affine functions is established once for all. For any atmo-spheric state, given the twelve values of KTKBj and KTBKBj,
the nineteen KTi and KTBi are computed for each
corre-sponding NB using the affine functions. Then, KT and KTB
are computed for each nm between 400 and 700 nm using a linear interpolation with KTi and KTBi as nodes. Finally,
Eqs. (12)–(13) provide PGand QP. A similar process yields
the direct normal PAR: PBand QPB.
4 Numerical validation
A comparison of the results of the proposed technique against the results from the detailed spectral calculations made by libRadtran considered as a reference is performed to assess the performances of the proposed technique for PG,
QP, PB and QPB. Then, these performances are compared
to those obtained for QP by the methods proposed by
Jaco-vides et al. (2004), Udo and Aro (1999) and the weighted sum (Eq. 9). Another sample of 15 000 atmospheric states has been constructed and used for validation.
4.1 Performance of the proposed technique
Deviations: estimates minus reference, are computed for each state of the validation sample for PG, QP, PB and
QPB. They are synthesized by the bias, the root mean square
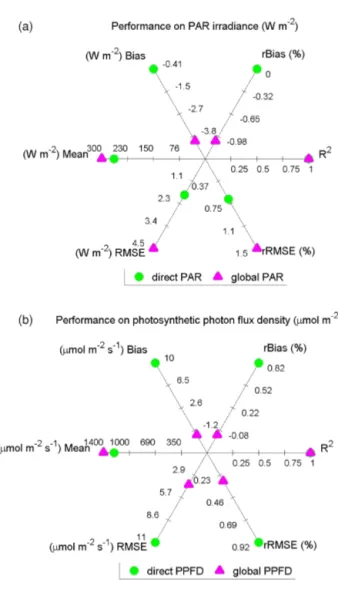
error (RMSE) and the correlation coefficient. The relative bias and RMSE are computed relative to the mean value of the reference. Figure 1 exhibits these statistical param-eters for the global and direct normal PAR irradiance and PPFD. For the direct component, the bias for PAR irradi-ance, respectively PPFD, is −0.4 W m−2, i.e. −0.2 % in rel-ative value, and +10.3 µmol m−2s−1, i.e. +0.8 % in rela-tive value. The RMSE is respecrela-tively 1.8 W m−2(0.7 %) and
Figure 1.Synthesis of the performance of the proposed technique.
11.4 µmol m−2s−1(0.9 %). For the global, the bias for PAR irradiance, respectively PPFD, is −4.0 W m−2, i.e. −1.3 % in relative value, and 1.9 µmol m−2s−1, i.e. −0.1 % in
rela-tive value. The RMSE is respecrela-tively 4.5 W m−2(1.5 %) and
4.0 µmol m−2s−1 (0.3 %). The coefficient of determination
R2is greater than 0.99. These figures prove the good level of performance of the proposed technique.
4.2 Comparison with other methods
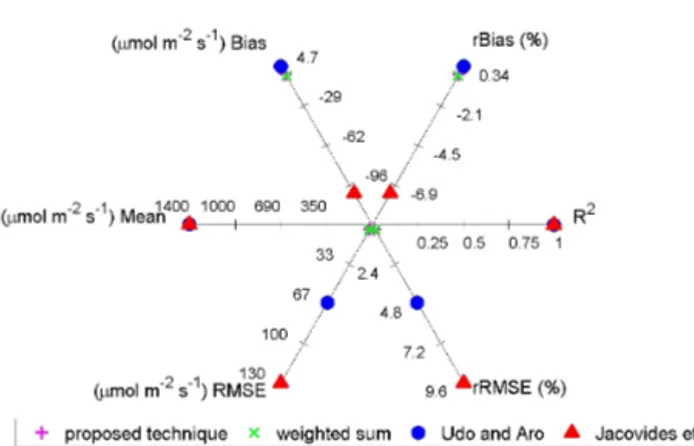
Figure 2 exhibits the statistical indicators for QPobtained by
the methods of Jacovides et al. (2004), Udo and Aro (1999), weighted sum and the proposed technique. The method of Jacovides et al. underestimates the PAR by −7.4 %; the rela-tive RMSE is 9.6 %. The method of Udo and Aro shows bet-ter results with a relative bias of 0.3 % and a relative RMSE of 4.7 %. The weighted sum exhibits very low relative bias:
−0.2 %, and relative RMSE: 0.3 %. The proposed technique shows also a very good agreement with a relative bias of
Figure 2. Performance of different methods: Jacovides et al. (2004); Udo and Aro (1999), weighted sum and the proposed technique.
−0.1 % and relative RMSE of 0.3 % and offers the same re-sults than the weighted sum.
There are two causes for this similarity. The first cause is that all KB contain one δ λi, except KB #12, 14 and 16. For
these bands, variations of KTi with λi are very small. If it
were the case for all KB, from #6 to #17, the proposed tech-nique and the weighted sum would agree and provide similar results. But small discrepancies happen between both tech-niques due to the bands KB #12, 14 and 16, which are sub-divided by respectively 4, 3 and 3 δ λi. However, the
contri-bution of these bands to the PAR outside the atmosphere is only 25 % approximately. As a consequence, these small dis-crepancies have a small influence on the final result. Both the weighted sum and the proposed technique exhibit better per-formances than the empirical method because both take into account the actual atmospheric effects by the means of the Kato et al. approach.
5 Conclusions
The k-distribution method and the correlated-k approxima-tion of Kato et al. (1999) is a computaapproxima-tionally efficient ap-proach originally designed for calculations of the broadband solar radiation at ground level by dividing the solar spec-trum in 32 specific spectral bands from 240 to 4606 nm. This paper describes a technique for an accurate assess-ment of the PAR under clear-sky conditions using the irra-diance estimated in twelve of these spectral bands. The val-idation against numerical simulation exhibits very good per-formances. For the direct and global PAR irradiance, the bias is −0.4 W m−2 (−0.2 %) and −4 W m−2 (−1.3 %) and the RMSE is 1.8 W m−2(0.7 %) and 4.5 W m−2(1.5 %). For the direct and global PPFD, the bias of is +10.3 µmol m−2s−1 (+0.8 %) and 1.9 µmol m−2s−1 (−0.1 %) and the RMSE is 11.4 µmol m−2s−1(0.9 %) and 4.0 µmol m−2s−1(0.3 %). The correlation coefficient is greater than 0.99. It is also
shown that the proposed technique provides better results than two state-of-the-art empirical methods estimating the global PPFD from the global irradiance (Jacovides et al., 2004; Udo and Aro, 1999).
The proposed technique is very useful for the operational estimation of PAR when computational load and great accu-racy in PAR are major issues. In addition, this technique may be extended to be able to accurately estimate other spectral quantities taking into account spectral absorption of photo-synthetic pigments found in plants and algae such as chloro-phyll, carotenoids. The authors are aware of the heuristic way used for selecting the specific NBs for each KB in their work. Other ways are possible. For example, one may think of using the variance between KTKB and all KTi within a
given KB to determine automatically the need for more than one sub-interval. The greater the number of sub-intervals, the higher the accuracy in PAR computation at the expense of a greater number of affine functions.
Acknowledgements. The research leading to these results has received funding from the ADEME, research grant No. 1105C0028. Edited by: S.-E. Gryning
Reviewed by: two anonymous referees
References
Gueymard, C.: The sun’s total and the spectral irradiance for solar energy applications and solar radiations models, Solar Energy, 76, 423–452, 2004.
Jacovides, C. P., Timvios, F. S., Papaioannou, G., Asimakopoulos, D. N., and Theofilou, C. M.: Ratio of PAR to broadband solar radiation measured in Cyprus, Agr. Forest. Meteorol., 121, 135– 140, 2004.
Kato, S., Ackerman, T., Mather, J., and Clothiaux, E.: The k-distribution method and correlated-k approximation for short-wave radiative transfer model, J. Quant. Spectrosc. Ra., 62, 109– 121, 1999.
Lefèvre, M., Oumbe, A., Blanc, P., Espinar, B., Gschwind, B., Qu, Z., Wald, L., Schroedter-Homscheidt, M., Hoyer-Klick, C., Arola, A., Benedetti, A., Kaiser, J. W., and Morcrette, J.-J.: Mc-Clear: a new model estimating downwelling solar radiation at ground level in clear-sky conditions, Atmos. Meas. Tech., 6, 2403–2418, doi:10.5194/amt-6-2403-2013, 2013.
Mayer, B. and Kylling, A.: Technical note: The libRadtran soft-ware package for radiative transfer calculations – description and examples of use, Atmos. Chem. Phys., 5, 1855–1877, doi:10.5194/acp-5-1855-2005, 2005.
McCree, K. J.: Test of current definitions of photosynthetically ac-tive radiation against leaf photosynthesis data, Agric. Meteorol., 10, 443–453, 1972.
Oumbe, A., Blanc, P., Gschwind, B., Lefevre, M., Qu, Z., Schroedter-Homscheidt, M., and Wald, L.: Solar irradiance in clear atmosphere: study of parameterisations of change with alti-tude, Adv. Sci. Res., 6, 199–203, doi:10.5194/ASR-6-199-2011, 2011.
10 W. Wandji Nyamsi et al.: Estimating the photosynthetically active radiation under clear skies
Udo, S. O. and Aro, T. O.: Global PAR related to global solar radia-tion for central Nigeria, Agr. Forest. Meteorol, 97, 21–31, 1999.
Wandji Nyamsi, W., Espinar, B., Blanc, P., and Wald, L.: How close to detailed spectral calculations is the k-distribution method and correlated-k approximation of Kato et al. (1999) in each spectral interval?, Meteorol. Z., 23, 547–556, doi:10.1127/metz/2014/0607, 2014.