Wind tunnel investigations of pollution
dispersion in a scale model of a large area of
the city of Geneva
D. Greco, P. Pontelandolfo, M.N. Nour, R. Putzu
hepia, University of Applied Sciences of Western Switzerland, Geneva
Abstract
Air quality is a growing concern for the health of the global population living in large urban centres. The goal of this paper is to present methods and experiences concerning wind tunnel investigations carried out on a 1:500 scale model of a large neighbourhood of Geneva for a typical wind condition. Gas dispersion phenomena were reproduced in the wind tunnel by a mixture of air and SF6
released from 150 continuous point sources on the model building rooftops. Measurements of the 3D aerodynamic field and pollutant concentration were performed in order to validate a CFD open-source code. This experimental campaign is part of the long-term research project called Clean City and was undertaken at CMEFE laboratory of hepia (Haute Ecole du Paysage, d'Ingénierie et d'Architecture de Genève), University of Applied Sciences of Western Switzerland.
Keywords: wind tunnel measurements, air quality, pollutant dispersion, built environment, air pollution aerodynamics.
1 Introduction
The fact that more and more people live in urban areas results into a densification of cities composed mainly of large buildings on a relatively small surface. The result is a modification of several meteorological aspects such as air temperature, direction and wind speed whose effects materialize in the form of increased heat, enhanced pollution, etc...
Ultimately, it is the "quality of life" of the inhabitants, which is altered in terms of health impact (increase in chronic diseases, hypersensitivity to people
pollutants, fine particles and products, etc…). In this context, urban planners of future cities should incorporate these issues and propose innovative solutions. Nevertheless without tools, these proposals can’t currently rely on solid impact studies on the “urban climate”. This is also a concern of the Swiss National Science Foundation (SNF), which opened two programs “Sustainable Development the built environment” and “New Urban Quality”.
"Clean City" is part of the Smart City thematic and of the two SNF programs insofar its principal objective is to implement a method of modeling and simulating the pollutants dispersion in urban areas. The long term scope of the project is to predict the impact of city planner choices on the "urban climate" concerning the air quality (air pollution and ventilation). To achieve this goal, several Universities of Applied Science of Western Switzerland (HES-SO network) together with the Service of Air Protection (SPAIR) are collaborating to an experimental/numerical campaign focused on a large urbanized area of Geneva. A first series of experimental tests were performed in December 2013 in the wind tunnel of hepia (CMEFE) in order to validate an open source CFD routine based on the OpenFOAM suite.
This ongoing research project involves a multitude of related expertise, such as the capacity of modeling a neighborhood or city from a CAD for CFD using existing data or measures captured using photogrammetric drones; designing an informatics system based on widely distributed open source CFD tools in order to provide the necessary computing power for this type of complex modeling-simulations.
As pointed out by Meroney [1], there are several reasons why a hybrid numerical/experimental approach should be useful for evaluating the validity of dispersion models. In fact where the experimental tests can provide data in situations where the actual physical mixing mechanisms are vague, confused or obscured by other phenomena, computational modeling can provide data at greater spatial resolution than is practicable during fluid dynamics experiments due to instrumentation, time or cost limitations. Wind tunnel and numerical investigations carried out by the Department of Fluid Mechanics of BUTE in 2002 (Goricsán et al. [2], Lajos et al. [3]) proved the reliability of a hybrid approach for predicting pollutant dispersion and ventilation in a large urban environment.
In our investigation, the wind tunnel results of the velocity field and pollutant concentrations at different sampling points will be used to validate the CFD results under the same wind conditions and injection parameters. The pollution sources considered in the present study are the lodgment boilers. The effects of the traffic pollution were not investigated since the aim of the present study is the validation of a CFD code and not the pursuit of the real pollution levels. In particular, the present article will focus on the experimental apparatus design and the results obtained from the first campaign of tests which took place in December 2013. A second experimental campaign is scheduled in March 2014.
1.1 Pâquis neighborhood
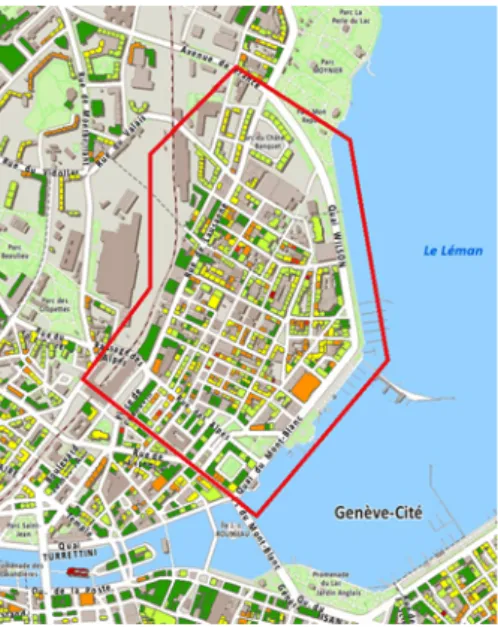
The Pâquis neighborhood is subject to a significant pollution in winter due to fine particles. SPAIR strongly suspect that it is due to wood stoves still frequently used in the old part of the city. After the unexpected results of viability modifications aimed to the reduction of pollution in Rue de Lausanne, the service would like to understand the mechanisms of dispersion of pollutants in the context of a specific area in order to support their improvement proposals based on scientific studies. Those concerns suggested considering the neighborhood of Pâquis as the best candidate to validate a CFD model within the Clean City project. The area of interest is bordered to the north by the railway, on the south by the Lake Geneva, on the west by Rue de Mont Blanc and on the east by Avenue de France.
1.2 Scale model
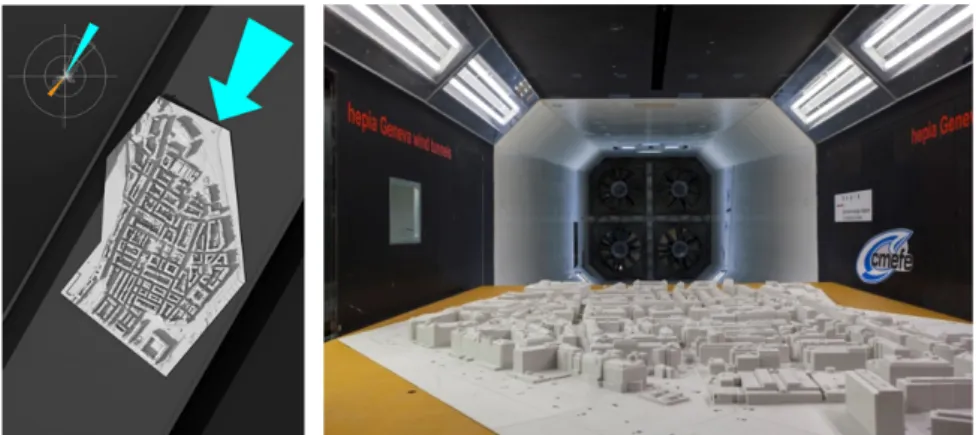
Wind tunnel investigations were carried out on a 1:500 scale model of the entire Pâquis neighbourhood. Since the same geometry will be analyzed with CFD, small details such as trees, hedges, light poles and road signs weren’t modelled. Very small details of the buildings were also removed by post-processing the original CAD data. The model was manufactured at hepia workshop from the original data of the 3D cadastre [8] by means of a Zcorp 450 3D printer supplied with ZP151 high-performance powder and seepage of Zbond90 cyanoacrylate glue. The mockup is composed of 72 sub-models provided with side slots along the perimeter and with one or two flared holes on the flat surfaces for assembly reasons. Each sub-model was disposed on a marine plywood panel and fixed by screws directly in the wind tunnel. The CMEFE wind tunnel is a large circulating facility with a 2 m large and 1.5 m high closed test-section. The model was also provided with 150 holes crossing the buildings from the top to the basement. Each hole was intended to reproduce the gas discharge from a certain number of rooftop stacks varying from building to building.
An analysis on Geneva wind data [9] was necessary to describe a typical wind condition. Typically, the city is mainly exposed on north-east side to an intense and gusty wind called “bise” coming from the lake. Once the dominant direction was determined, the model was ready to be placed in the wind tunnel test section with the correct orientation. The choice of this particular wind condition had the advantage that no further conditions should be imposed on the inlet velocity profile since the upwind field is free from obstacles on the lake side. Due to installation constrains the model was placed in the test section at 350 mm above the floor in a region where the free stream behaves as a constant profile. No boundary layer was reproduced at the inlet since the main goal is the validation of a CFD code and not reproducing reality.
1.3 Pollution data manipulation
In the city of Geneva, the cadastral service “SITG” provides big amount of information on several topics. The most important one for this project was the boilers consumption plan. The Pâquis neighbourhood is a dense urban area hosting a high density of apartments. According to the SITG database, most of them are heated by two kinds of boilers: gas boilers and oil boilers. Moreover, all the buildings don’t have the same age. Therefore some of them are well insulated and others are not. Finally, every urban unit has a specific boiler and it’s possible to know the power and the model’s year. All these heterogeneous data make it difficult to identify a unique pollution parameter to simulate the Pâquis neighbourhood boilers exhausts.
The datum used to unify the boilers consumption data was what the “SITG” calls the IDC: an expenditure heat index expressed in Mega Joules per square meter per year (MJ/m2/year) representing the annual quantity of energy consumed for heat production, reduced to one square meter of heated floor and corrected for climatic data (degree-days) of the year in question. After manipulating the IDC rates, the total fuel consumption per year can be computed for each boiler. All calculation was made for 2010.
The next step was to sum up the consumptions depending on the position of the chimneys with respect to each of the 150 rooftop holes in the model. To simplify the experiment, we considered three classes of pollutant injection, each composed of 50 chimneys, depending on the consumption level of each group of boilers: low, average and high. At this point, the fuel consumption data were averaged for each class and used for reproducing the same pollutant injection distribution during wind tunnel experiment.
2 Pollutant injection apparatus
One of main tasks of Clean City was to build an injection apparatus in order to simulate the boiler’s combustion discharge from the chimneys. A preliminary study aimed at identifying the tracer gas to inject. The best candidate resulted in the Sulphur Hexafluoride (SF6) which is inert, non toxic at small quantities, non
inflammable. Nevertheless, the gas is 5 times heavier than air and it is labelled as greenhouse gas, so it was reasonable to inject a SF6-Air mixture instead of pure
gas. Three different flow rates for groups of 50 chimneys were considered according to the averaged boiler’s consumption data as described in the previous paragraph. The total flow rate of the mixture to inject was computed in order to have a low exit momentum effect from each chimney as pointed out by Li and Meroney [5]. Table 1 resumes the injected flow rates related to each consumption class.
Table 1: Injected Air- SF6 mixture flow rates
Total flow rate Low consumption Average consumption High consumption
40 l/min 4.2 l/min 11 l/min 24.9 l/min
The main goal to be accomplished from our injection set-up was to have a mixture of constant volume ratio equally distributed among each chimney in the model.
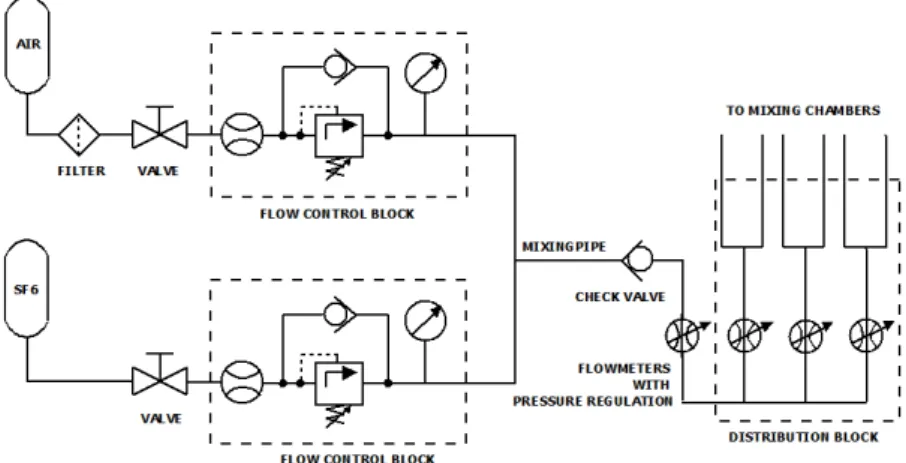
The steadiness of the ratio between the two species was achieved by two flow meters (one per species) with a feedback control on the volume flow rate. A set of three variable area flow meters were used to split to total mixture flow rates according to the values depicted in table 1.
The equal distribution among the chimneys was achieved by means of three couples of identical cylindrical mixing chambers. One couple for each injection flow rate (fig. 3).
The chambers made in PVC are provided with 25 equally spaced radial outlets. A CFD analysis on the chamber internal geometry was carried out to outline the internal recirculation patterns and identifying the axial position of the outlets which guarantees a constant pressure distribution among each hole.
Figure 3: Scheme of the mixture generation and distribution apparatus An important issue to be solved was also to keep the mixture flow rate at the exit of the chimneys independent from small pressure loss differences along the pneumatic lines connecting the chambers to the model and from local pressure conditions in the wind tunnel. Differences in pollutant flow rates respect to the expected values would invalidate a comparison with CFD simulations. To achieve this goal, 150 hypodermic needles of 0.3 mm of internal diameter were axially inserted in the pneumatic lines of each mixing chamber outlets, resulting in a pressure loss sufficiently high to reduce the dependency of the injection flow rates from the outlet conditions.
During the measurements the gas concentrations were revealed at different positions by means of a probe connected to a photo-acoustic gas-analyser (LumaSense INNOVA-1412i). Each chamber was also provided of one supplementary outlet in order to check the homogeneity and the steadiness of the mixture before the tests.
3 Results
3.1 Aerodynamic investigation
The three dimensional aerodynamic field in the test section was investigated by means of an L-shaped seven-hole pressure probe manufactured by Aeroprobe Corporation with a 1/8” (3.18 mm) stem diameter and a conical tip with a half
angle of 30°. The first pressure port is located at the tip of the probe. Magnitude and direction of the velocity were identified by the development of a data reduction algorithm for non-nulling, multihole pressure probe in compressible, subsonic flowfields (Johansen et al. [4]).
Pressure data were acquired at a constant rate of 2 Hz. For each sample at least 20 measurements were necessary to have a confidence level of 95% for the determination of the mean velocity vectors. Velocity profiles were measured on 37 sampling points taken along the principal roads of the neighborhood plus 6 inlet profiles in the free stream upwind the model. All the probe movements were assisted by a robot motioned by three independent motors. All the measurements were referred on the z axis with respect to the lake plane. During the aerodynamic investigation pure air was injected from the chimneys to reduce the environmental impact of the tests. The Reynolds number during our tests was considered to be:
Re=𝑈!"#∙H
ν = 3.3 ∙ 10! (1)
where Uref=10 m/s is the upwind free stream velocity at building roof height
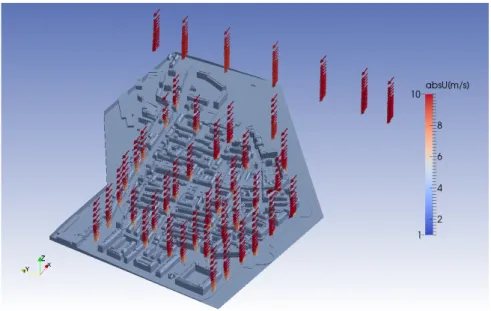
which corresponds to the free stream velocity since we imposed a constant inlet profile, H=0.05 m is the average scaled-building height and ν is the cinematic viscosity. A Reynolds number greater than 104 ensures the similarity of the dispersion processes (Lajos et al. [3]). An overall view of all the aerodynamic measurements is shown in fig. 4.
The inlet profiles result constant along both the vertical and the transversal directions. The presence of the boundary layer introduced by the upstream model is evident for all the other profiles.
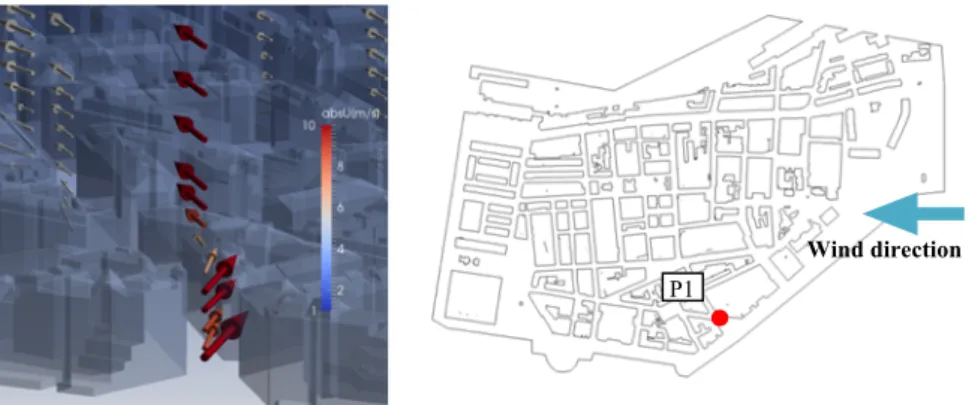
A closer look to the profiles shows the behavior of the flow in proximity of crossroads and buildings. In fig. 5, the free flow encounters two rows of buildings which form a convergent channel, followed by a bifurcation.
In this particular region an increase in the magnitude of the velocity and a strong vertical component along all the building height are observed. This behavior can be explained by the tendency of the flow respectively to accelerate inside the convergent and to pass over the obstacle. A strong lateral deviation can also be observed since the flow is forced to bend towards the lateral channel direction.
Figure 5: Mean vertical velocity profile in a crossroad (P1)
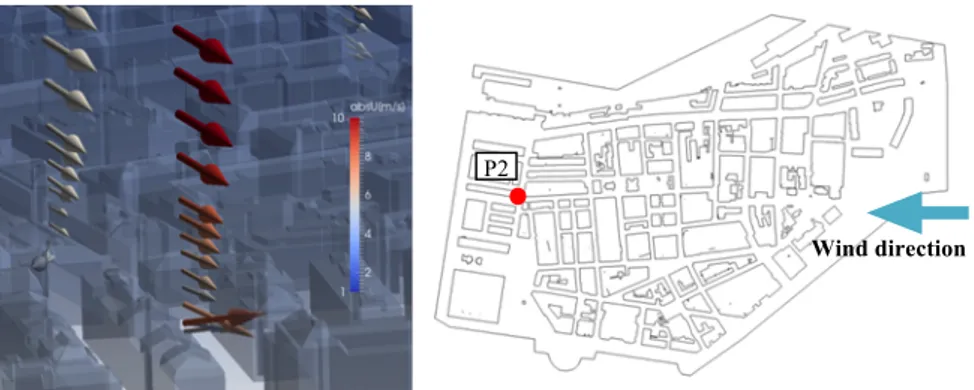
In fig. 6 the velocity profile is depicted for a sampling point in the rear of the model, where the flow is strongly affected by the presence of the model itself. The boundary layer extends up to 4 times the height of the buildings and the mean velocity outside the boundary layer is around 1 m/s higher than the inlet free stream velocity due to the blockage effect of the model and the boundary layer inside the wind tunnel.
The vectors in proximity of the model present some incongruities within the profile which justify a critical interpretation of these results. Vectors close to the ground appear to be averaged on less than 5 instantaneous acquisitions over more than 20 measurements per sampling point. In fact, for most of the data acquired when the probe was placed between the buildings, the velocity calculation algorithm failed the “tip-hole separation test” indicated by Zilliac [6]. This test consisted to compare the pressure at the tip-hole port with the pressure in the separated region: if pressure at tip-hole was lower than the lowest of the peripheral port pressures, the separation criteria were failed and the data point was neglected.
Another important consideration about the accuracy of the measurements must be sought in the interactions between the probe and the ground.
Wind direction
Figure 6: Mean vertical velocity profile in the rear of the model (P2) Pisterman [7] performed analyses of turbulent kinetic energy and of velocity gradient as function of the distance from the wall for a seven-hole probe. His results revealed that large uncertainties in the mean velocity magnitude measured by the probe are to be expected for z less than 9 probe diameters and large uncertainties in the pitch and yaw angles are to be expected for z less than 6 probe diameters. In our case wall effects would be expected up to 19 mm from the ground on velocity angles and up to 29 mm on velocity magnitudes. These two boundaries overlap the range of distances where the most of the data points are neglected by the data reduction algorithm. Further investigations will be undertaken in the next campaign of wind tunnel tests to shed more light on flow field measurements performed by means of a seven-hole probe in wakes and wall proximity.
3.2 Mean pollutant concentration measurements
The first experimental campaign was focused on the description of the aerodynamic field on a large number of sampling points. Nevertheless, a gas injection was performed and a mean concentration vertical profile was measured. The sampling point was chosen in the rear of the model where the boundary layer is well developed and the influence of the model itself on the dispersion phenomena is more evident.
In the study of the mean concentration behavior the general non-dimensional concentration coefficient K was introduced as defined by Li and Meroney [5]:
K=C∙𝐻!∙𝑈!"#
Q (2)
where C is the dimensional tracer species volume fraction [ppm], H=0.05 m is the reference height chosen as the average building height, Uref=10 m/s,
Q=6.67·10-4 m3/s is the total source flow rate. A non-dimensional z/H coordinate
is introduced to represent both concentrations and velocity profiles. Pollutant concentrations were revealed by an L-shaped probe connected to the
gas-Wind direction
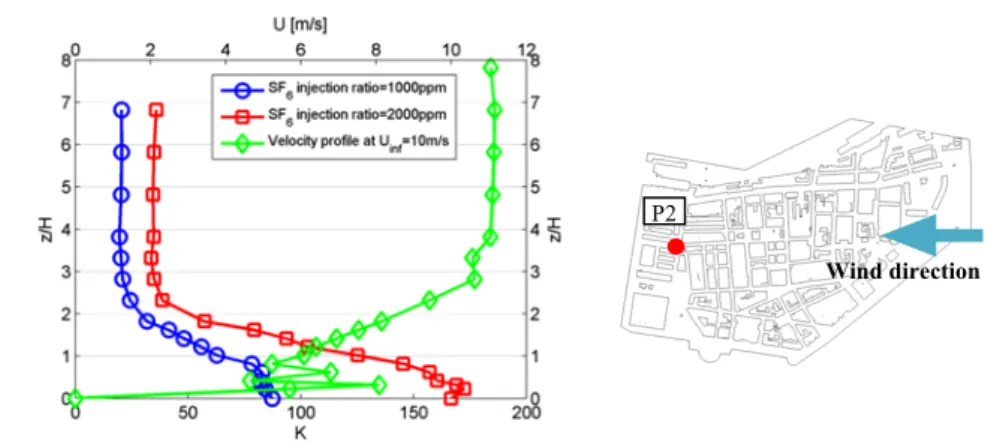
analyzer through a 20 m long pneumatic line. Each concentration value was computed as an average on three different air samples acquired every 30 s. Two different injection conditions were tested by imposing a volume fraction of the tracer gas equal to 1000 ppm and 2000 ppm and Uinf=10 m/s (fig. 7). In
order to show the effect of the wind intensity a comparison was also carried out at Uinf=10 m/s and Uinf=5 m/s by imposing a species volume fraction at 1000
ppm (fig. 8).
Figure 7: Normalized mean gas concentration profiles at different injection ratios compared to the velocity profile (P2)
Figure 8: Normalized mean gas concentration profiles for a injection volume fraction of 1000 ppm at different free stream speeds
For both injection conditions (fig. 7), the mean concentrations of pollutant are almost constant in the free stream and rapidly increase in the boundary layer above the building roof height (z/H=1). Below the roofs level the pollutant concentrations show a slower increase as the street level is approached. The Wind direction
P2
Wind direction
measured concentrations are roughly proportional to the injected volume fraction of the tracer species.
Between the two wind conditions (fig. 8), the concentrations below the roofs level increase up to 30% when the free stream velocity is halved. A higher concentration in the free stream is observed for the highest wind speed: this phenomenon is probably due to the recirculation of the pollutant inside the closed-loop wind tunnel during the exposure time of several minutes between the two sets of experiments.
4 Conclusions
Several Applied Science Universities of Western Switzerland (HES-SO) initiated a long-term research project called Clean City in order to develop tools and methods to assess the impact of architectural and transportation solutions from the pollutant dispersion standpoint. Within this project, a first experimental campaign was undertaken in December 2013 by CMEFE laboratory of hepia (Haute Ecole du Paysage, d'Ingénierie et d'Architecture de Genève) to investigate the air pollution aerodynamics of a large neighborhood of Geneva. Wind tunnel tests were performed in order to validate a CFD code. At this purpose, a 1:500 scale model of the Pâquis neighborhood was manufactured at hepia from the 3D cadastre data provided by SITG [8]. The model was oriented in the wind tunnel in order to replicate a typical wind condition of Geneva called “bise”. Pollutant dispersion phenomena were reproduced by the emission of an air-SF6 mixture at
constant volume ratio of the species from 150 continuous point sources on the model building rooftops. The mixture was supplied at three different flow rates which reproduce three different fuel consumption levels of the boilers installed in each apartment of the neighbourhood.
The 3D aerodynamic field was studied by means of seven-hole Pitot probe while concentration measurements were performed by means of a SF6 gas analyzer.
Velocity profiles at 37 sampling points over the model were measured for a single wind condition with a free stream velocity of 10 m/s. The resulting vectors show (fig. 4) the presence of a boundary layer that extends in rear of the model up to 4 times the average building height. The channel splitting and the upwards deviation of the flow in proximity of a building can be observed on a sampling point taken in the upwind side of the model (fig. 5). Pressure measurements performed by the multi-hole probe in separated regions in the rear of the model (fig. 6) and in proximity of the ground level present a lack of accuracy as discussed by Zilliac [6] and Pisterman [7].
Mean profiles of the non-dimensional concentration coefficient from eqn. (2) were measured at a single point in the rear of the model (P2). SF6 concentrations
rapidly increase inside the boundary layer, roughly proportional to the injected volume fraction of the tracer species (fig. 7). Imposing a species volume fraction of 1000 ppm and the wind tunnel free stream velocity at 5 m/s (fig. 8), concentration measurements show an increase below the roofs top level up to 30%.
The second campaign of experiments scheduled in March 2014 will be carried out to extend the investigation about the pollutant dispersion on several sampling points. Further aerodynamic measurements of the mean velocity field will be also performed to provide more data for the comprehension of the interaction between the flow patterns and the concentration levels in a complex urban area. The development of the CFD code to be validated by comparison with wind tunnel data is still ongoing.
References
[1] Meroney, R. N., Wind tunnel and numerical simulation of pollution
dispersion: a hybrid approach, Working paper, Croucher Advanced Study
Institute on Wind Tunnel Modeling, Hong Kong University of Science and Technology, 2004.
[2] Goricsán, I., Balczó, M., Régert, T., Suda, J.M., Comparison of Wind
Tunnel Measurement and Numerical Simulation of Dispersion of Pollutants in Urban Environment, Proc. of Int. Conference on Urban Wind Engineering
and Building Aerodynamics “Impact of Wind and Storm on City Life and Built Environment”, Von Karman Institute for Fluid Dynamics, Belgium, pp.D.6.1-10, 2004.
[3] Lajos, T., Szepesi, ZS., Goricsán, I., M., Régert, T., Suda, J.M., Balczó, M.,
Wind Tunnel Measurement and Numerical Simulation of Dispersion of Pollutants in Urban Environment, Proc. of Conference on Modelling Fluid
Flow (CMFF’03), Vol 1, pp.507-514, 2003.
[4] Johansen, E.S., Rediniotis, O.K., Jones, G., The compressible calibration of
miniature multi-hole probes, The Asme - J. Fluids Eng. 123(1), pp.128-138,
2001.
[5] Li, W. and Meroney R.M., Gas dispersion near a cubical model building –
Part I. Mean concentration measurement, J. Wind Eng. Ind. Aerodyn. 12,
pp.15-33, 1983.
[6] Zilliac, G.G., Modelling, Calibration, and Error Analysis of Seven Hole
Pressure Probes, Experiments In Fluids, Vol 14, No 1-2, 1993
[7] Pisterman K., Use of a seven-hole pressure probe in highly turbulent
flow-fields, MSc Thesys in Aerospace Engineering, Blacksburg, Virginia, 2004
[8] Système d'information du territoire à Genève (SITG), http://ge.ch/sitg/ [9] Météo Suisse, Weather forecasting and climatology by the Swiss
Meteorological Institute (ISM), http://www.meteosuisse.ch
[10] Office cantonal de l'énergie – OCEN. Département de l'aménagement, du logement et de l'énergie (DALE),
http://ge.ch/energie/media/energie/files/fichiers/documents/degres_jour_glob al_2013_decembre.pdf