464:
Wind quantification in urban environments
Sigrid REITERLEMA, University of Liège, Liège, Belgium
Abstract
There is today a real lack of scientific studies and simple design tools to understand wind flows around buildings. This research is based on a great number of CFD (computational fluid dynamics) simulations carried out with FLUENT software to evaluate wind comfort at pedestrian level. This paper describes first the wind comfort criteria chosen. It then develops the process used for validating FLUENT software for wind studies in dense urban environments by comparing our simulations results with wind tunnel tests. This validation shows that wind mean velocities around buildings can be simulated numerically with a very high degree of accuracy. Based on the results of our simulations, we developed simple graphical tools to quantify critical wind speeds around buildings. This article should thus help in practice architects and town planners to design our built environment. Moreover, this paper shows how numerical modelling is now a high-performance tool to work out useful guidelines and simple design tools for urban planners.
Keywords: CFD simulations, validation, guidelines, graphical tools
1. Introduction
This research studies wind flows in urban environments. Wind is a microclimatic parameter generally neglected by architects, whereas its effects can be critical (reversing people, ...) or on the contrary very beneficial (dispersing air pollution, ...) for pedestrians’ comfort. Today, architects and town planners need design rules to take account of wind in their projects.
This research is based on a great number of CFD (computational fluid dynamics) simulations carried out with FLUENT software to validate this CFD tool and develop simple graphical tools to quantify critical wind speeds around buildings. Wind tunnel tests give wind relevant results and stay a reference in wind engineering for new methods’ validity investigations. Limitation of wind tunnels is such tools scarcity, especially when big enough tunnels are needed for investigations on urban models, and the choice of a limited number of measurement points in the models.
Computational fluid dynamics simulations are being increasingly applied for modelling wind around buildings. They have a huge advantage over wind tunnel tests: they give a quantitative and qualitative wind flow representation of the whole volume simulated and not only in a few specific points related to the presence of measure instruments. Unfortunately, accuracy of the results of these tools must still be proven, especially when working on complex turbulent air flows as we do in the field of wind around buildings. Therefore, it is important to take time to analyze the performance of CFD simulations compared to results of wind tunnel tests in order to assess their scientific validity.
We noted that wind studies of architectural and urban planning are rarely conducted because of the high cost and time investment that CFD simulations and wind tunnel tests require. Moreover, these tools are never used during the
first phase of design, although the decisions taken at this first stage (volumes, implantation) are very important for wind distribution around buildings. There is today a real lack of simple design tools to understand wind flows around buildings. We propose to develop simplified graphical tools, usable during the first phase of design.
2. Wind comfort criteria
A comfort criterion is a combination of a discomfort limit and the maximum probability of discomfort that is acceptable. There are many criteria of comfort in the literature. Here are some criteria widely used in the past [1, 2, 3, 4] and some review studies[5, 6, 7].Some of them use the hourly mean wind speed as the relevant parameter to assess human wind comfort and other ones are based on gust wind speeds or effective wind speeds (integrating the wind speed standard deviation).
The current practice of some famous European wind laboratories has been discussed by a European working group of the Cost Action C14 [7]. Comparing comfort criteria collected by the working group of the COST Action C14 to the criteria used before 1990, this study reveals a significant change occurred in the practice of wind criteria over the last decade. The majority of wind criteria is now based on a fixed hourly mean wind speed. For example, the Building Research Establishment-BRE (England), the FORCE Technology-DMI (Denmark), the Netherlands Organization for Applied Science research- TNO (The Netherlands) and the University of Western Ontario – UWO (Canada) are currently using an hourly mean wind speed criteria to asses wind comfort around buildings [7].
In addition, many cities [8, 9] and some national codes [10] require average wind speeds as limits to be observed in public spaces after the
construction of a new building. Thus, average wind speed is the parameter that CFD simulations have to predict accurately for developing our simplified graphical tools.
Presently research groups are working on formulating a standardized wind comfort criterion based on an hourly mean wind speed. In the meantime, our choice is focused on the criteria chosen by Willemsen and Wisse [10]
.
- For comfort: P (U > 5m/s) < Pmax, where U is the average hourly wind speed at 1.5 m above the ground and Pmax is given in the table 1. Table 1: Pmax acceptable for wind comfort [10].
Pmax (in % hours per year) Wind comfort for strolling Wind comfort for sitting < 2.5 Good Good 2.5-5.0 Good Moderate 5-10 Moderate Poor >10 Poor Poor
- For safety: P (U > 15m/s) < Pmax, where U is the average hourly wind speed at 1.5 m above the ground and Pmax is given in table 2.
Table 2: Pmax acceptable for wind safety [10].
Pmax (in% hours per year) For all activities
0.05-0.3% Limited risk
>0.3 % Dangerous
3. Validation of CFD simulations
CFD simulations should be validated from wind tunnel tests, which give more results for the same configuration than measures on a real site and are also based on the assumption of static boundary conditions.
3.1 Turbulence models
The turbulent flows are characterized by a fluctuating velocity field. In practice, these fluctuations can be very small-scale and high frequency movements. They are therefore impossible to model directly with today's computers. However, the equations of fluid mechanics can be averaged to withdraw the smallest fluctuations, using a modified set of equations that can be solved numerically. These transformed equations include additional variables that have to be resolved by turbulence models. There are two major groups of turbulence models:
• RANS models (Reynolds-averaged Navier-Stokes models)
• LES models (Large Eddy Simulation models).
The equations of the RANS models calculate the transport equations only for the average quantities of the air flow, for which all the turbulence scales are simulated. Among these models, we find the standard k-ε model and its variations as well as differential second-moment closures models (DSM), also known as Reynolds-stress models (RSM).
The LES (Large-eddy simulation) models provide an alternative approach. When the turbulent air movements are wider than one simulation mesh, they are calculated with a time variable solution through a set of equations that filter the smallest eddies. Conceptually, the LES simulations are more desirable than the RANS methods because they solve precisely the large eddy and simulate only the smallest eddies. But, these methods require huge computing power, very tight mesh and long calculation time, especially for wall-bounded flows simulations. In the near future, LES does not seem feasible for computing flow over complex urban situations at realistic Reynolds (Re) and Rayleigh (Ra) numbers with a good accuracy. In a recent article, Hanjalic and Kenjeres are arguing that large-eddy simulation (LES) will not for long be reliable and convenient for large-scale computations [11].
Until now, it is mostly the standard k- ε model and its adaptations that are used in CFD simulations of wind engineering [12]. Unfortunately, we know for a long time that the standard k- ε model is not appropriate for an accurate calculation of airflow around buildings [13].Several adaptations of this model are increasingly used without any verification. It is thus important to test the validity of these adapted k- ε models.
The RSM (Reynolds-stress model) methods were designed to yield better results than their predecessors for many complexities of the flow around buildings, such as stagnation areas, strong pressure gradients, separation flow, curved movements, etc [14, 15]. Differential second-moment closures models (DSM or RSM) seem to offer good performance and could become an alternative for current computational wind engineering [11].
Our validation study of CFD simulations using the FLUENT software focuses on three RANS models: standard k-ε model, k-ε realizable model and Reynolds-stress model (RSM) [16].
3.2 Validation process
We carried out a validation of FLUENT as a tool for simulation of wind around buildings by comparing our simulated results with wind tunnel tests found in the literature for three different building contexts: a single building, the interaction between two buildings and a dense urban area. For several configurations of isolated buildings and small groups of buildings, all turbulence models proposed in FLUENT, converged to the second order, predict well qualitatively the areas of high wind speeds. But, with the standard k-ε and the k-ε realizable models, the position of maximum discomfort was not simulated accurately compared to the wind tunnel measures. The realizable k- ε model still improves quantitatively the discomfort estimation compared to the standard k- ε model. The RSM gave remarkable quantitative results to assess pedestrians wind comfort. It determined accurately the most critical position and the value of maximum mean wind speed. [6]
In this article, we will detail the validation of FLUENT as a tool for wind simulations in dense urban areas because it is the most complex part of this study. The aim is to check FLUENT assessments accuracy in such complex built context. The standard k-ε model was not used in this comparison given its poor performance in the previous study on small groups of buildings. This validation work focuses on wind speed distribution in a dense urban area within a horizontal plane at 2m high. We compared our simulations with wind tunnel tests of Stathopoulos and Wu [17]. These experiments were carried out with an urban wind profile (a = 0.25), which has also been used in our simulations. This validation shows that wind mean velocities around buildings can be simulated numerically with a very high degree of accuracy.
The figure below shows the configuration studied [17].The central building was modeled according to two different heights: the same height as the whole urban fabric (19m) and a height equal to four times the height of surrounding buildings (76m). The streets have a width of 25m. Buildings have an upwind width of 100m and a depth (along the wind) of 50 m.
Fig 1. Simulated configuration for CFD validation
These simulations were conducted with 4 additional blocks upstream of the three blocks studied. This was done in order to define an urban environment as well as to better correspond to wind tunnel tests since Stathopoulos and Wu have also done so in their wind tunnel tests. There is 300m urbanized field (4 buildings + 4 streets) before the urban area analyzed.
The figure below shows the location of measurement points in the wind tunnel tests of Stathopoulos & Wu [17]. So these are the comparison points of our FLUENT simulations with wind tunnel tests.
Fig 2. Distribution of the comparison points of our FLUENT simulations with wind tunnel tests.
The first simulation modeled urban buildings of the same height (19m). The mesh height was 0.5 m from the ground to 40m high. In the horizontal plane, the meshing grid was composed of 2mx2m cells in the area of wind speed analysis. The findings are as follows:
1/ Qualitatively, k- ε realizable model and Reynolds-stress model, converged to the second order, simulate very well the wind protective effect of such a built morphology.
2/ Quantitatively :
The ratio U/Uo is the ratio between the wind speed simulated at 2m high in this built configuration and the wind speed simulated at the same height without the presence of buildings. The ratio U/Uo is representative of the acceleration or deceleration effect of the wind in this urban area.
For the streets exposed to wind, the RSM predicts much better the mean ratio U/Uo than the k-ε realizable model. The average relative error is 27% for the k-ε realizable model and only 8% for the RSM. For the streets sections sheltered from the wind, results given by the k-ε realizable model and the RSM are closer. The average relative error is 18% for the k-ε realizable model and 15% for the RSM. RSM converged to the second order seems the ideal model for simulating wind in dense urban environments with homogeneous buildings heights. Simulations made with all the RSM parameters available in FLUENT software show that results are slightly better with the parameter “wall reflection effects” [16]. But the standard RSM remains a good choice.
It should however be noted that errors of about 40% may appear locally, in specific points of the simulated field. This study allows us to conclude that we must consider such simulations as a tool for predicting average wind speeds in sections of streets or urban areas but not for determining accurate wind speed at a determined point within urban areas.
Same exercise was conducted for this configuration with a high central building. The central building height was equal to 4 times the height of the other buildings: H= 4h with h=19m and H=76m. The mesh height was 0.5m from the ground to 120m high. In the horizontal plane, the meshing grid was composed of 2mx2m cells in the area of wind speed analysis.
The table 3 compares the average values of the ratio U/Uo at 2m high calculated with the measurement results of Stathopoulos & Wu wind tunnel test and our FLUENT simulations for this second comparison.
The quantitative results given by the k-ε realizable model are inadequate. For the standard RSM, the average value across the whole urban area is good, with a relative error of 5% compared with the wind tunnel test. The RSM model with wall reflection effects provides still greater accuracy than the standard model for all sections of streets.
In the FLUENT software, RSM associated with the parameter “wall reflection effects” is specially adapted to assess wind speeds in dense urban
areas including inhomogeneous buildings heights. It gives good results for average wind speeds in each area and across the whole urban context. The relative error between measured values of the wind tunnel test and results of our simulations remains below 20% for all areas studied. For high wind speeds (areas B and C) and for the average wind speed over the whole urban area, this error is limited to 5%.
Table 3: Comparison of average values of the ratio U/Uo at 2m high obtained by wind tunnel test and FLUENT simulations for different streets sections.
Simulation tools Mean U/Uo for A1 to A7 points Mean U/Uo for B1 to B8 points Mean U/Uo for C1 to C7 points Mean U/Uo for the whole urban area FLUENT with k-ε realizable (2d order) 0.43 1.54 1.46 1.05 FLUENT with standard RSM (2d order) 0.3 1.33 1.37 0.85 FLUENT with RSM - « wall reflection effects » (2d order) 0.32 1.25 1.28 0.84 Wind tunnel test 0.37 1.19 1.27 0.8
High wind speeds are well located for both versions of the model RSM but the exact position of the maximum wind speed can be locally displaced. The highest wind speed is predict more accurately with the standard RSM model (error of 5%) than the RSM with wall reflection effects (overstatement of 15%).
Several grids have been tested to limit the size mesh. These tests showed that this mesh size (0.5m high and 2m x 2m large in the control volume) is the minimum necessary to obtain accurate simulation results. However, simulations conducted with horizontal mesh of 1.5m x 1.5m (in place of 2m x 2m) gave even better results, without fundamentally change the previous conclusions.
From this validation, we can recommend the RSM with the parameter wall reflection effects converged to the second order for urban situations with inhomogeneous buildings heights. We proved that a size mesh of 0.5m high applied on a height equal to 1.5 times the height of the highest building gives accurate results at pedestrian level. Our conclusion is that mean wind speeds in dense urban areas can be successfully analyzed using CFD simulations if the best calculation parameters (RSM turbulence model, etc) and a sufficiently fine meshing grid are used.
Architects and town planners do not need to know exactly the wind speed in a specific point to design comfortable public spaces but they need to know the areas protected from wind, those who will be exposed to it and those that will create discomfort for pedestrians. From this viewpoint, CFD simulations are validated to assess wind discomfort risks in urban areas and to help designing comfortable public spaces. This validation is not just about the higher wind speeds but also about wind speeds in protected urban areas, matters of interest to designers in the fields of pollutants dispersion and natural ventilation of buildings.
CFD simulations are today good research tools for developing simplified design tools to support architectural and urban design in relation to the wind.
4. Development of simple design tools
We modelled several urban environments, showing the most probable types of air flows according to each urban fabric. Based on the results of these simulations, we have developed simple graphical tools to quantify critical wind speeds around buildings.
Thanks to Gandemer previous research conducted within a wind tunnel, we knew already the most common types of critical wind flows around buildings [1]. However, in this study and other previous studies conducted within wind tunnels, the quantitative assessment was very simplified. Our research is complementary to these previous works by creating tools based on parametric studies quantifying effects of buildings dimensions on each one of these critical wind effects defined by our predecessors.
The choice to base our simulations and our tools on a quantitative analysis of the wind flow mechanisms rather than a purely geometric assessment reduces the number of simulations needed and teaches basic aerodynamic phenomena through these simplified tools. Tools that we currently have developed with our FLUENT simulations quantify various wind critical effects [6]:
• all critical wind flows around simple isolated buildings (corner effect, shear effect, wind effect in a passage under the building, front vortex, bar effect). • three critical wind flows around little
groups of buildings: Venturi effect, Wise effect, double corner effect.
• three types of wind flows in dense urban areas : urban mask effect, canyon effect and integration of a tall building in a dense urban environment.
These simplified quantitative tools should be considered as a first approach to a very complex phenomenon. Their results give only exact values for the conditions taken as assumptions in our simulations. However, quantitative orders of magnitude predicted by these tools are correct and very useful to be aware of risks that may arise in a specific layout or to compare the
influence of several configurations for the same project during the first phase of design.
If these tools predict important discomfort risks, it is necessary to change the urban project. For more accurate assessment of wind speed in complex urban areas, it is still useful in a second time to specify solutions through CFD simulations or wind tunnel tests of the project.
We are presenting below, as examples, some tools to assess the corner effect at foot of a high building located in two different contexts:
- a high building in an urban zone with a large square (two hundred meters long upstream of the building).
- a high building in a dense urban area whose buildings height is low and uniform.
The ratio U/Uo is the ratio between the wind speed simulated at 1.5m high in these built configurations and the wind speed simulated at the same height without the presence of buildings. The ratio U/Uo is representative of the acceleration or deceleration effect of the wind in these urban areas.
First, simulations were carried out varying the building height H for a constant building length of 48m and a constant building width of 12m, with a wind perpendicular (wind incidence = 0°) to the longer facade, in an urban area preceded by a large square (two hundred meters long upstream of the building).
The graph below shows the maximal ratio U/Uo found at the corner of the building for various buildings heights: H=12m, H=24m, H=36m, H=48m, H=72m, H=96m and H=192m. This graph shows that wind discomfort levels at the corner of a building are growing rapidly with its height. 2,38 1,94 1 1,58 1,68 1,8 2,74 3,3 0 0,5 1 1,5 2 2,5 3 3,5 0 50 100 150 200 H (m) U /U o
Fig 3. Ratio between the average simulated and reference mean wind speeds (U/Uo) at pedestrian level in the front corner zone of a high building located in an urban area preceded by a large square.
By doubling the height of a building from 12m to 24m, we multiply the ratio U/Uo by 1.06 and by quadrupling it the ratio U/Uo is multiplied by 1.23. The height is a crucial element determining pedestrian discomfort at the corners of all buildings which are isolated or located along large open areas.
Some graphs were elaborated for different lengths of buildings. The corner effect is nearly independent of the building length. There is however a very slight increase in discomfort for buildings of great length. By doubling the length of a building from 12m to 24m, we multiply the ratio U/Uo by 1.005 and by quadrupling it the ratio U/Uo is multiplied by 1.01. This very small
influence of the building length means that it can be ignored in evaluating the corner effect during the first stage of a project. Indeed, doubling the height of a building increases much more the wind discomfort levels near the ground than quadrupling its length…
The graph below shows the maximum ratio U/Uo simulated at the corner of a high building (height=H) located in a dense urban zone with small buildings (h = 12m).
Fig 4. Ratio U/Uo at pedestrian level in the front corner zone of a high building (H) located in a dense urban environment of 12m high buildings.
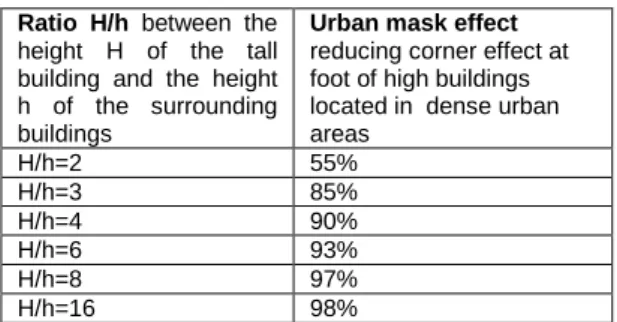
Thanks to simulations conducted on different types of urban environments, we can say that, in the case of a high building surrounded by smaller buildings, the average wind speed at pedestrian level depends essentially on the ratio between the height of the higher building and the average height of the surrounding buildings: H/h. When H/h increases, the ratio U / Uo is also increasing. In the case of a high building in a dense urban environment, the ratio U/Uo should first be quantified with the hypothesis of a large open space around the building (fig.3) and then multiplied with a decreasing factor due to the effect of urban mask (shown in the table below). Table 4: Decreasing factor of the ratio U/Uo according to the ratio H/h for the corner effect of a high building located in a dense urban environment by comparison to a high isolated building.
Ratio H/h between the height H of the tall building and the height h of the surrounding buildings
Urban mask effect reducing corner effect at foot of high buildings located in dense urban areas H/h=2 55% H/h=3 85% H/h=4 90% H/h=6 93% H/h=8 97% H/h=16 98%
These simplified graphical tools for evaluating the average wind speed can predict at an early stage of design project the critical zones in terms of wind pedestrian comfort. Associated with the chosen wind comfort/safety criteria and with probabilities of wind velocities at the nearest meteorological station, these tools give wind comfort probabilities in urban environments. In the future, other types of simplified graphics will be developed, such as representations of spatial average wind speeds in different urban morphologies, useful for assessing buildings
natural ventilation potential or pollutants dispersion in urban areas.
5. Conclusion
Wind flow in complex urban zones is a very complex phenomenon to simulate. Scientific validation of CFD software is therefore necessary.
This article describes first the pedestrians comfort criteria chosen. It then develops the process used for validating FLUENT software for wind studies in urban environments by comparing our simulations results with wind tunnel tests. Simulations results presented in this paper show that CFD simulations are good tools for evaluating critical effects of wind around buildings from the viewpoint of pedestrians comfort. The RSM (Reynolds-stress model) converged to the second order is especially well suited to study wind comfort around buildings. Moreover, the RSM of FLUENT software has been validated qualitatively and quantitatively for assessing mean wind speeds in a dense urban area with uniformly low buildings and in a dense urban area including a high building.
This validation is an important basis for further scientific research in the study field of wind within the built context. The methodology developed in this article may be used in the future to continue this study of wind mechanisms in urban areas or to model more specific or complex configurations with CFD simulations.
Based on the results of our simulations of several urban morphologies, we have developed simple graphical tools to quantify critical wind speeds around buildings. This paper shows some simplified graphical tools developed to assess corner discomfort risks at the foot of a high building located in different urban environments. This article should thus help in practice architects and town planners to design our built environment. Moreover, this paper shows how numerical modelling is now a high-performance tool to work out useful guidelines and simple design tools for urban planners.
6. Acknowledgements
The project has been funded by the Belgian Science Policy and the Brussels-Capital Region. The author greatly acknowledges Professor André De Herde from the “Université catholique de Louvain” – UCL (Belgium) and his research team “Architecture et climat”.
7. References
1. Gandemer J., (1975). Wind environment around buildings : aerodynamic concepts. In : Proceedings of the 4th International Conference on Wind Effects on Buildings and Structures, Heathrow, p. 423-432.
2. Isyumov N., Davenport A.G., The ground level wind environment in built-up areas. In: Proceedings of Fourth Internantional Conference
on Wind Effects on Buildings and Structures. Heathrow, UK: Cambridge University Press, 1975.
3. Lawson T. V., Penwarden A. D., (1975). The effects of wind on people in the vicinity of buildings. In: Proceedings of Fourth International Conference on Wind Effects on Buildings and Structures. Heathrow, UK: Cambridge University Press.
4. Murakami S., Iwasa Y., Morikawa Y., (1986). Study on acceptable criteria for assessing wind environment on ground level based on resident’s diaries. Journal of Wind Engineering and Industrial Aerodynamics, 24: p. 1-18.
5. Bottema M., (2000). A method for optimisation of wind discomfort criteria, Building and Environment 35 : p. 1-18.
6. Reiter S., (2007). Elaborations d’outils méthodologiques et techniques d’aide à la conception d’ambiances urbaines de qualité, pour favoriser le développement durable des villes, unpublished PhD thesis, Université catholique de Louvain, Louvain-la-Neuve, Belgium.
7. Koss H.H., (2006). On differences and similarities of applied wind comfort criteria. Journal of Wind Engineering and Industrial Aerodynamics 94 : p.781-797.
8. Bosselmann P., Dake K., Fountain L., Kraus L., Harris L., Harris A., (1988). Sun, Wind and Comfort: Study of Thermal Comfort in San Francisco. Berkeley: Centre for Environmental Design Research, University of California. 9. Aynsley R.M., (1989). Politics of pedestrian level urban wind control. Building and Environment 24(4): 291-5.
10. Willemsen E., Wisse J.A., (2007). Design for wind comfort in The Netherlands : Procedures, criteria and open research issues. Journal of Wind Engineering and Industrial Aerodynamics 94: p.781-797.
11. Hanjalic K., Kenjeres S., (2008). Some developments in turbulence modeling for wind and environmental engineering. Journal of Wind Engineering and Industrial Aerodynamics, 96: p.1537-1570.
12. Chen Q., (2004). Using computational tools to factor wind into architectural environment design. Energy and Buildings, 36: p.1197-1209.
13. Murakami S., (1998). Overview of turbulence models applied in CWE-1997. Journal of Wind Engineering and Industrial Aerodynamics, 74-76: p. 1-24.
14. Rodi W., (1997). Comparison of LES and RANS calculations of the flow around bluff bodies, Journal of Wind Engineering and Industial Aerodynamics, 69-71 : p.55-75.
15. Kim S-E, Boysan F., (1999). Application of CFD to environmental flows. Journal of Wind Engineering and Industrial Aerodynamics, 81: p.145-158.
16. FLUENT INC., (2008). FLUENT 6.2 User’s guide.
17. Stathopoulos Th., Wu H., (1995). Generic models for pedestrian-level winds in built-up regions, Journal of Wind Engineering and Industrial Aerodynamics, 54-55: p. 515-525.