Journal of Fundamental and Applied Sciences is licensed under aCreative Commons Attribution-NonCommercial 4.0 International License.Libraries Resource Directory. We are listed underResearch Associationscategory.
CLIMATE CHANGE: ASSESSMENT AND MONITORING OF METEOROLOGICAL AND HYDROLOGICAL DROUGHT OF WADI EL HAMMAM BASIN
(NW- ALGERIA).
F. Djellouli*, A. Bouanani and K. Babahamed
Laboratory No. 25, University of Tlemcen, BP119, 13000, Tlemcen, Algeria
Received: 10 June 2016 / Accepted: 30 August 2016 / Published online: 01 September 2016
ABSTRACT
During the last century, Algeria experienced a rainfall deficit was recorded in 1944, then successive drought periods since 1975 to the present day in Northen and Eastern. The most recent has repercussions on water resources and on agriculture. In this paper, we focus on the meteorological and hydrological drought. For describing and monitoring drought severity periods, we used meteorological and hydrological drought indices: Standardized Precipitation Index (SPI), effective Drought Index (EDI) and the standardized Runoff Index (SRI). Data was recording for the period of 30 years at Wadi Louza catchment (NW- Algeria). The best correlation between meteorological drought indices was found for 9-month time step. The results show that severe meteorological identified in March-1983 till the end of August-1984 in Sid Ahmed region and extreme hydrological drought during 1993.
Keywords: Rainfall deficit; EDI; SPI; SRI; Wadi El Hammam.
Author Correspondence, e-mail:fdjellouli@yahoo.com doi:http://dx.doi.org/10.4314/jfas.v8i3.20
1. INTRODUCTION
Drought as an environmental disaster is associated with a deficit of water resources over a large Journal of Fundamental and Applied Sciences
ISSN 1112-9867
Available online at http://www.jfas.info
Research Article
Journal of Fundamental and Applied Sciences is licensed under aCreative Commons Attribution-NonCommercial 4.0 International License.Libraries Resource Directory. We are listed underResearch Associationscategory.
CLIMATE CHANGE: ASSESSMENT AND MONITORING OF METEOROLOGICAL AND HYDROLOGICAL DROUGHT OF WADI EL HAMMAM BASIN
(NW- ALGERIA).
F. Djellouli*, A. Bouanani and K. Babahamed
Laboratory No. 25, University of Tlemcen, BP119, 13000, Tlemcen, Algeria
Received: 10 June 2016 / Accepted: 30 August 2016 / Published online: 01 September 2016
ABSTRACT
During the last century, Algeria experienced a rainfall deficit was recorded in 1944, then successive drought periods since 1975 to the present day in Northen and Eastern. The most recent has repercussions on water resources and on agriculture. In this paper, we focus on the meteorological and hydrological drought. For describing and monitoring drought severity periods, we used meteorological and hydrological drought indices: Standardized Precipitation Index (SPI), effective Drought Index (EDI) and the standardized Runoff Index (SRI). Data was recording for the period of 30 years at Wadi Louza catchment (NW- Algeria). The best correlation between meteorological drought indices was found for 9-month time step. The results show that severe meteorological identified in March-1983 till the end of August-1984 in Sid Ahmed region and extreme hydrological drought during 1993.
Keywords: Rainfall deficit; EDI; SPI; SRI; Wadi El Hammam.
Author Correspondence, e-mail:fdjellouli@yahoo.com doi:http://dx.doi.org/10.4314/jfas.v8i3.20
1. INTRODUCTION
Drought as an environmental disaster is associated with a deficit of water resources over a large Journal of Fundamental and Applied Sciences
ISSN 1112-9867
Available online at http://www.jfas.info
geographical area, which extends for a significant period of time [9]. According to statistics, It is estimated that 35 countries will be facing severe water shortage by the year 2020 [24]. Drought severity is expected to increase further in the next 50 years [20].
The decrease of precipitation is the principal cause of the origin of drought. This results in a reduction of storage volumes and fluxes involved in the hydrological cycle. Depending on the choice of variables of interest, drought is often classified into four types: meteorological, hydrological, agricultural, and socio-economical droughts [21, 23, 6]. Nowadays, more than 150 different drought indicators have been developed, in use and tested for various geographical, climatic and hydrology conditions [22].
Over the years, Many drought indices have been proposed for drought characterization, Palmer Drought Severity Index (PDSI) [1], Deciles [2], Crop Moisture Index (CMI) [3], Bhalmeand Mooley Drought Index (BMDI) [4], Surface Water Supply Index (SWSI) [5], Standardized Precipitation Index (SPI) [7], Effective Drought Index (EDI) [8], Soil Moisture Deficit Index (SMDI) [12], Reconnaissance Drought Index (RDI) [17], standardized runoff index (SRI) [18]; which has gained world popularity. Most of these indices are calculated using more hydro-meteorological variables (precipitation, temperature, soil water, streamflow, groundwater, potential evapotranspiration...Etc) [19].
In the present study, our interest to examine the applicability of various drought indices in Wadi Louza, a small watershed in Wadi El Hammam Basin (NW-Algeria). We used three indexes SPI, EDI and SRI. SPI has been the most frequently used index, utilizes a simple average of precipitation for each concerned period. The SPI provides drought severity over various time frames, may be computed with different time steps (e.g. 1 month, 3 months, 12 months). The water resources generated by rainfall may have already been lost due to outflow and evaporation can not take into consideration by SPI. But, the EDI is able to represent the gradual development of droughts, it was found to be better than SPI [14].
However, almost all the drought indices utilize precipitation either individually or in combination with other variables. By reason of the lag-effect between meteorological and hydrological drought, the Standardized Runoff Index (SRI) was reconstructed in the Wadi Louza basin. The stream flow is an essential input for hydrological drought indices. The SRI
F. Djellouli et al. J Fundam Appl Sci. 2016, 8(3), 1037-1053 1039
index was calculated to analyze the hydrological drought evolution in prone area. It was integrated hydrologic processes that determine seasonal lags in the influence of climate on stream flow.
2. METHOD AND MATERIAL 2.1 Study area
The Wadi Louza catchment is situated within the Wadi El Hammam basin north west of Algeria, between north latitudes of 34.68°- 35.03° and the west longitudes of 0.70°- 0.37°, with an area of 746km2. The main watercourse originates at an altitude of 1455m on the fallout of mountain Mezioud. The total length of the rivers is about 39.51km, and main tributaries are Telzaa river, Telagh river, Neksifia river, Teghalimet river, then Louza river with elevations ranging from 580m to 1460m (the average elevation is 855m). Its climate is classified as semi-arid, with a mean precipitation of 286 mm/year (1978-2008) (Figure 1)
Fig.1. Situation of Wadi Louza watershed
F. Djellouli et al. J Fundam Appl Sci. 2016, 8(3), 1037-1053 1039
index was calculated to analyze the hydrological drought evolution in prone area. It was integrated hydrologic processes that determine seasonal lags in the influence of climate on stream flow.
2. METHOD AND MATERIAL 2.1 Study area
The Wadi Louza catchment is situated within the Wadi El Hammam basin north west of Algeria, between north latitudes of 34.68°- 35.03° and the west longitudes of 0.70°- 0.37°, with an area of 746km2. The main watercourse originates at an altitude of 1455m on the fallout of mountain Mezioud. The total length of the rivers is about 39.51km, and main tributaries are Telzaa river, Telagh river, Neksifia river, Teghalimet river, then Louza river with elevations ranging from 580m to 1460m (the average elevation is 855m). Its climate is classified as semi-arid, with a mean precipitation of 286 mm/year (1978-2008) (Figure 1)
2.2. Data used
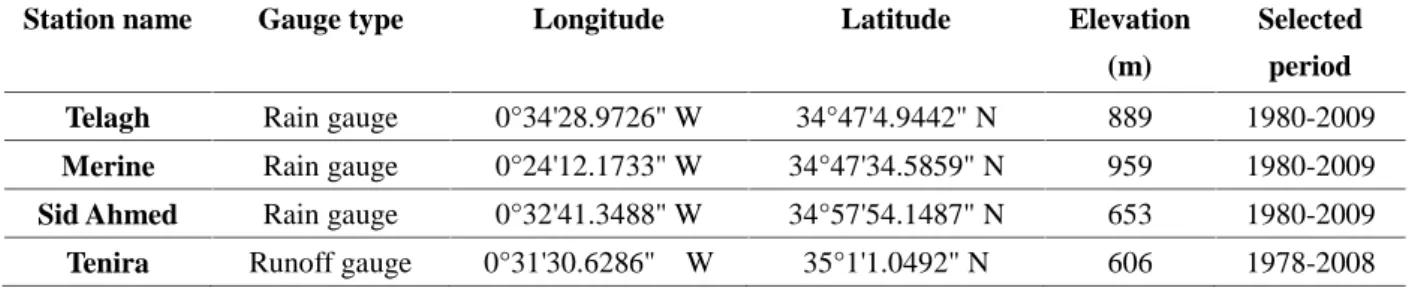
In this research, three rainfall stations (Telagh, Merine, Sid Ahmed) and one runoff station (Tenira) are selected (Figure 2). Characteristics and locations of these stations are shown in (Table 1). The stations have sufficient data and are operated by National Agency of Hydric Resources (NAHR).
Table 1. Characteristics of rainfall and runoff stations in Wadi Louza Basin
Station name Gauge type Longitude Latitude Elevation
(m)
Selected period Telagh Rain gauge 0°34'28.9726" W 34°47'4.9442" N 889 1980-2009 Merine Rain gauge 0°24'12.1733" W 34°47'34.5859" N 959 1980-2009 Sid Ahmed Rain gauge 0°32'41.3488" W 34°57'54.1487" N 653 1980-2009 Tenira Runoff gauge 0°31'30.6286" W 35°1'1.0492" N 606 1978-2008
Fig.2. Location of rainfall and runoff stations in Wadi Louza Basin
2.3. Methods
The main objective of this paper consists of testing the suitability of several meteorological drought indices to estimate the impacts of climate change on the water cycle of a small catchment. Three drought indices have been chosen for this research. The standard
F. Djellouli et al. J Fundam Appl Sci. 2016, 8(3), 1037-1053 1041
precipitation index (SPI), the effective drought index (EDI) and standardized runoff index (SRI). A common feature of the indices selected lies in the fact that they all are computed using rainfall and runoff monthly data, record for the 30 year period.
2.3.1 Drought indices
Standardized Precipitation Index (SPI): Is among the most widely used indexes, It is utilized to detect dry periods and evaluate their intensity. SPI is developed by [7] for identifying, monitor drought events and determine drought duration and severity of multiple time steps (e.g. 1 month, 3 months, 12 months) by using monthly rainfall data. A long-term precipitation record is necessary to calculate the SPI at the selected station, is first fitted to a probability distribution (e.g. Gamma distribution), which is then transformed into a normal distribution, so that the mean SPI is zero. Positive SPI values indicate greater than mean precipitation and negative values indicate less than mean precipitation. However, the objective choice on the best time step may depend on the purpose of drought analysis. SPI values reflect the effects of drought on water resources components (groundwater, reservoir storage, soil moisture, streamflow). Drought periods are characterized by relatively high negative deviations. A drought event starts when the SPI value reaches negative value and ends when SPI becomes positive again (Table 2). The calculation for SPI is given with under equation (1);
SPI = ,
(1) Where, x is the seasonal precipitation at the ithrain gauge and jthobservation, x: the long-term seasonal mean and : standard deviation
SPI: Standardized Precipitation Index
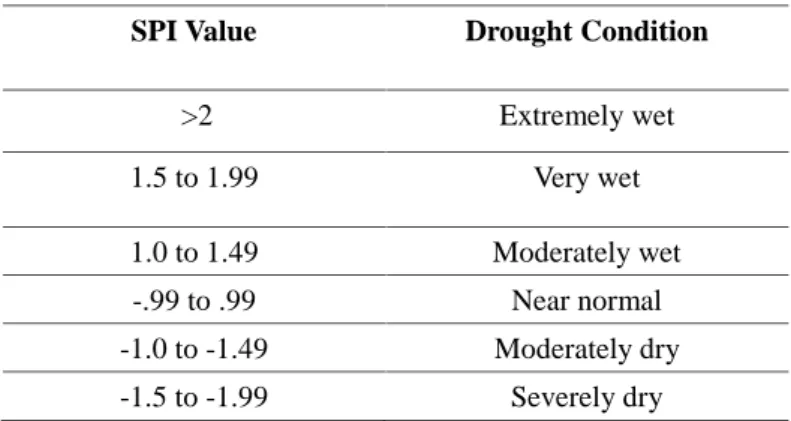
Table 2. Classification of SPI Values
SPI Value Drought Condition
>2 Extremely wet 1.5 to 1.99 Very wet 1.0 to 1.49 Moderately wet -.99 to .99 Near normal -1.0 to -1.49 Moderately dry -1.5 to -1.99 Severely dry
Effective drought index (EDI): Disability of SPI to offer the information required for drought duration, start and end of the drought period. To amend these disadvantages, [8] proposed Effective Drought Index (EDI), in its original form is computed with a daily time step using daily rainfall data. [10, 13, 15] have verified the merits of EDI in precipitation climatology, and their merits on drought monitoring have recognized by [11]. Effective precipitation (EP) that represents resources daily depletion of water is the base of concept EDI [14]. For detail explanations can be seen in [8]. EDI application with monthly data is avaible to be tested; his algorithm is modified by [16].
The succeeding equations were used for the EDI calculations
= ∑ [(∑ )/ ] ( 2)
EPi: Effective precipitation
Pm: precipitation of m days before, i : Dry duration+ 365
= − (3)
DEP: the deficiency or surplus of water resources for a particular date and place MEP: the mean EP
= / ( ) (4)
SD: the standard deviation
The drought range of the EDI, Similar to the SPI, varies from −2.0 to 2.0, indicates extreme drought (EDI ≤ -2), severe drought at (-2≤EDI≤-1.5), moderate drought (-1.5≤EDI≤-1.0) and near normal conditions are indicated by (-1.0≤EDI≤1.0).
The Standardized Runoff Index: The Standardized Runoff Index (SRI) is an internationally recognized and widely used index, was developed by[18]. SRI similar and utile complement to SPI, for
F. Djellouli et al. J Fundam Appl Sci. 2016, 8(3), 1037-1053 1043
aims to describe hydrology drought, employs the algorithm of standardized index (SI). It’s capable to
define seasonal variations in the influence of climate on runoff.
Calculation of the SRI requires a probability density function (a Gamma distribution), a monthly runoff for a gauge station is necessary to compute frequency distribution. The function is used to evaluate the cumulative probability for a specific month and temporal scale, then, transformed to the standardized normal distribution with mean zero and variance one, which results in the value of the SRI. This index has the exact same classification of wet and drought period of SPI.
3. RESULTS AND DISCUSSIONS
3.1 Correlation analysis between SPI and EDI
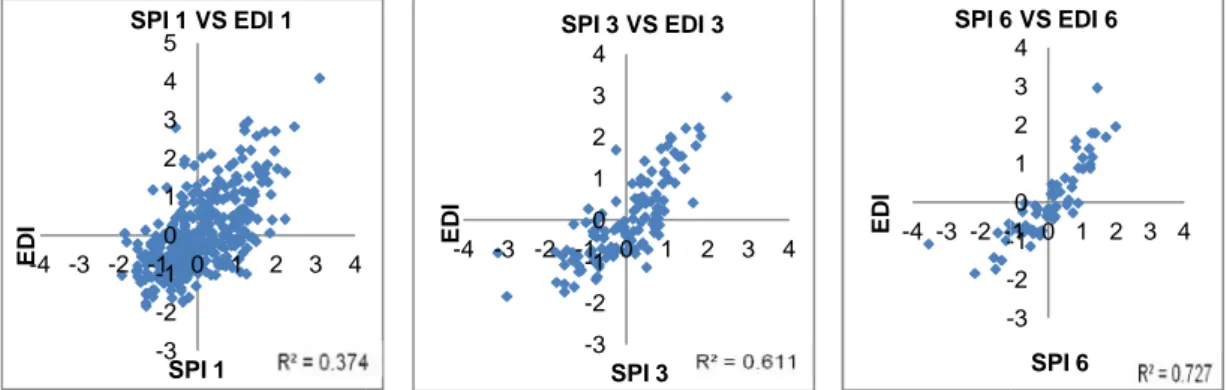
Figure 3 was prepared to assess how exactly the SPIs and EDIs indices measured drought, the scatter diagram of SPI1 and EDI is very scattered and more tighted for SPI9 and EDI.
Fig.3. Scatter diagram for the SPIs and EDIs for the Telagh station from 1980 to 2009 -3 -2 -1 0 1 2 3 4 5 -4 -3 -2 -1 0ED 1 2 3 4 I SPI 1 SPI 1 VS EDI 1 -3 -2 -1 0 1 2 3 4 -3 -2 -1 E D I SPI 9 vs EDI 9
F. Djellouli et al. J Fundam Appl Sci. 2016, 8(3), 1037-1053 1043
aims to describe hydrology drought, employs the algorithm of standardized index (SI). It’s capable to
define seasonal variations in the influence of climate on runoff.
Calculation of the SRI requires a probability density function (a Gamma distribution), a monthly runoff for a gauge station is necessary to compute frequency distribution. The function is used to evaluate the cumulative probability for a specific month and temporal scale, then, transformed to the standardized normal distribution with mean zero and variance one, which results in the value of the SRI. This index has the exact same classification of wet and drought period of SPI.
3. RESULTS AND DISCUSSIONS
3.1 Correlation analysis between SPI and EDI
Figure 3 was prepared to assess how exactly the SPIs and EDIs indices measured drought, the scatter diagram of SPI1 and EDI is very scattered and more tighted for SPI9 and EDI.
Fig.3. Scatter diagram for the SPIs and EDIs for the Telagh station from 1980 to 2009 4 -3 -2 -1 0 1 2 3 4 -4 -3 -2 -1E 0 1 2 3 4 D I SPI 3 SPI 3 VS EDI 3 -3 -2 -1 0 1 2 3 4 -4 -3 -2 -1 E D I SPI 6 VS EDI 6 -3 -2 -1 0 1 2 3 4 -1 0 1 2 3 SPI 9 SPI 9 vs EDI 9 -3 -2 -1 0 1 2 3 4 -3 -2 -1 0 1 2 3 E D I SPI 12 SPI 12 vs EDI 12
F. Djellouli et al. J Fundam Appl Sci. 2016, 8(3), 1037-1053 1043
aims to describe hydrology drought, employs the algorithm of standardized index (SI). It’s capable to
define seasonal variations in the influence of climate on runoff.
Calculation of the SRI requires a probability density function (a Gamma distribution), a monthly runoff for a gauge station is necessary to compute frequency distribution. The function is used to evaluate the cumulative probability for a specific month and temporal scale, then, transformed to the standardized normal distribution with mean zero and variance one, which results in the value of the SRI. This index has the exact same classification of wet and drought period of SPI.
3. RESULTS AND DISCUSSIONS
3.1 Correlation analysis between SPI and EDI
Figure 3 was prepared to assess how exactly the SPIs and EDIs indices measured drought, the scatter diagram of SPI1 and EDI is very scattered and more tighted for SPI9 and EDI.
Fig.3. Scatter diagram for the SPIs and EDIs for the Telagh station from 1980 to 2009 -3 -2 -1 0 1 2 3 4 -1 0 1 2 3 4 SPI 6 SPI 6 VS EDI 6 3
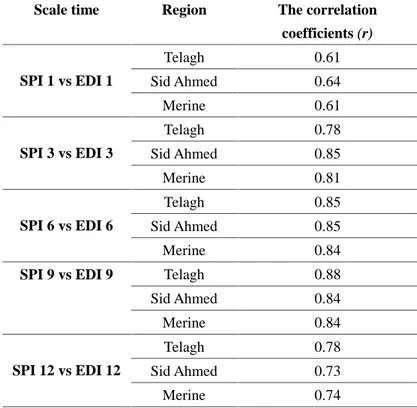
The maximum value of (r) between SPI and EDI was obtained for 9-month time scale and the minimum value for 1-month time scale in all areas (Table 3). In time scale 3, 6 and 12 months in all stations, correlation coefficient (r) is more than 0.73
Table 3. Correlation coefficient (r) between SPI and EDI index in different time scales
Scale time Region The correlation
coefficients (r) SPI 1 vs EDI 1 Telagh 0.61 Sid Ahmed 0.64 Merine 0.61 SPI 3 vs EDI 3 Telagh 0.78 Sid Ahmed 0.85 Merine 0.81 SPI 6 vs EDI 6 Telagh 0.85 Sid Ahmed 0.85 Merine 0.84
SPI 9 vs EDI 9 Telagh 0.88
Sid Ahmed 0.84 Merine 0.84 SPI 12 vs EDI 12 Telagh 0.78 Sid Ahmed 0.73 Merine 0.74
3.2 Assessment of drought characteristics 3.2.1 Meteorological drought
Drought is characterized by their severity and their duration. The drought months are
identified using the SPIs and EDIs indices during the period 1980-2009 in Wadi Louza Basin
For Short-term drought: The results showed that the Merine district has the maximums drought months, for SPI1 (51 months), SPI 3 (63 months). However, EDIs result showed Sid Ahmed district is the major. The number of drought months grew with the increase of time step for SPI, but, for EDI decrease (Table 4-1)
Table 4-1. Drought monitoring with SPIs and EDIs index for Short-term in Wadi Louza watershed
F. Djellouli et al. J Fundam Appl Sci. 2016, 8(3), 1037-1053 1045
Station SPI 1/EDI1 SPI 3/EDI3
Drought months Drought events Maximum duration of drought (months) Drought months Drought events Maximum duration of drought (months) Telagh 35/41 26/12 03 /09 51/42 13/08 12 /12 Sid Ahmed 38/ 59 31/15 03 / 11 60/57 16/10 09/12 Merine 51/44 35/18 04 /08 63/48 17/11 09/09
The analysis indicated that the maximum duration of a drought event varies for each station. For the time scale of 1 month, the maximum duration observed, detected by EDI, in Sid Ahmed area. This region has faced of a moderate drought event, began in April-1988 and has finished in February-1989, however, SPI indicated just December 1988 was the extreme drought month, followed, by a very severe drought duration in Merine district, of 9 months, started at December-1999. November 1981 and March 1997 were identified as the most severe droughts months by all indices in all regions during the period of 30 years from 1980 to 2009 (Figure 4).
Fig.4. Comparison of the SPIs1 & EDIs1 for Merine and Sid Ahmed stations with a one month time step during period 1981 to 1989
SPIs 3 and EDIs 3 have indicated nearly the same event, have combined of moderate and -3.0 -2.0 -1.0 0.0 1.0 2.0 3.0 01/ 06/ 1981 01/ 09/ 1981 01/ 12/ 1981 01/ 03/ 1982 01/ 06/ 1982 01/ 09/ 1982 01/ 12/ 1982 01/ 03/ 1983 01/ 06/ 1983 01/ 09/ 1983 01/ 12/ 1983 01/ 03/ 1984 01/ 06/ 1984 01/ 09/ 1984 01/ 12/ 1984 01/ 03/ 1985 01/ 06/ 1985 01/ 09/ 1985 01/ 12/ 1985 01/ 03/ 1986 01/ 06/ 1986 01/ 09/ 1986 01/ 12/ 1986 01/ 03/ 1987 01/ 06/ 1987 01/ 09/ 1987 01/ 12/ 1987 01/ 03/ 1988 01/ 06/ 1988 01/ 09/ 1988 01/ 12/ 1988 01/ 03/ 1989 SP Is 1 & E DI s 1 TIME
SPI1 Sid Ahmed EDI1 Sid Ahmed SPI1 Merine EDI 1 Merine
severe drought, between May-1983 to November-1983 in Merine and Sid Ahmed areas (Figure 5), The maximum duration of drought was 12 months continuous, estimated using SPI, started in December-1982 and dissipated in November-1983 at Sid Ahmed district. Also, the period (September-1981 to November 1981) identified by both indices as extreme drought in all areas
Fig.5. Comparison of the SPIs 3 & EDIs3 for Merine and Sid Ahmed station with a 3 month time scale
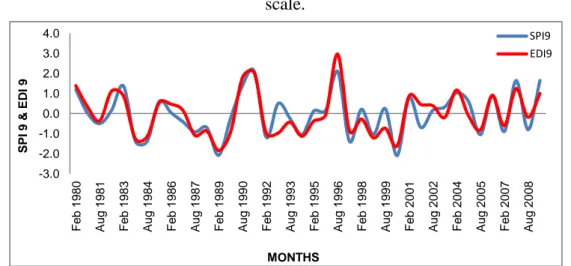
For average and long - term drought: For 9 month time steps, in all stations of Basin, SPIs 9 and EDIs 9 continued to define the combination of equal dry period and almost the similar severity (Figure 6(a)), (Figure 6(b)) and (Figure 6(c)).
Fig.6(a). Comparison of the SPI 9 & EDI9 values for Sid Ahmed station with a 9 month time -3.0 -2.0 -1.0 0.0 1.0 2.0 3.0 4.0 F e b 1 9 8 0 F e b 1 9 8 1 F e b 1 9 8 2 F e b 1 9 8 3 F e b 1 9 8 4 F e b 1 9 8 5 F e b 1 9 8 6 F e b 1 9 8 7 F e b 1 9 8 8 F e b 1 9 8 9 F e b 1 9 9 0 F e b 1 9 9 1 F e b 1 9 9 2 F e b 1 9 9 3 F e b 1 9 9 4 F e b 1 9 9 5 F e b 1 9 9 6 F e b 1 9 9 7 F e b 1 9 9 8 F e b 1 9 9 9 F e b 2 0 0 0 F e b 2 0 0 1 F e b 2 0 0 2 F e b 2 0 0 3 F e b 2 0 0 4 F e b 2 0 0 5 F e b 2 0 0 6 F e b 2 0 0 7 F e b 2 0 0 8 F e b 2 0 0 9 S P Is 3 & E D Is 3 MONTHS
SPI3 Sid Ahmed EDI3 Sid Ahmed SPI3 Merine EDI3 Merine -3.0 -2.0 -1.0 0.0 1.0 2.0 3.0 F e b 1 9 8 0 A u g 1 9 8 1 F e b 1 9 8 3 A u g 1 9 8 4 F e b 1 9 8 6 A u g 1 9 8 7 F e b 1 9 8 9 A u g 1 9 9 0 F e b 1 9 9 2 A u g 1 9 9 3 F e b 1 9 9 5 A u g 1 9 9 6 F e b 1 9 9 8 A u g 1 9 9 9 F e b 2 0 0 1 A u g 2 0 0 2 F e b 2 0 0 4 A u g 2 0 0 5 F e b 2 0 0 7 A u g 2 0 0 8 S P I 9 & E D I 9 MONTHS SPI9 EDI9
F. Djellouli et al. J Fundam Appl Sci. 2016, 8(3), 1037-1053 1047
scale.
Fig.6(b). Comparison of the SPI9 & EDI9 values for Telagh station with a 9 month time scale.
Fig. 6(c). Comparison of the SPI9 & EDI9 values for Merine station with a 9 month time scale.
The maximum duration of severe drought has identified in March-1983 till the end of August-1984 in Sid Ahmed region (Table 4-2).
Table 4-2: Drought monitoring with SPIs and EDIs index for average and long - term in Wadi Louza watershed
Station SPI 9/EDI9 SPI 12/EDI12
Drought months Drought events Maximum duration of drought (months) Drought months Drought events Maximum duration of drought (months) Telagh 81/63 09/07 18/18 36/36 03/03 12/12 Sid Ahmed 81/72 09/08 18/18 60/60 05/05 12/24 -3.0 -2.0 -1.0 0.0 1.0 2.0 3.0 4.0 F e b 1 9 8 0 A u g 1 9 8 1 F e b 1 9 8 3 A u g 1 9 8 4 F e b 1 9 8 6 A u g 1 9 8 7 F e b 1 9 8 9 A u g 1 9 9 0 F e b 1 9 9 2 A u g 1 9 9 3 F e b 1 9 9 5 A u g 1 9 9 6 F e b 1 9 9 8 A u g 1 9 9 9 F e b 2 0 0 1 A u g 2 0 0 2 F e b 2 0 0 4 A u g 2 0 0 5 F e b 2 0 0 7 A u g 2 0 0 8 S P I 9 & E D I 9 MONTHS SPI9 EDI9 -3.0 -2.0 -1.0 0.0 1.0 2.0 3.0 4.0 F e b 1 9 8 0 A u g 1 9 8 1 F e b 1 9 8 3 A u g 1 9 8 4 F e b 1 9 8 6 A u g 1 9 8 7 F e b 1 9 8 9 A u g 1 9 9 0 F e b 1 9 9 2 A u g 1 9 9 3 F e b 1 9 9 5 A u g 1 9 9 6 F e b 1 9 9 8 A u g 1 9 9 9 F e b 2 0 0 1 A u g 2 0 0 2 F e b 2 0 0 4 A u g 2 0 0 5 F e b 2 0 0 7 A u g 2 0 0 8 S P I 9 & E D I 9 MONTHS SPI9 EDI9
Merine 81/63 09/07 09/09 60/24 05/02 12/12
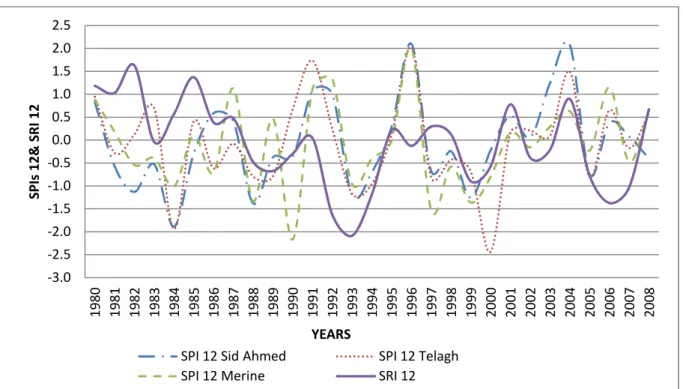
For 12 month time scales, EDIs 12 and SPIs12 have indicated 1984 was the driest year in Wadi Louza Basin during the study period, the year 2000 identified it as an extreme drought than others in Telagh region (Figure 7).
Fig.7. SPIs 12 & EDIs12 values for selected stations with a 12 month time scale.
3.2.2 Hydrological drought:
Analysis of hydrological drought was done using the SRI, Figure 7 shows the SRI values (1,3,9 and 12 months) from 1978 to 2008 calculated from observed runoff at Tenira station, the computed SRI clearly identifies the severe hydrological drought, this severity is incremented with increase of time scale. The Moderate hydrological drought is observed in 3 month time scales, the severe drought is identified at 6 time steps and the extreme of 9 and 12 months. Year 1993 is described as the driest for all time steps.
-3.0 -2.0 -1.0 0.0 1.0 2.0 3.0 4.0 1980 1981 1982 1983 1984 1985 1986 1987 1988 1989 1990 1991 1992 1993 1994 1995 1996 1997 1998 1999 2000 2001 2002 2003 2004 2005 2006 2007 2008 2009 SP Is 12 & E Ds I12 YEARS
SPI12 Sid Ahmed EDI12 Sid Ahmed SPI12 Telagh
F. Djellouli et al. J Fundam Appl Sci. 2016, 8(3), 1037-1053 1049
Fig.8. The SRI values for observed stream flow in Wadi Louza basin at the different time scale: a) SRI 1, b) SRI 3, c) SRI 9, d )SRI 12.
-1 0 1 2 3 S e p 1 9 7 8 A u g 1 9 7 9 J u l 1 9 8 0 J u n 1 9 8 1 M a y 1 9 8 2 A v r 1 9 8 3 M a r 1 9 8 4 S T A N D A R D IZ E D R U N O F F IN D E X -1.5 -0.5 0.5 1.5 2.5 N o v 1 9 7 8 N o v 1 9 7 9 N o v 1 9 8 0 N o v 1 9 8 1 N o v 1 9 8 2 N o v 1 9 8 3 S T A N D A R D IZ E D R U N O F F IN D E X -3 -2 -1 0 1 2 3 M a y 1 9 7 9 N o v 1 9 8 0 M a y 1 9 8 2 N o v 1 9 8 3 S T A N D A R D IZ E D R U N O F F IN D E X -2.5 -2 -1.5 -1 -0.5 0 0.5 1 1.5 2 2.5 1 9 7 9 1 9 8 0 1 9 8 1 1 9 8 2 1 9 8 3 S T A N D A R D IZ E D R U N O F F IN D E X
F. Djellouli et al. J Fundam Appl Sci. 2016, 8(3), 1037-1053 1049
Fig.8. The SRI values for observed stream flow in Wadi Louza basin at the different time scale: a) SRI 1, b) SRI 3, c) SRI 9, d )SRI 12.
M a r 1 9 8 4 F e b 1 9 8 5 J a n 1 9 8 6 D e c 1 9 8 6 N o v 1 9 8 7 O c t 1 9 8 8 S e p 1 9 8 9 A u g 1 9 9 0 J u l 1 9 9 1 J u n 1 9 9 2 M a y 1 9 9 3 A v r 1 9 9 4 M a r 1 9 9 5 F e b 1 9 9 6 J a n 1 9 9 7 D e c 1 9 9 7 N o v 1 9 9 8 O c t 1 9 9 9 S e p 2 0 0 0 A u g 2 0 0 1 J u l 2 0 0 2 J u n 2 0 0 3 M a y 2 0 0 4 A v r 2 0 0 5 a) SRI 1 N o v 1 9 8 3 N o v 1 9 8 4 N o v 1 9 8 5 N o v 1 9 8 6 N o v 1 9 8 7 N o v 1 9 8 8 N o v 1 9 8 9 N o v 1 9 9 0 N o v 1 9 9 1 N o v 1 9 9 2 N o v 1 9 9 3 N o v 1 9 9 4 N o v 1 9 9 5 N o v 1 9 9 6 N o v 1 9 9 7 N o v 1 9 9 8 N o v 1 9 9 9 N o v 2 0 0 0 N o v 2 0 0 1 N o v 2 0 0 2 N o v 2 0 0 3 N o v 2 0 0 4 b) SRI 3 N o v 1 9 8 3 M a y 1 9 8 5 N o v 1 9 8 6 M a y 1 9 8 8 N o v 1 9 8 9 M a y 1 9 9 1 N o v 1 9 9 2 M a y 1 9 9 4 N o v 1 9 9 5 M a y 1 9 9 7 N o v 1 9 9 8 M a y 2 0 0 0 N o v 2 0 0 1 M a y 2 0 0 3 N o v 2 0 0 4 c) SRI 9 1 9 8 3 1 9 8 4 1 9 8 5 1 9 8 6 1 9 8 7 1 9 8 8 1 9 8 9 1 9 9 0 1 9 9 1 1 9 9 2 1 9 9 3 1 9 9 4 1 9 9 5 1 9 9 6 1 9 9 7 1 9 9 8 1 9 9 9 2 0 0 0 2 0 0 1 2 0 0 2 2 0 0 3 2 0 0 4 d)SRI 12
F. Djellouli et al. J Fundam Appl Sci. 2016, 8(3), 1037-1053 1049
Fig.8. The SRI values for observed stream flow in Wadi Louza basin at the different time scale: a) SRI 1, b) SRI 3, c) SRI 9, d )SRI 12.
A v r 2 0 0 5 M a r 2 0 0 6 F e b 2 0 0 7 J a n 2 0 0 8 SRI 1 N o v 2 0 0 4 N o v 2 0 0 5 N o v 2 0 0 6 N o v 2 0 0 7 SRI 3 N o v 2 0 0 4 M a y 2 0 0 6 N o v 2 0 0 7 SRI 9 2 0 0 4 2 0 0 5 2 0 0 6 2 0 0 7 2 0 0 8 SRI 12
Figure 9 shows that hydrological drought is a consequence of meteorological drought, The extreme droughts identified by the meteorologicals index during the years 1984 and the moderate at 1988 have a large influence on the decrease of water resources, which causes extreme hydrological drought during the year 1993 and severe drought in 1992 fellow by moderate drought in 1994, 2006, 2007 at the Wadi Louza watershed.
Fig.9. The comparison between SPI12 and SRI12 in Wadi Louza Watershed
4. CONCLUSION
This paper presents a study to examine the applicability and performance of the three drought indices (SPI, EDI and SRI) for determining drought periods (meterological and hydrological) and monitoring drought in the wadi Louza basin..
The application of SPI for 1-month and 3 month time steps may lead to an erroneous assessment of the drought situation. SPI values of 9 months seem more useful that the others time step, which would show a maximum duration of the drought period almost in all regions of the basin.
The correlation between EDIs and SPIs is better for all time steps and the best was found for 9-month time step, This means that this time step is a better choice to detect the drought severity for study basin
-3.0 -2.5 -2.0 -1.5 -1.0 -0.5 0.0 0.5 1.0 1.5 2.0 2.5 1980 1981 1982 1983 1984 1985 1986 1987 1988 1989 1990 1991 1992 1993 1994 1995 1996 1997 1998 1999 2000 2001 2002 2003 2004 2005 2006 2007 2008 SP Is 12& S RI 12 YEARS
SPI 12 Sid Ahmed SPI 12 Telagh
F. Djellouli et al. J Fundam Appl Sci. 2016, 8(3), 1037-1053 1051
Compared with the SPI, the EDI was found to be more responsive to drought conditions and can be captured the real essence of the drought situation of the study area.
Finally, the watershed of Wadi Louza has experienced a severe meteorological drought in all regions during two periods, one between March 1983 and August 1984 and the other between March 1988 and November 1989. However, this meteorological drought had a great influence on the reduction of water resources has begot an extreme hydrological drought that is identified during the year 1994.
The determination of the three indices SPI, EDI and SRI has identified the risk of drought on agriculture in the first sector and the management of the water resources in a second. The main components of drought risk management are monitoring and early warning.
The results of this study can serve as a useful scientific contribution for monitoring drought and water resource management in this region and other similar areas.
5. REFERENCES
[1] Palmer W C . Meteorological drought. Office of Climatology, U.S. Departement of commerce,1965, 45, 1-58.
[2] Gibbs W J, Maher J V. Rainfall deciles as drought indicators. Bureau of Meteorology Bulletin. No. 48. Commonwealth of Australia, Melbourne,1967.
[3] Palmer W C. Keeping track of crop moisture conditions. Nationwide. The new crop moisture index. Weatherwise, 1968, 21, 156-161.
[4] Bhalme H N, Mooley D A. Large-scale drought / flood and monsoon circulation. Monthly Weather Review, 1980, 108, (8), 1197-1211.
[5] Shafer B A, Dezman L E. Development of a Surface Water Supply Index (SWSI) to assess the severity of drought conditions in snowpack runoff areas. Proceedings of the Western Snow Conference, 1982, 164-175.
[6] Wilhite D A, Glantz M H. Understanding the drought phenomenon. The role of definitions, in: Planning for drought. Toward a reduction of societal vulnerability. edited by Westview Press, 1985, 11–27.
time scales. Eighth Conference on Applied Climatology. Anaheim, California, 1993, 1, 179–184.
[8] Byun H R, Wilhite D A. Objective quantification of drought severity and duration. Journal of Climate, 1999, 12, 2747–2756.
[9] Rossi G. Drought mitigation measures. a comprehensive frame work. In Drought and Drought Mitigation in Europe. Somma (eds), Kluwer Academic Publishers, Dordrecht, 2000, 233-246.
[10] Byun H R, Lee D K. Defining three rainy seasons and the hydrological summer monsoon in Korea using available water resources index. Journal of Meteorological Society of Japan, 2002, 80, (11), 33-44.
[11] Yamaguchi Y, Shinoda M. Soil moisture modeling based on multiyear observations in the Sahel. Journal of Applied Meteorology, 2002, 41, (11), 1140–1146.
[12] Narasimhan B, Srinivasan R. Development and Evaluation of Soil Moisture Deficit Index (SMDI) and Evapotranspiration Deficit SIndex (ETDI) for Agricultural Drought Monitoring. Agricultural and Forest Meteorology, 2005, 133, 69-88.
[13] Han S U, Byun H R. The existence and the climatological characteristics of the spring rainy period in Korea. International Journal of Climatology, 2006, 26, (5), 637-654.
[14] Morid S, Smakhtin V, Moghaddasi M. Comparison of seven meteorological indices for drought monitoring in Iran. International Journal of Climatology, 2006, 26, (8), 971-985. [15] Choi K S, Byun H R. Definition of the onset and withdrawal of the warm season over East Asia and their Characteristics. Journal of Korean Meteorological Society, 2007, 43, (2), 143-159.
[16] Smakhtin V U, Hughes D A. Automated estimation and analyses of meteorological drought characteristics from monthly rainfall data. Environmental Modelling & Software, 2007, 22, 880-890.
[17] Tsakiris G, Pangalou D, Vangelis H. Regional drought assessment based on the Reconnaissance Drought Index (RDI).Water Resource Manage, 2007, 21, 821–833.
[18] Shukla S, Wood A W. Use of a standardized runoff index for characterizing hydrologic drought. Geophysical Research Letters, 2008, 35, L02405, http://dx.doi.org/ 10.1029/ 2007
F. Djellouli et al. J Fundam Appl Sci. 2016, 8(3), 1037-1053 1053
gl032487, 2008.
[19] Raziei T, Saghafian B, Paulo A A, Pereira L S, Bordi I. Spatial patterns and temporal variability of drought in western Iran. Water Resources Manage, 2009, 23, 439–455.
[20] Bovolo C, Blenkinsop S, Majone B, Zambrano B M, Fowler H, Bellin A, Burton A, Barceló D, Grathwohl P, Barth J. Climate change. water resources and pollution in the Ebro basin. towards an integrated approach, in: The Ebro River Basin. edited by Barceló, D. and Petrovic, M., Springer-Verlag, 2010.
[21] Mishra A, Singh V. A review of drought concepts. Journal of Hydrology, 2010, 391, 202-216.
[22] Zargar A, Sadiq R, Naser B, Khan F I. A review of drought indices. Environmental Review, 2011, 19, 333-349.
[23] Samaniego L, Kumar R, Zink M. Implications of parameter uncertainty on soil moisture drought analysis in Germany. Journal of Hydrometeorology, 2013, 14, 47–68. [24] Mahtab S S, Maryam D M, Mohamed D M. Study of drought with SPI index (case study: Ghareh Chai and Karkheh basins). International Research Journal of Applied and Basic Sciences, 2013, 4, (9), 2638-2644.
How to cite this article:
Djellouli F, Bouanani A and Babahamed K. Climate change: assessment and monitoring of meteorological and hydrological drought of Wadi El Hammam basin (NW-Algeria). J. Fundam. Appl. Sci., 2016, 8(3), 1037-1053.