HAL Id: hal-00776873
https://hal.archives-ouvertes.fr/hal-00776873
Submitted on 16 Jan 2013
HAL is a multi-disciplinary open access archive for the deposit and dissemination of sci-entific research documents, whether they are pub-lished or not. The documents may come from teaching and research institutions in France or abroad, or from public or private research centers.
L’archive ouverte pluridisciplinaire HAL, est destinée au dépôt et à la diffusion de documents scientifiques de niveau recherche, publiés ou non, émanant des établissements d’enseignement et de recherche français ou étrangers, des laboratoires publics ou privés.
Performance Analysis of a Hierarchical Shipboard
Wireless Sensor Network
Hussein Kdouh, Hanna Farhat, Gheorghe Zaharia, Christian Brousseau, Guy
Grunfelder, Ghaïs El Zein
To cite this version:
Hussein Kdouh, Hanna Farhat, Gheorghe Zaharia, Christian Brousseau, Guy Grunfelder, et al.. Per-formance Analysis of a Hierarchical Shipboard Wireless Sensor Network. 2012 IEEE 23rd Interna-tional Symposium on Personal, Indoor and Mobile Radio Communications - (PIMRC 2012), Sep 2012, Sydney, Australia. pp.765 - 770, �10.1109/PIMRC.2012.6362886�. �hal-00776873�
Abstract—Wireless Sensor Networks (WSN) have recently
gained a great attention in several applications such as environmental monitoring and target tracking. Applying this technology to shipboard monitoring systems may be a cost-effective solution to reduce the cost of wires installation and maintenance. However, wireless communications on board ships may be severely obstructed by the metallic structure of bulkheads. In this paper, we analyze the efficiency of a shipboard WSN by measurement and simulation. A measurement campaign is conducted to study the radio wave propagation and to verify the feasibility of a WSN on board a ship. Based on the measurement results, a hierarchical group-based topology for a large-scale shipboard WSN is proposed. A realistic simulation model of the ship, taking into account the environment particularities, is then performed using OPNET network simulator. Performance of the WSN architecture is evaluated using the ZigBee model. Measurement results show the feasibility of WSN technology on board ships, while simulation results show significant performance of proposed architecture in terms of end-to-end delay and packet delivery ratio.
Index Terms—Propagation measurements, ships, network
simulations, wireless sensor networks, ZigBee.
I. INTRODUCTION
hips are an important part of modern systems widely used in armed conflicts and commercial purposes such as fishing and transporting passengers and cargos. Ships manufacturers and navy companies aim to use automation on board ships as much as possible in order to improve security and reduce the number of crew members. Modern ships are equipped with automatic monitoring systems which control and ensure the safety and accuracy of the whole ship operation. Current shipboard monitoring systems use extensive lengths of cables to connect several thousands of sensors to central control units [1]. Tens of kilometers of cables may be installed on board a ferry-boat, increasing its cost, weight and architecture complexity. A possible solution to reduce the huge amount of cables is the use of the emerging Wireless Sensor Network (WSN) technology.
This work is a part of SAPHIR project supported by "Région Bretagne" and "Pôle Mer Bretagne".
Applying this technology for the shipboard monitoring system may reduce the cost of wires installation and facilitate the system maintenance and replacement. However, electromagnetic waves propagation on board a vessel is a serious challenge. Several factors decrease the performance of wireless networks in this particular environment. Metallic bulkheads, made often of steel, can severely decrease the power of received signals. Moreover, multipath effects leading to multiple delayed copies of the transmitted signal at the receiver may also decrease the radio communication data rate. Few papers have investigated the deployment of WSNs on board ships due to the time and cost needed [2-4]. Most of these experiments were limited to one or two rooms or one application.
In this paper, we present a complete study of a WSN deployment and testing on board a ship. It begins by a propagation measurement campaign in this particular environment. A WSN is then deployed using the results of the radio propagation study. A shipboard WSN architecture, which takes into account the particularities of the shipboard environment, is proposed. As the number of nodes is limited in the measurement test, a large scale WSN is simulated later using OPNET Modeler network simulator. Unlike the classical network simulations that take a simple disc model for communicating nodes, we have considered the characteristics of radio wave propagation obtained after the measurement campaign to obtain a realistic simulation and reliable results.
The remainder of this paper is organized as follows: Section II presents the measurement campaigns conducted on board a ferry and the obtained results. Section III describes the proposed architecture for the shipboard WSN. Section IV presents the simulation results. Finally, conclusions are drawn in Section V.
II. MEASUREMENT CAMPAIGNS
This section describes the measurement campaigns conducted on board a ferry, including a radio propagation study and a WSN deployment. This work is detailed in [5].
Performance Analysis of a Hierarchical
Shipboard Wireless Sensor Network
H. Kdouh1, H. Farhat1, G. Zaharia1, C. Brousseau2, G. Grunfelder1, G. El Zein1 Institut d'Electronique et de Télécommunications de Rennes, UMR CNRS 6164
1
INSA de Rennes, 2Université de Rennes1, Rennes, France [email protected]
A. Radio Wave Propagation Measurements
A radio wave propagation measurement campaign has been carried out on board the “Acadie”, a ferry-boat from "Compagnie Océane". It is constituted of four decks. The bottom deck houses the engine room, the tank room and the crew's cabins. The second deck contains a large vehicle parking and some small cabins. The covered passenger deck contains the passengers' seats and tables. Finally, the bridge deck includes an uncovered passenger deck and the wheel house. This ferry is mainly constructed of steel, which may severely degrade the quality of wireless communications.
Continuous Wave (CW) measurements have been conducted on board the “Acadie” to characterize the effects of radio wave propagation in this particular metallic environment. The objectives of these experiments are to verify possibility of wireless communications between adjacent rooms and adjacent decks, and to define path loss models for shipboard environments. The 2.4 GHz ISM frequency band has been selected because it is used by most existing standards dedicated to WSN [6].Each shipboard environment was measured using a common procedure. The transmitting (Tx) antenna is placed at a fixed location and path loss measurements are performed using a receiver (Rx) placed at different locations around (Tx). The received powers have been measured at more than 70 receiver locations. The received power has been spatially averaged along 20 wavelength circular track using 250 power samples to consider multipath-induced fading effects.
Measurement results have shown that wireless communications are possible when Tx and Rx are located in the same room. The path loss model can be expressed by:
X
d
d
n
d
PL
d
PL
(
)
(
0)
10
log
10(
/
0)
(1)where d is the Tx-Rx separation distance, d0 is a reference
distance (equal to 1 m), PL(d0) is the average path at the
reference distance, n is the path loss exponent and X is a zero-mean Gaussian distributed random variable (in dB) with standard deviation (also in dB) representing the random shadowing effects [7]. The values of PL(d0), n and which
have been computed using linear regression, are summarized in Table I. Values of the path loss exponent show the guiding effect of metallic bulkheads keeping the transmitted energy inside rooms.
Moreover, measurement results have shown that wireless communications are possible between two adjacent rooms separated by a watertight door. Closing a watertight door induces a supplementary path loss between 17 and 25 dB. However, wireless communications are impossible between two adjacent rooms separated by a metallic bulkheads without watertight doors. Additional angular measurements, using a Multiple Input Multiple Output (MIMO) sounder, have shown that watertight doors edges are the main sources of radio leakage between adjacent rooms [8].
Otherwise, walls and doors made of wood in crew's cabins have a negligible effect on the radio propagation.
Finally, results have shown that inter-decks wireless communications depend on the closeness of Rx and Tx to the stairway between decks. The metallic structure of ceiling and floor prevents the direct communication between Tx and Rx located far from the stairways.
B. Wireless Sensor Network Deployment
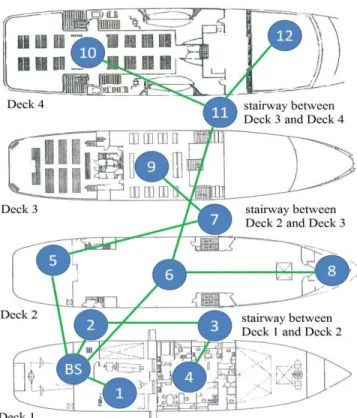
Using the radio propagation measurement results, a WSN has been deployed and tested on board the “Acadie”. The deployed network is constituted of 12 MicaZ nodes preprogrammed by the XMesh protocol from Crossbow Technologies [9]. All the sensor nodes are always powered and can participate in the data forwarding. The layout of “Acadie” decks and the locations of the sensor nodes are presented in Fig. 1. Green lines present the most frequent links established during the test. Nodes 2, 3, 7 and 11 are located in the stairways to ensure the connectivity between the adjacent decks.
During this test, 20726 packets have been sent by sensor nodes to the base station located in the control room in the bottom deck. Only 212 packets have been dropped (a packet is dropped when the node retransmits it 8 times without receiving an acknowledgment), which corresponds to 99% of delivery ratio. Established links (lines connecting nodes in Fig. 1) show that nodes located in upper decks send their data to the base station mainly through nodes located in stairways. This behavior confirms our previous conclusion that stairways are the main source of radio leakage between adjacent decks.
C. Concluding Remarks
The following concluding remarks can be drawn from the measurement campaigns:
- Ships (especially ferry-type) are built of metallic blocks that constitute decks and rooms.
- Wireless communications between adjacent rooms are possible in presence of non-conductive materials in the common bulkhead.
- Watertight doors are the main source of radio leakage between adjacent rooms. Closing a watertight door induces an attenuation up to 25 dB.
- Stairways are the main source of radio leakage between adjacent decks.
- Wireless communication between spaced nodes is possible through multi-hop communications.
TABLEI PATH LOSS PARAMETERS
Environments n PL(d0)
Engine Room 1 36.76 1.37 Parking 1.61 36.1 1.21 Passenger deck 2.15 28.19 1.25
Fig. 1 Layout of the Acadie decks and locations of the sensor nodes
We will use these conclusions in the next section to propose an architecture for a large-scale shipboard WSN.
III. PROPOSED ARCHITECTURE
As previously stated, the shipboard monitoring system may contain several thousands of sensors located in all compartments. Some rooms, such as the engine rooms, may contain hundreds of sensors. Using the concluding remarks of the previous section, we propose a hierarchical WSN architecture adapted to the particular characteristics of the shipboard environments. In this architecture, the network will be divided into groups and different nodes levels are defined based on the functions and resources of nodes. The propagation study has shown that the metallic structure of ships makes each room (which is similar to a metallic cube) quasi isolated (from a wireless propagation point of view). Therefore, we have decided to divide the network into zones where each metallic room is a zone. Three types of nodes may be found in this architecture: Sensor Nodes (SN) which collect sensing data from the environment, Border Nodes (BN) which collect data from SNs, and Gateway Nodes (GN) which collect data from the BNs and send them through a wired connection to the central processing units. Two types of wireless communications are distinguished: the intra-zone communications and the inter-zone communications.
A. Sensor Nodes
This level is constituted of SNs distributed in all ship rooms. Different data may be measured by these nodes such as temperature, pressure, humidity, fire, tank level, water level, etc. depending on the application. One SN may be
connected to several sensors if their real locations are close (case of the engine room where hundreds of sensors are located in a small area). If SNs are powered by batteries, their power consumption must be optimized. As the radio unit (Tx and Rx) consumes the most of the energy, it must be in the sleep mode as much as possible. Therefore, the number of transmissions must be optimized. In the confined metallic rooms, one-hop communication is sufficient between any nodes placed in the same room. Sensor nodes will not be intended to forward data from other nodes, which can greatly reduce their power consumption. Radio units are then turned on only when sensor nodes want to send their sensing data to the border node. These data may be periodic or event driven. In order to minimize the number of transmissions, we propose to predefine a Hard Threshold (HT) and a Soft Threshold (ST) for each application. It is not necessary that a SN sends its data continuously to its BN. Instead it saves the last sent data and continue to sense its environment. Measured values will be compared firstly to HT. If it exceeds this value (higher or lower depending on the application), the data will be sent. If not, the difference between the last value and the measured value will be compared to ST. If the difference exceeds ST, the value will be sent. This procedure reduces the number of transmissions to only urgent cases (exceeding HT) or to important value changes (exceeding ST). A careful attention must be given to the Medium Access Control (MAC) layer in order to minimize collisions. As we have adopted the IEEE 802.15.4 standard for this study, the used MAC algorithm is CSMA/CA (Carrier Sense Multiple Access with Collision Avoidance). Another contention free mechanism is possible in this standard for critical applications.
B. Border Nodes
Border Nodes (BNs) are the second level of our architecture. Each BN is responsible of all or a part of the sensor nodes in a metallic room. BNs are placed in front of doors borders of each room. More than one BN may be placed in a room if it has several doors, giving multiple choices for SNs to join the network. SNs send their data to BNs via one-hop intra-zone communication. BNs query and gather sensed measurements from SNs, and aggregate collected data (eliminate redundancy) before sending to the base station via multi-hop inter-zone communication. Different routing protocols may be adopted for inter-zone communication. Regarding the critical role of a BN (it is responsible of a cluster of sensor nodes), it must be always powered on. We propose to power BNs by the mains supply of the ship. Therefore, the inter-zone routing protocol does not have to optimize the energy consumption of these nodes. Instead, the link quality and the number of hops to the base station must be optimized.
C. Gateway Nodes (GN) and Central Data Repository
interface to the host, the Ethernet or the Internet (through satellites connections). Gateways form bridges to send and receive data between the host system and the sensor network. Similarly to BNs, gateways play a vital role in the network. Hence, they are always powered by the mains supply of the ship. Depending on the network size on board the ship and the technology adopted, one or more gateways may be used. In case of multiple gateways, each gateway will form a sub-network using a frequency sub-band and all gateways will be connected to an Ethernet installed on the ship. This mechanism increases the network scalability and decreases the collisions rate.
Data aggregated by the gateways are sent to a central repository located usually in the control room or in the wheel house of the ship. Data are analyzed and conclusions concerning the current state of each room are drawn. Central data repository is equipped with an user visualization software and a graphical interface for managing the network and showing measured data.
IV. PERFORMANCE ANALYSIS
This section presents the performance analysis of the proposed architecture. It includes the network simulator description, the used standard and the simulation scenarios.
A. Network Simulator
OPNET Modeler 16.0 [10] is used to simulate and evaluate the performance of shipboard WSN architecture. OPNET is a discrete-event and object-oriented simulator. Strength of OPNET in wireless network simulations is the accurate modeling of the radio transmission. Different characteristics of physical-link transceivers, antennas and antenna patterns are modeled in detail. In OPNET, the possibility of wireless link between a transmitter and a receiver depends on many physical characteristics of the component involved, as well as time varying parameters, which are modeled in the Transceiver Pipeline Stages. Parameters such as frequency band, modulation type, transmitter power, distance and antenna gain are common factors that determine whether a wireless link exists at a particular time or can ever exist.
However, OPNET does not take into account the physical obstacles between Tx and Rx in indoor environments. Studying the performance of the shipboard WSN architecture must be preceded by a realistic modeling of the shipboard environments. Therefore, we have developed several objects and functions to take the propagation challenges into account in the simulator. Firstly, the log-normal path loss model determined from the propagation measurement campaign is not supported by the “Terrain Modeling” module of OPNET. Therefore, we have integrated this model in the “Received Power Pipeline Stage”. The parameters of the model depend on the Tx and Rx locations. Secondly, we have developed a wall object to simulate the ship bulkheads. A “path loss” attribute has been given to each wall to indicate its structure
(totally metallic, metallic with openings, wooden wall, etc). The excess path loss due to the existence of a wall between Tx and Rx is also taken into account when determining the path loss in the “Received Power Pipeline Stage”. Finally, the ship has been modeled using its real dimensions.
B. ZigBee Standard
ZigBee [11] is one of the most used standards for WSNs. It is based on the IEEE 802.15.4 standard with a theoretical transmission data rate equal to 250 kbps in a wireless link. ZigBee defines three types of nodes: end devices, routers and coordinators. The coordinator can create the network, exchange the parameters used by the other nodes to communicate, relay packets received from remote nodes towards the correct destination, and collect data from the sensors. Only a single coordinator can be used in a network. A router, instead, relays the received packets and the control messages, manages the routing tables and can also collect data from a sensor. Routers and coordinators are referred to as Full Function Devices (FFDs). On the other hand, end devices, also referred to as Reduced Function Devices (RFDs), can act only as remote peripherals, which collect values from sensors and send them to the coordinator or other remote nodes. However, RFDs are not involved in network management, and therefore, cannot send or relay control messages.
According to the ZigBee standard, three different kinds of network topologies are possible: star, cluster-tree, and mesh. In a star network, there are a coordinator and one or more RFDs (end nodes) or FFDs (routers) which send messages directly to the coordinator (up to 65536 RFDs or FFDs). In a cluster-tree topology, instead, there are a coordinator which acts as a root and either RFDs or routers connected to it, in order to increase the network dimension. The RFDs can only be the leaves of the tree, whereas the routers can also act as branches. In a mesh network, any source node can talk directly to any destination. The routers and the coordinator, in fact, are connected to each other, within their transmission ranges, in order to facilitate packet routing. The radio receivers at the coordinator and routers must be “on” all the time. In the mesh network, the ZigBee standard employs a simplified version of the Ad-hoc On-demand Distance Vector (AODV) routing protocol [12]. Due to previous features, we have chosen the ZigBee standard to test our architecture. SNs will be formed by ZigBee end devices, BNs will be ZigBee routers and the GN will be a ZigBee coordinator. As it is impossible to cover all the ship by a star topology (due to metallic obstacles), we have only considered mesh and tree topologies.
C. Simulation Scenarios
The sensor nodes have been deployed on the simulation model of the ship as shown in Fig. 2. The network is constituted of 100 sensor nodes (routers and end devices) and one coordinator located in the bottom deck. As previously
stated, routers have been placed in front of watertight doors and windows in each room where end devices are located. The number of sensor nodes in each room is related to the real placement of sensors in the current monitoring system, which contains hundreds of sensors. The engine room (bottom deck) contains 150 sensors. The packets size sent by each sensor is 2 bytes. As the surface of rooms on board ships is not large, it would be possible to connect several sensors to one node. We suppose that each sensor node is equipped with 5 sensors (similar to MicaZ nodes used in the measurement campaign). Hence, the data packet size is equal to 120 bits (8 bits for the sensor ID and 16 bits for the measured data). Therefore, this scenario simulates a WSN with 500 sensors. Table II summarizes the parameters used for simulation.
D. Results and Analysis
The objective of this study is to propose a reliable shipboard monitoring system based on wireless technologies. In spite of the important reduction of cost and complexity, this solution must provide a Quality-of-Service (QoS) similar to that provided by the current wired system. A monitoring system has hard requirements in terms of reliability and delays. All critical sensed data (e.g. fire alarm, water-level) must arrive successfully to the data repository. The maximum acceptable delay for considered data is 1 second. IEEE 802.15.4 offers the possibility of retransmitting a packet if the source node does not receive an acknowledgment from the destination node. In a network with huge number of nodes (similar to a shipboard WSN), the number of retransmissions has an important impact on the global performance of the network, including the packet delivery ratio, the end-to-end delay, the energy consumption of nodes and the network load.
Fig. 2 Layout of simulation model of Acadie and ZigBee WSN topology
Fig. 3 shows the evolution of the packet delivery ratio of the network with respect to the maximum number of retransmissions for the tree and mesh topologies. For the tree topology, the packet delivery ratio increases with the number
of permitted retransmissions. It reaches 100 % when the retransmissions number is equal or higher than 10. It can be concluded from this curve that a maximum number of 10 retransmissions is sufficient to have a maximum packet delivery. Otherwise, for the mesh topology, the packet delivery ratio increases rapidly until the number of retransmissions becomes 10 and decreases slowly for higher values. This may be explained by the collisions that can cause the retransmissions of failed packets. Therefore, a maximum value of 10 retransmissions is an optimal value for the two topologies.
Fig. 3 Packet delivery ratio versus the number of retransmissions
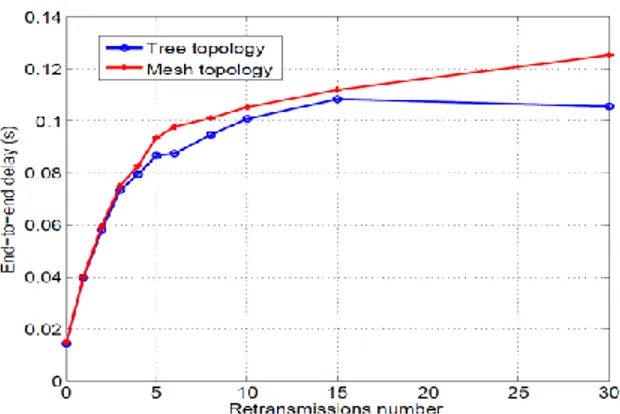
We can notice in this figure that the packet delivery ratio achieves 99% for 8 retransmissions, which is the same value found in the network test (8 retransmissions in the XMesh protocol). It is also seen in the figure that the packet delivery ratio is slightly higher for the tree topology. The particular ship environment makes this advantage of the tree topology. Fig. 4 shows the variations of the average end-to-end delay with respect to the number of retransmissions for the tree and mesh topology of ZigBee network. End-to-end delay is defined as the total delay between creation and reception of an application packet. This figure shows that the average delay increases when the number of retransmissions increases. For the tree topology, the delay increases rapidly
for retransmissions number lower than 10.
TABLEII SIMULATION PARAMETERS
Parameter Value
Maximum number of end devices or routers per
router 200
Route discovery timeout (sec) 10
Maximum depth 10
Acknowledge wait duration (sec) 0.05 Minimum value of the back-off exponent in the
CSMA/CA 3
Maximum number of back-offs 4 Channel sense duration (sec) 0.1
Data rate (kbps) 250
Receiver sensitivity (dBm) -95 Frequency band (GHz) 2.4 Transmission power (W) 0.001 Packet interarrival time (sec) 1 Packet size (bits) 120
Fig. 4 End-to-end delay versus the number of retransmissions
For larger number of retransmissions, its variations become small. This result is coherent with the packet delivery and confirms that 10 retransmissions are sufficient to have a reliable tree-topology network. The value of delay achieved is 0.1 second which is acceptable for the shipboard monitoring system that supports a maximum delay of 1 second. Otherwise, the delay keeps increasing in the case of Mesh topology. It is slightly higher than the delay of tree topology. This is basically due to the differences in the routing techniques and the size of routing tables in the mesh topology where the route discovery procedure induces additional delays.
BNs play a critical role, especially routers located near the coordinator. Most of the traffic coming from upper decks pass through these routers. The failure of this node may cause loss of a large traffic. Therefore, it would be necessary to duplicate these critical nodes so that the other BN can reroute the traffic supported by the failed node. In the simulation scenario, two BNs have been located in the stairway between the control room and the parking (corresponding to node 2 location in Fig. 1). In order to evaluate the importance of node duplication in this critical location, we have failed one BN at simulation time t = 100 seconds and then recover it at t = 160 seconds and then fail the second BN at t = 200 seconds. Fig. 5 shows the sent traffic and received traffic for both tree and mesh topology. It proves that the received traffic drops when each router is failed but re-achieves the maximum value after several seconds.
Fig. 5 Sent and received traffic as a function of time for the router failure scenario
V. CONCLUSION
In this paper, the application of wireless technologies to the shipboard monitoring system has been studied. A measurement campaign has been carried out on board a ferry to determine path loss models. An IEEE 802.15.4 compliant WSN has been tested successfully on board the same ferry. Based on the measurement results and the particularities of the environment, a hierarchical zone-based architecture has been proposed for a large shipboard WSN. The performance of this architecture has been evaluated using ZigBee standard by means of simulations. In order to obtain a reliable and representative simulation, the path loss models obtained from the measurement campaign have been integrated into the simulator. The obtained delay and packet delivery ratio meet the difficult requirements of the shipboard monitoring system. These results have also shown that ZigBee may be an appropriate technology for the proposed architecture.
ACKNOWLEDGMENT
The authors thank Marinelec Technologies and Compagnie Océane for the opportunity to conduct the measurement campaigns.
REFERENCES
[1] J.P. Lynch and K.J. Loh, “A summary review of wireless sensors and sensor networks for structural health monitoring”, The Shock and Vibration Digest, Vol. 38, No. 2, pp.91-128, 2006.
[2] T. Pilsak and J. L. ter Haseborg, , “Simulation of wireless sensor network on vessels under consideration of EMC”, Asia-Pacific International Symposium on Electromagnetic Compatibility, Beijing, China, April 2010. [3] B.G. Paik, S.R. Cho, B.J. Park, D. Lee, B.D. Bae and J.H. Yun,
“Characteristics of wireless sensor network for full-scale ship application”, Journal of Marine Science and Technology, Vol 14, No 1, pp 115–126, 2009.
[4] L. Krishnamurth, R. Adler, P. Buonadonna, J. Chhabra, M. Flanigan, N. Kushalnagar, L. Nachman, and M. Yarvis (2005), “Design and Deployment of industrial sensor networks: Experiences from a semiconductor plant and the north sea”, Proceedings of the 3rd International Conference on Embedded Networked Sensor Systems, San Diego, USA, 2005.
[5] H. Kdouh, C. Brousseau, G. Zaharia, G. Grunfelder and G. El Zein, “Applying ubiquitous wireless technologies for shipboard monitoring systems”, International Symposium of Wireless Personal Multimedia Communication (WPMC'11), Brest, France, October 2011.
[6] J. Yick, B. Muckherjee and D. Ghosal, “Wireless sensor network survey”, Computer Networks, Vol 52, No 12, pp 2292–2330, 2008.
[7] T.S. Rappaport. Wireless communications: Principles and practice. Prentice Hall, 2002.
[8] H. Kdouh, H. Farhat, T. Tenoux, C. Brousseau, G. Zaharia, G. Grunfelder, Y. Lostanlen and G. El Zein, “Double directional characterisation of radio wave propagation through metallic watertight doors on board ships”, Electronics Letters, Vol 48, No. 6, pp. 307-309, March 2012.
[9] Memsic Technology, “Xmesh user’s manual”.
http://www.memsic.com/support/documentation/wireless-sensor-networks/category/6-user- manuals.html.
[10] OPNET official website, http://www.opnet.com. [11] ZigBee Alliance, http://www.zigbee.org.
[12] C.E. Perkins and E.M. Royer, “Ad-hoc on-demand distance vector routing”, Proceedings of the 2nd IEEE Workshop on Mobile computing Systems and Applications, New Orleans, USA, pp. 90-100, February1999 .