Montréal Mars 2002
Série Scientifique
Scientific Series
Canadian Pulp and Paper
Plants: Why Some Do Well
and Others Do Not ?
membres, d’une subvention d’infrastructure du ministère de la Recherche, de la Science et de la Technologie, de même que des subventions et mandats obtenus par ses équipes de recherche.
CIRANO is a private non-profit organization incorporated under the Québec Companies Act. Its infrastructure and research activities are funded through fees paid by member organizations, an infrastructure grant from the Ministère de la Recherche, de la Science et de la Technologie, and grants and research mandates obtained by its research teams.
Les organisations-partenaires / The Partner Organizations
•École des Hautes Études Commerciales •École Polytechnique de Montréal •Université Concordia
•Université de Montréal
•Université du Québec à Montréal •Université Laval
•Université McGill
•Ministère des Finances du Québec •MRST
•Alcan inc. •AXA Canada •Banque du Canada
•Banque Laurentienne du Canada •Banque Nationale du Canada •Banque Royale du Canada •Bell Canada
•Bombardier •Bourse de Montréal
•Développement des ressources humaines Canada (DRHC) •Fédération des caisses Desjardins du Québec
•Hydro-Québec •Industrie Canada
•Pratt & Whitney Canada Inc. •Raymond Chabot Grant Thornton •Ville de Montréal
© 2002 Julie Doonan, Paul Lanoie et Benoit Laplante. Tous droits réservés. All rights reserved. Reproduction partielle permise avec citation du document source, incluant la notice ©.
Short sections may be quoted without explicit permission, if full credit, including © notice, is given to the source.
ISSN 1198-8177
Les cahiers de la série scientifique (CS) visent à rendre accessibles des résultats de recherche effectuée au CIRANO afin de susciter échanges et commentaires. Ces cahiers sont écrits dans le style des publications scientifiques. Les idées et les opinions émises sont sous l’unique responsabilité des auteurs et ne représentent pas nécessairement les positions du CIRANO ou de ses partenaires.
This paper presents research carried out at CIRANO and aims at encouraging discussion and comment. The observations and viewpoints expressed are the sole responsibility of the authors. They do not necessarily represent positions of CIRANO or its partners.
Julie Doonan
†, Paul Lanoie
‡, Benoit Laplante
§Résumé / Abstract
Il est généralement reconnu que les firmes font face à des pressions internes et externes pour qu'elles améliorent leur performance environnementale. Cependant, peu d'études ont tenté d'identifier l'importance de ces différentes sources de pression tel que les gestionnaires les perçoivent. Dans cette étude, nous montrons que les directeurs «environnement» de l’industrie canadienne des pâtes et papiers perçoivent le gouvernement et le public comme les sources de pression les plus importantes, devant les marchés financiers et les consommateurs. Nous montrons également que l’implication de la haute direction à l’égard de l’environnement et la formation des employés par rapport à la problématique environnementale sont des déterminants importants de la performance environnementale. Cette recherche nous aide donc à mieux comprendre les déterminants de la performance environnementale et elle permet de réaffirmer le rôle crucial joué par une intervention gouvernementale vigoureuse dans le domaine.
It is generally recognized that firms face both internal and external pressure to improve their environmental performance. However, few studies have attempted to delineate the importance of those various sources of pressure as firms’ managers themselves perceive them. In this study, we show that managers in the Canadian pulp and paper industry perceive government and public, but not financial and consumer markets, as the most important source of pressure. We also show that involvement of the firm’s higher level management and environmental education of employees are important determinants of the firm’s performance. While the paper provides a better understanding of the determinants of environmental performance, it re-asserts the crucial role of strong government regulatory intervention.
Mots-clés : Performance environnementale, Politique environnementale, Audit environnemental. Keywords : Environmental performance, Environmental policy, Environmental audit.
* Please send correspondence to Paul Lanoie. Fax: 514-340-6469
† École des Hautes Études Commerciales, Institut d’Économie Appliquée, Montréal, Canada, H3T 2A7. ‡
École des Hautes Études Commerciales, Institut d’Économie Appliquée, Montréal, Canada, H3T 2A7. § Independent scholar and consultant.
I. Introduction
A limited number of empirical studies have seeked to understand the determinants of firms’ environmental performance. In the economics literature, an essential issue of interest has been the impact of the various monitoring and enforcement actions on the environmental performance of polluters.1 Others have examined the role that communities may play to create incentives for local industrial facilities to reduce their pollution.2 Finally, a number of authors have examined whether or not the public disclosure of environmental performance may create incentives for pollution control.3
While these various empirical analyses offer key understanding of firms’ environmental behavior, none of these analyses rely on information provided by firms’ managers themselves. An exception of interest is Henriques and Sadorsky (1995, 1996; henceforth H&S) who conducted a survey of 750 Canadian corporations in 1992. These corporations covered a wide range of sectors, from primary to service sectors. In their model, H&S seek to determine the characteristics of firms that are likely to formulate an environmental plan. These authors find that pressure from customers and shareholders represent the two most important determinants of the formulation of an environmental plan. H&S also found that the commitment of senior management to deal with environmental issues is an important determinant of the likelihood of the existence of an environmental plan. However, interestingly, government regulation does not appear as a statistically significant source of pressure. H&S explain this result by observing that
1. See Dasgupta et al. (2001), Gray and Deily (1996), Helland (1998), Laplante and Rilstone (1996), Magat and Viscusi (1990), and Nadeau (1997).
2. See Blackman and Bannister (1998), and Pargal and Wheeler (1996).
3 Comprehensive surveys of the role of communities and information markets are presented in Cohen (1998) and World Bank (2000).
a large number of firms have indicated by surveys that government regulation is an important source of pressure. The lack of variability in the measure of government regulation thus reduces the explanatory power of this variable.
In this paper, we extend and enrich the work of H&S in two directions. First, from a policy perspective, we posit the variable of interest to be the environmental performance of the firms. Hence, we seek to understand the determinants of that environmental performance, and prefer to view the presence of an environmental plan simply as an input into the production of that performance (output). Secondly, our conceptual model differs sensibly from H&S whose statistical analysis relies on the estimation of a logit model. As described in the next section, we prefer to model the firm’s environmental performance as a sequence of events whereby various sources of pressure may induce various types of activities and actions by the enterprise, activities and actions which then in turn have an impact on the environmental performance of the firm.
We test our model in the Canadian pulp and paper industry. Our interest to explain firms’ actual environmental performance necessitates that we focus our analysis on a single industrial sector for which there is sufficient plant-level environmental performance data to test the model (e.g. emissions data). The pulp and paper industry possesses this important characteristic. Unlike H&S, our results reveal government regulation and public (local communities) to be important sources of pressure inducing firms to undertake actions to improve their environmental performance. This result re-asserts the important role of strong regulatory intervention. Capital markets and consumer markets do not appear as a statistically significant source of pressure.
While earlier studies have revealed capital markets reacting to environmental information,4 this result may indicate that firms’ environmental performance is not necessarily responsive to the reaction of capital markets. However, along with H&S, we find the commitment of the higher level of management to be a significant determinant of environmental performance.
We discuss the conceptual model in further details in the next section. The estimation methodology and data are presented in Section 3, while results are presented in Section 4. We briefly conclude in Section 5.
II. Conceptual Model
The model we develop relies on the premises that the environmental performance of an industrial facility results from actions undertaken to improve and maintain this performance. Whether or not such actions are undertaken depends in turn on pressure perceived or exercised by various stakeholders.
As illustrated in Figure 1, we group the various sources of pressure into 4 categories: legal, economic, social, and internal. The legal source of pressure pertains essentially to the nature of the environmental regulation faced by the enterprises. It would include not only the stringency of the regulation (e.g. effluent standards), but also the extent of implementation of the regulation. We distinguish four sources of economic pressure: providers of financial capital as represented by investors and creditors; customers; suppliers; and competitors. The social pressure is
4. See Dasgupta et al. (2000), Hamilton (1995), Klassen and McLaughlin (1996), Konar and Cohen (1996, 2001), Lanoie et al. (1994, 1998), and Muoghalu et al. (1990).
represented by community and non-governmental organizations. Finally, management and employees capture internal sources of pressure.5
Figure 1 Conceptual Model
5. For example, in their study of the impact of inspections on pollution emissions of pulp and paper plants in Quebec (Canada), Laplante and Rilstone (1996) found that unionised employees are very prone to inform the environmental regulator about a plant’s wrongdoing with respect to the management of its waste.
Attitude and actions Sources of pressure Environmental performance Legal Regulation Economic
Investors and creditors Customers Suppliers Competitors Social context Community NGOs Social Community NGOs Internal Management Employees Involvement Integration Human resources Financial resources Monitoring system
BOD and TSS effluent emissions
Spills
Use of chlorine
Fines and penalties
Air emissions
Use of alternative sources of energy
If and when effective, these various sources may exert pressure on firms to undertake actions aimed at improving the environmental performance. We group these actions into 5 broad categories. Involvement refers to the level of involvement of the higher level of management in the environmental affairs of the company. Integration represents the level of integration between the environmental services and the other administrative units of the industrial facility. Human
resources captures how human resources management takes into account environmental issues. Financial resources refers to the physical and financial resources devoted to the improving and
maintaining the environmental performance of the facility. Finally, monitoring system represents the facility’s environmental performance monitoring activities and system.
The environmental performance of the industrial facility is measured by a number of variables all aimed at providing information on the overall nature of that performance. These include not only pollution information such as air and water emissions, and spills, but as well information on key inputs such as the use of alternative sources of energy and, given the industrial sector of interest in this paper, the use of chlorine in the production process. The presence of fines and penalties also aim to provide information on the environmental performance of the facility.
In the next Section, we describe the methodology used to estimate the model presented in Figure 1, the data collection process and present a descriptive analysis of the data.
III.Methodology and Data
The model
The model presented in Figure 1 can be translated into a structural equation model of the following general form:
η = βη + Γξ + ζ
where:
η is a m X 1 vector of latent endogenous variables;
β is a m X m matrix of coefficients to be estimated;
Γ is a m X n matrix of coefficients to be estimated;
ξ is a n X 1 vector of latent exogenous variables;
ζ is a m X 1 vector of residual errors.
Specifically, the model can be written as :
ζ β +Γ + = PRESSURE E PERFORMANC MONITORING RESOURCES FINANCIAL RESOURCES HUMAN N INTEGRATIO T INVOLVEMEN E PERFORMANC MONITORING RESOURCES FINANCIAL RESOURCES HUMAN N INTEGRATIO T INVOLVEMEN
In this linear structural equation model, the endogenous and exogenous variables are latent variables which are not directly observed, but are proxied by a series of observed indicators. These indicators are then combined through a principal component analysis (see, Stevens, 2001) to provide a representation of the latent variables. For instance, the level of integration of environment services into other administrative units is not directly observed. However, a series of indicators can be used (e.g. the frequency of contacts between the environment services and the other units), measured by means of surveys, and combined by means of principal component analysis to proxy this latent variable.
The structural model is estimated using the popular EQS software which is very flexible allowing for all variables except the pressure variables to be potentially endogenous.6 The estimated model is thus tantamount to a simultaneous equation system in which the variance-covariance matrix is adjusted to account for the fact that the latent variables are not precisely measured.
The survey
For the purpose of the analysis, almost all the information was collected by means of a survey conducted among the environment directors of all Canadian pulp and paper plants. The nature of the compliance status of the plants with respect to water emissions regulation was collected directly from the Department of environment in the Canadian provinces where the plants are located.
In the course of preparation of the survey, two pulp and paper plants were visited, and discussions were held with four environment directors. The relevance of the questions presented in the survey, and the wording of technical features of the survey were thus validated. Furthermore, a draft form of the questionnaire was pre-tested with 10 directors.7
The survey was conducted by phone during the winter of 1997. A total of 101 out of 150 directors were then reached, for a response rate of 67 %. This appears relatively good given the extensive nature of the interview which lasted approximately 45 minutes. Fifteen of these questionnaires were eliminated for too much information being missing. As a result, responses from 86 questionnaires were used for purpose of estimation.
Descriptive analysis of the data
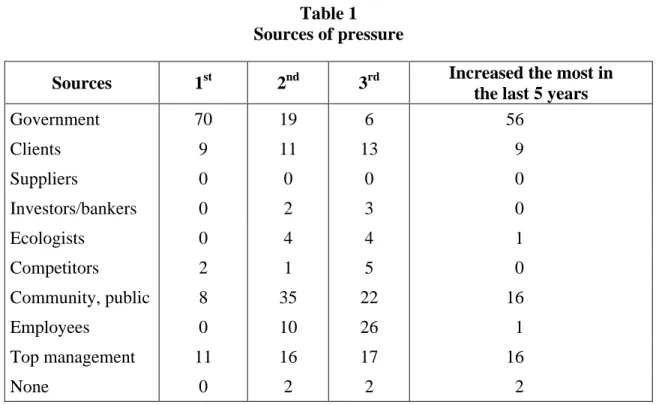
To capture the variable pressure, respondents were presented with the sources of pressure described in Figure 1, and were asked which three of those were the most important sources of pressure affecting the environmental behaviour of the facilities in the course of the last five years. Respondents were also asked which of these sources had increased most over that period of time. As shown in Table 1, 70% of the environment directors of the industrial facilities responded that the government (regulation) was the most important source of pressure, followed with pressure from top management, and clients. Note that 35% and 26% of the respondents indicated public pressure and employees to be the second and third most important source of pressure respectively. Interestingly, the financial market is not identified as an important source of pressure although a number of recent studies (Lanoie et al., 1998, Konar and Cohen, 2001)
have shown that capital markets tend to “punish” firms with bad environmental performance. Similarly, Henriques and Sadorsky (1995) identified the clients as a major pressure group, which is not the case here.
Table 1 Sources of pressure
Sources 1st 2nd 3rd Increased the most in
the last 5 years
Government 70 19 6 56 Clients 9 11 13 9 Suppliers 0 0 0 0 Investors/bankers 0 2 3 0 Ecologists 0 4 4 1 Competitors 2 1 5 0 Community, public 8 35 22 16 Employees 0 10 26 1 Top management 11 16 17 16 None 0 2 2 2
The level of involvement of the top management was captured by means of eight different questions aimed at collecting both objective and subjective information on this aspect. In particular, 66 % of the respondents indicated the presence of a vice-president environment, and 70 % indicated the presence of an environment committee on the board of directors.
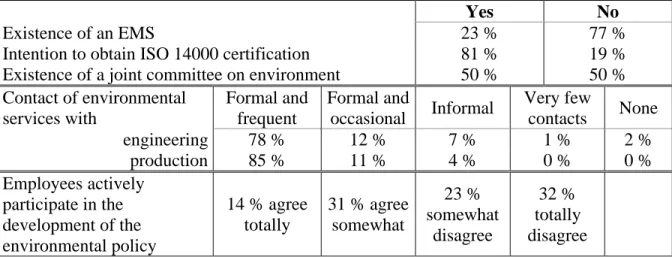
The level of integration of environment across administrative units is captured through a series of questions pertaining to the following features: existence of an integrated environment management system (EMS); existence of a joint employer – employee committee on environmental issues; firm’s intention with regard to the ISO 14000 certification; frequency of
contact between the environment director and the managers of other units; consideration of environmental issues when planning major changes in the plant; and participation of employees in the elaboration of the environmental policy.
Table 2 indicates that, while 81 % of the directors express an intention to obtain the ISO 14 000 certification, only 23 % of the plants have an integrated EMS. Most plants appear to experience very frequent and formal contacts between the environment services and the other units of the plants (e.g. engineering and production), and 50 % of the plants have a joint committee on environmental issues. 45 % of the respondents indicate that employees actively participate in the development of the facility’s environmental policy.
Table 2
Integration of environmental issues
Yes No
Existence of an EMS 23 % 77 %
Intention to obtain ISO 14000 certification 81 % 19 %
Existence of a joint committee on environment 50 % 50 % Contact of environmental services with Formal and frequent Formal and occasional Informal Very few contacts None engineering 78 % 12 % 7 % 1 % 2 % production 85 % 11 % 4 % 0 % 0 % Employees actively participate in the development of the environmental policy 14 % agree totally 31 % agree somewhat 23 % somewhat disagree 32 % totally disagree
As for human resources, questions were asked on whether environmental training of different types of employees, and whether or not employees’ compensation and performance evaluation reflected the environmental performance of the facility. Table 3 shows that most plants provide some form of training on environmental issues to all types of workers, while approximately 30 % and 80% of the plants consider environmental performance in the compensation package and workers’ performance evaluation respectively.
Table 3
Human resources and the environment Categories of employees who have
received an environmental training: All employees Some employees None
Production employees 51 % 43 % 6 % Foremen 71 % 28 % 1 % New employees 52 % 29 % 19 % Professional technicians 77 % 17 % 6 % Managers 71 % 21 % 8 % Environmental issue is considered in: Agree totally Agree somewhat Somewhat disagree Totally disagree Compensation package 15 % 16 % 23 % 46 % Workers’ performance evaluation 32 % 47 % 13 % 8 %
The measure of financial resources is based on questions related to the date of implementation of a secondary treatment system and of an emergency basin, the evolution of the environmental services in terms of budget and number of employees, and the evolution of the research on environmental issues within the firm. Table 4 shows, that in most cases, budget and personnel devoted to the environmental services have increased during the five years preceding the survey (63 % of the plants report such increases in the personnel, and 79 % for the budget). It also appears that a large percentage of the plants have started to operate a secondary effluent
treatment system over the period 1992-97. Furthermore, a very large fraction of the plants (92 %) are involved in research activities surrounding environmental issues.
Table 4 Financial resources
Number of years since the installation
of : None Between 1 and 5 years Between 6 and 10 years More than 10 years Secondary effluent treatment system 19 % 43 % 12 % 26 %
Emergency basin 17 % 41 % 18 % 24 %
Evolution of the resources devoted to
the environment Increase Status quo Reduction
Personnel 63 % 26 % 11 %
Budget 79 % 15 % 6 %
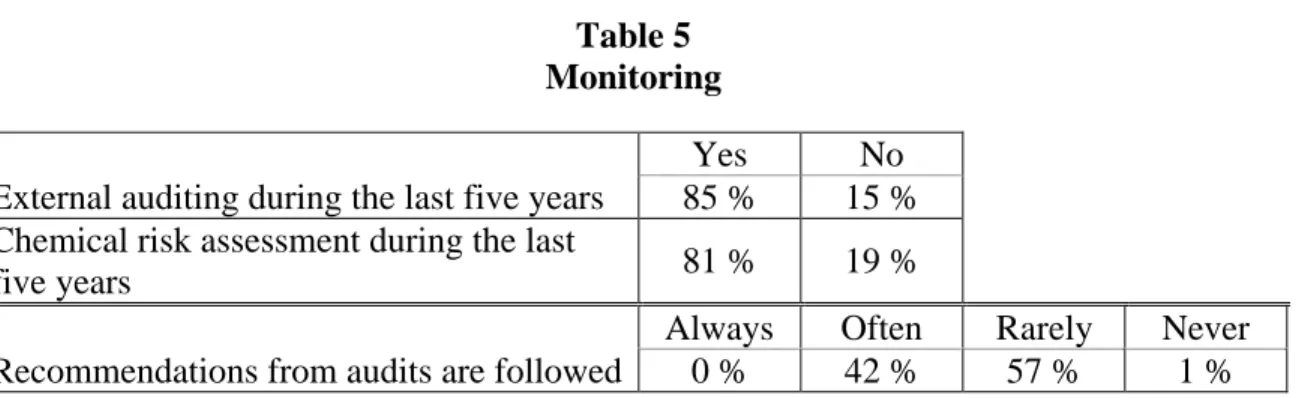
The environmental performance monitoring system relates to the evolution of the number of environmental audits, the extent to which the recommendations of the auditors have been followed, and the existence of chemical risk assessment. Table 5 shows that most plants (85 %) are involved in an auditing process. However, it would appear that recommendations emerging from this process are not necessarily followed.
Table 5 Monitoring
Yes No
External auditing during the last five years 85 % 15 % Chemical risk assessment during the last
five years 81 % 19 %
Always Often Rarely Never Recommendations from audits are followed 0 % 42 % 57 % 1 %
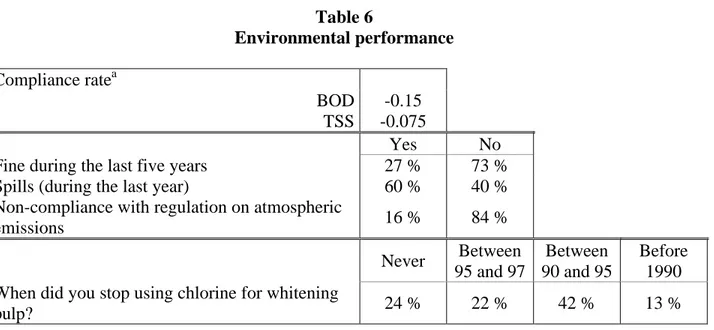
As mentioned earlier, the environmental performance is based on five ‘objective indicators’ measure of performance. This contrasts with previous studies which used much more
rudimentary environmental performance measures such as the existence of an environmental plan. First, managers were asked if the plants had been fined for non compliance with environmental regulation during the five-years period preceding the survey. Second, various provincial Departments of environment provided information on the plant’s compliance rate with biochemical oxygen demand (BOD) and total suspended solids (TSS) standards for the year 1995. Third, it was found whether or not plants had contravened their atmospheric emissions standards in the course of 1995. Fourth, information was requested on the use of alternative sources of energy (like biomass or pulping liquor). Finally, information was obtained on the use of chlorine in the whitening process.
Table 6 Environmental performance Compliance ratea BOD -0.15 TSS -0.075 Yes No
Fine during the last five years 27 % 73 %
Spills (during the last year) 60 % 40 %
Non-compliance with regulation on atmospheric
emissions 16 % 84 % Never Between 95 and 97 Between 90 and 95 Before 1990 When did you stop using chlorine for whitening
pulp? 24 % 22 % 42 % 13 %
a
Compliance rate is measured as: (actual average emissions – emissions standards) / emissions standards
Table 6 shows that 27 % of the plants had experienced a fine within the five-years period preceding the survey. On average, the plants were below their BOD limits by 15 %, and below their TSS limits by 7.5 %. Only 16 % of the plants asserted not complying with atmospheric
emissions regulations. A majority of the plants (65 %) report using alternative sources of energy. Finally, most plants report having ceased to use chlorine in the production of pulp since 1990.
IV. Empirical Results
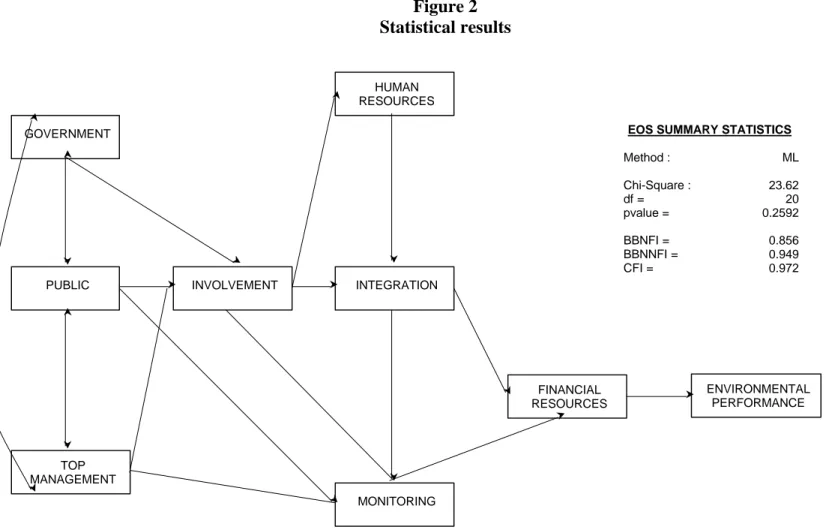
Main results are presented in Figure 2. The figure represents the relationships between the latent variables which best fit the data. Given that the model is tantamount to a simultaneous equation system, the relationship between different latent variables can go in both directions as indicated in the diagram. The good statistical fit of the model is confirmed by a certain number of indicators (Hoyle, 1995). First, it is acknowledged that a model is ‘significant’ when the goodness-of-fit indices are greater than 0.9. Here the Bentler-Bonett index (BBNNFI = 0,949), the LISREL GFI index (GFI = 0,943), and the CFI index (CFI = 0,972) are indeed greater than the threshold. Furthermore, when we compare the estimated model with one where we constraint all the coefficients to be equal to zero, we obtain a χ2 statistic of 0,2592, which is to be compared with a critical value of 0,1. We can thus reject the null hypothesis that the coefficients are equal to zero. The resulting model is consistent with our theoretical predictions.
First, it appears clearly that the three most important sources of pressure perceived by environmental directors are the government, the general public (including the neighbouring community), and the higher level of management. As mentioned earlier, financial market is not perceived as an important source of pressure on the firm’s environmental performance.
Figure 2 Statistical results GOVERNMENT PUBLIC TOP MANAGEMENT INVOLVEMENT INTEGRATION HUMAN RESOURCES MONITORING FINANCIAL RESOURCES ENVIRONMENTAL PERFORMANCE
EOS SUMMARY STATISTICS
Method : ML Chi-Square : 23.62 df = 20 pvalue = 0.2592 BBNFI = 0.856 BBNNFI = 0.949 CFI = 0.972
The involvement of the higher level of management appears to be an important factor in the chain of causality that follows. It influences the way human resources management integrates environmental concerns. It also affects the level of integration between the environmental services and the other administrative units in the rest of the plant, and the intensity of the
monitoring activities. It is often asserted in the management literature that the environmental
involvement of the top management is a primary determinant of the environmental performance of the firms (e.g., Deschamps and Beaulieu, 1996). To our knowledge, this is the first empirical evidence that confirms this common wisdom. This study also allows us to identify by which channels the influence of the top management is exerted.
The way by which environmental issues are taken into account in the human resources management is an indirect driver of the environmental performance through its impact on the level of integration. This seems normal given that the participation of all employees in the environmental management was an important element in the earlier definition of integration. This result is consistent with previous results of Boiral (1998) and Dasgupta et al. (1997) who find, in particular, that the level of environmental training is associated with a better environmental performance.
The level of integration between the environmental services and the other administrative units has an indirect effect on the environmental performance through its impact on the
monitoring system and on the financial resources devoted to the environment. This is a very
interesting result given that, to our knowledge, the notion of integration has been developed only recently, and applied to a single case study (Deschamps and Beaulieu, 1996). Using a more
systematic sample of data, we thus present evidence and confirm the empirical significance of this variable.
The environmental performance monitoring system has an indirect impact on the environmental performance through its effect on the level of financial resources. It suggests that the recommendations emerging from the monitoring system lead the plants to devote more financial resources to pollution control. It is also interesting to note that pressure from the public influences directly the intensity of the monitoring activities.
Financial resources devoted to pollution control remains the most important driver of
environmental performance. This is not necessarily surprising in the context of the pulp and paper industry where a large part of the environmental performance relies on the utilization of extensive and expensive pollution abatement devices such as secondary effluent treatment system.
V. Conclusion
A number of authors have examined the role and impact of inspections, communities, and markets (consumer and capital) on the environmental performance of industrial facilities. None of these studies however have seeked to understand how managers themselves perceive these sources of pressure.
In this paper, building but departing from the analysis presented by Henriques and Sadorsky (1995, 1996), we provide evidence that in this age of information, the government remains the
most important source of pressure on enterprises of the pulp and paper industry to improve their environmental performance. We however also show that the public is increasingly an important source of pressure thereby justifying programmes which aim to disclose the environmental performance of industrial facilities. We confirm the crucial impact of an involved higher level of management in environmental affairs, and offer evidence that the environmental training of employees is an important determinant of the environmental performance. Further studies in the area shall reveal if these results hold more generally in other, perhaps broader set of circumstances.
References
Blackman, A. and G.J. Bannister (1998), Community pressure and clean technology in the informal sector: An econometric analysis of the adoption of propane by traditional Mexican brickmakers, Journal of Environmental Economics and Management, 35:1, 1-21.
Boiral, O. (1998), Réduire la pollution par la mobilisation des travailleurs, Gestion, Summer, 20-29.
Canadian Association of Pulp and Paper (1995), Annual Report 1995, Montreal, Canada.
Cohen, M. (1998), Monitoring and Enforcement of Environmental Policy. In International
Yearbook of Environmental and Resource Economics, (T. Tietenberg and H. Folmer, Ed.),
Volume III, Edward Elgar Publishers.
Dasgupta, S., Hettige, H. and D. Wheeler (1997), What Improves Environmental Performance:
Evidence from Mexican Industry, mimeo, Development Research Group, World Bank, 25 p.
Dasgupta, S., Laplante, B. and N. Mamingi (2000), Pollution and capital markets in developing countries, Journal of Environmental Economics and Management, 42:3, 310-335.
Dasgupta, S., Laplante, B., Mamingi, N. and H. Wang (2001), Inspections, Pollution Prices, and Environmental Performance: Evidence from China, Ecological Economics, 36, 487-498. Deschamps, I. and M. Beaulieu (1996), Concilier la performance économique et la performance
écologique: quoi faire et comment réussir, Gestion, Décembre, 40-48.
Gray, W.B. and M.E. Deily (1996), Compliance and enforcement: air pollution regulation in the U.S. steel industry, Journal of Environmental Economics and Management, 31:1, 96-111. Hamilton, J.T. (1995), Pollution as news: Media and stock market reactions to the Toxics
Release Inventory data, Journal of Environmental Economics and Management, 28:1, 98-113.
Helland, E. (1998), The enforcement of pollution control laws: Inspections, violations, and self-reporting, The Review of Economics and Statistics, 80:1, 141-53.
Henriques, I. and P. Sadorsky (1995), The determinants of firms that formulate environmental plans, Research in Corporate Social Performance and Policy, Supplement, 1, 67-97.
Henriques, I. and P. Sadorsky (1996), The determinants of an environmentally responsive firm: an empirical approach, Journal of Environmental Economics and Management, 30:3, 386-395.
Hoyle, R.H. (1995), Structural Equation Modeling: Concepts, Issues, and Applications, Sage Publications.
Klassen, R.D. and C.P. McLaughlin (1996), The impact of environmental management on firm performance, Management Science, 42:8, 1199-1214.
Konar, S. and M.A. Cohen (1997), Information as regulation: The effect of community right to know laws on toxic emission, Journal of Environmental Economics and Management, 32:1, 109-124.
Konar, S. and M.A. Cohen, (2001), Does the market value environmental performance? The
Review of Economics and Statistics, 83:2, 281-289.
Lacroix, R., Montmarquette, C. Mahseredjian, S. and N. Froment (1991), Disparités interindustrielles dans les taux de départs volontaires: une étude empirique,
L’Actualité Économique : Revue d’Analyse Economique, 67:4, 458-481.
Lanoie, P. and B. Laplante (1994), The market response to environmental incidents in Canada: A theoretical and empirical analysis, Southern Economic Journal, 60:3, 657-72.
Lanoie, P. Laplante, B. and M. Roy (1998), Can capital markets create incentives for pollution control?, Ecological Economics, 26, 31-41.
Laplante, B. and P. Rilstone (1996), Environmental inspections and emissions of the pulp and paper industry in Quebec, Journal of Environmental Economics and Management, 31, 19-36. Magat, W.A. and W.K. Viscusi (1990) Effectiveness of the EPA’s regulatory enforcement: The
case of industrial effluent standards, Journal of Law and Economics, 33, 331-60.
Muoghalu, M., Robison, H.D. and J.L. Glascock (1990), Hazardous waste lawsuits, stockholder returns, and deterrence, Southern Economic Journal, 57:2, 357-70.
Nadeau, L.W. (1997), EPA effectiveness at reducing the duration of plant-level non-compliance,
Journal of Environmental Economics and Management, 34, 54-78.
Newman, J. and K. M. Breeden (1992), Managing in the environmental era: Lessons from environmental leaders, Columbia Journal of World Business, 27, Fall/Winter, 210-221. Pargal, S. and D. Wheeler (1996), Informal regulation of industrial pollution in developing
countries: Evidence from Indonesia, Journal of Political Economy, 104:6, 1314-27. Stevens, J.P. (2001), Applied Multivariate Statistics for the Social Sciences, 4th Edition.
World Bank (2000), Greening Industry: New Roles for Communities, Markets, and
Zerbe, P.M. (1997), Evaluation of Predominant Environmental Management Practices in the
Canadian Pulp and Paper Industry, Department of Resource Management and
2002s-24 Environmental Performance of Canadian Pulp and Paper Plants: Why Some Do Well and Others Do Not ? / Julie Doonan, Paul Lanoie et Benoit Laplante
2002s-23 A Rule-driven Approach for Defining the Behavior of Negotiating Software Agents / Morad Benyoucef, Hakim Alj, Kim Levy et Rudolf K. Keller
2002s-22 Occupational Gender Segregation and Women’s Wages in Canada: An Historical Perspective / Nicole M. Fortin et Michael Huberman
2002s-21 Information Content of Volatility Forecasts at Medium-term Horizons / John W. Galbraith et Turgut Kisinbay
2002s-20 Earnings Dispersion, Risk Aversion and Education / Christian Belzil et Jörgen Hansen 2002s-19 Unobserved Ability and the Return to Schooling / Christian Belzil et Jörgen Hansen 2002s-18 Auditing Policies and Information Systems in Principal-Agent Analysis /
Marie-Cécile Fagart et Bernard Sinclair-Desgagné
2002s-17 The Choice of Instruments for Environmental Policy: Liability or Regulation? / Marcel Boyer, Donatella Porrini
2002s-16 Asymmetric Information and Product Differentiation / Marcel Boyer, Philippe Mahenc et Michel Moreaux
2002s-15 Entry Preventing Locations Under Incomplete Information / Marcel Boyer, Philippe Mahenc et Michel Moreaux
2002s-14 On the Relationship Between Financial Status and Investment in Technological Flexibility / Marcel Boyer, Armel Jacques et Michel Moreaux
2002s-13 Modeling the Choice Between Regulation and Liability in Terms of Social Welfare / Marcel Boyer et Donatella Porrini
2002s-12 Observation, Flexibilité et Structures Technologiques des Industries / Marcel Boyer, Armel Jacques et Michel Moreaux
2002s-11 Idiosyncratic Consumption Risk and the Cross-Section of Asset Returns / Kris Jacobs et Kevin Q. Wang
2002s-10 The Demand for the Arts / Louis Lévy-Garboua et Claude Montmarquette
2002s-09 Relative Wealth, Status Seeking, and Catching Up / Ngo Van Long, Koji Shimomura 2002s-08 The Rate of Risk Aversion May Be Lower Than You Think / Kris Jacobs
2002s-07 A Structural Analysis of the Correlated Random Coefficient Wage Regression Model / Christian Belzil et Jörgen Hansen
2002s-06 Information Asymmetry, Insurance, and the Decision to Hospitalize / Åke Blomqvist et Pierre Thomas Léger
2002s-05 Coping with Stressful Decisions: Individual Differences, Appraisals and Choice / Ann-Renée Blais
* Consultez la liste complète des publications du CIRANO et les publications elles-mêmes sur notre site Internet :
2002s-02 Financial Asset Returns, Market Timing, and Volatility Dynamics / Peter F. Christoffersen et Francis X. Diebold
2002s-01 An Empirical Analysis of Water Supply Contracts / Serge Garcia et Alban Thomas
2001s-71 A Theoretical Comparison Between Integrated and Realized Volatilities Modeling / Nour Meddahi
2001s-70 An Eigenfunction Approach for Volatility Modeling / Nour Meddahi
2001s-69 Dynamic Prevention in Short Term Insurance Contracts / M. Martin Boyer et Karine Gobert
2001s-68 Serial Cost Sharing in Multidimensional Contexts / Cyril Téjédo et Michel Truchon
2001s-67 Learning from Strike / Fabienne Tournadre et Marie-Claire Villeval 2001s-66 Incentives in Common Agency / Bernard Sinclair-Desgagné
2001s-65 Detecting Mutiple Breaks in Financial Market Volatility Dynamics / Elena Andreou et Eric Ghysels
2001s-64 Real Options, Preemption, and the Dynamics of Industry Investments / Marcel Boyer, Pierre Lasserre, Thomas Mariotti et Michel Moreaux
2001s-63 Dropout, School Performance and Working while in School: An Econometric Model with Heterogeneous Groups / Marcel Dagenais, Claude Montmarquette et Nathalie Viennot-Briot
2001s-62 Derivatives Do Affect Mutual Funds Returns : How and When? / Charles Cao, Eric Ghysels et Frank Hatheway
2001s-61 Conditional Quantiles of Volatility in Equity Index and Foreign Exchange Data / John W. Galbraith, Serguei Zernov and Victoria Zinde-Walsh
2001s-60 The Public-Private Sector Risk-Sharing in the French Insurance "Cat. Nat. System" / Nathalie de Marcellis-Warin et Erwann Michel-Kerjan
2001s-59 Compensation and Auditing with Correlated Information / M. Martin Boyer et Patrick González
2001s-58 Resistance is Futile: An Essay in Crime and Commitment / M. Martin Boyer 2001s-57 The Unreliability of Output Gap Estimates in Real Time / Athanasios Orphanides
et Simon van Norden
2001s-56 Exact Nonparametric Two-Sample Homogeneity Tests for Possibly Discrete Distributions / Jean-Marie Dufour et Abdeljelil Farhat
2001s-55 Les coûts de la réglementation : une revue de la littérature / Robert Gagné, Paul Lanoie, Pierre-Carl Micheud et Michel Patry
2001s-54 Testing for structural Change in the Presence of Auxiliary Models / Eric Ghysels et Alain Guay
2001s-53 Environmental Regulation and Productivity: New Findings on the Porter Hypothesis / Paul Lanoie, Michel Patry et Richard Lajeunesse
2001s-52 The Aftermarket Performance of Initial Public Offerings in Canada / Maher Kooli et Jean-Marc Suret
2001s-49 How Innovative Are Canadian Firms Compared to Some European Firms? A Comparative Look at Innovation Surveys / Pierre Mohnen et Pierre Therrien 2001s-48 A Tale of Two Ports / Ngo Van Long et Kar-yiu Wong
2001s-47 Wage Policy of Firms: An Empirical Investigation / Stéphanie Lluis
2001s-46 Forecasting Some Low-Predictability Time Series Using Diffusion Indices / Marc Brisson, Bryan Campbell et John W. Galbraith
2001s-45 The Importance of the Loss Function in Option Pricing / Peter Christoffersen et Kris Jacobs
2001s-44 Let's Get "Real" about Using Economic Data / Peter Christoffersen, Eric Ghysels et Norman R. Swanson
2001s-43 Fragmentation, Outsourcing and the Service Sector / Ngo Van Long, Ray Riezman et Antoine Soubeyran
2001s-42 Nonlinear Features of Realized FX Volatility / John M. Maheu et Thomas H. McCurdy
2001s-41 Job Satisfaction and Quits: Theory and Evidence from the German
Socioeconomic Panel / Louis Lévy-Garboua, Claude Montmarquette et Véronique Simonnet
2001s-40 Logique et tests d'hypothèse : réflexions sur les problèmes mal posés en économétrie / Jean-Marie Dufour
2001s-39 Managing IT Outsourcing Risk: Lessons Learned / Benoit A. Aubert, Suzanne Rivard et Michel Patry