Transitional bulk-solutal Marangoni instability in sessile drops
Alexis Darras,1, 2, 3, ∗ Nicolas Vandewalle,1 and Geoffroy Lumay11
GRASP, CESAM - Physics Department, University of Li`ege, B-4000 Li`ege; Belgium; http://www.grasp-lab.org
2
F.R.S.-FRNS; B-1000 Bruxelles; Belgium
3
Experimental Physics, Saarland University; D-66123 Saarbr¨ucken, Germany (Dated: October 29, 2018)
Evaporation of sessile droplets is a method to organize suspended particles on solid substrates. Many studies have demonstrated that Marangoni flows caused by surface adsorbed molecules or temperature gradients can strongly affect the dried deposit. In the present paper, we show how transitional Marangoni instabilitiy can be triggered by bulk-diluted tensio-active ions. Thanks to PIV analysis, we identify four different flow stages. The transition between them can be understood by considering the competition between the Marangoni flow and the mass conservation flow, usually responsible for the coffee-ring pattern. We also demonstrate that the initial ionic concentration can select a coffee-ring pattern or a more homogeneous dried deposit.
I. INTRODUCTION
The self-assembly of colloids is currently a topic of in-tensive research, both on fundamental [1–11] and applied aspects. [12–22] Amongst the self-assembly processes, the evaporation of colloidal droplets has attracted much interest due to its wide range of potential applications, extending from blood analysis [23–26] via inkjet printing, paint and polymers, [27–29] up to and including nan-otechnology. [30] The main feature of colloidal droplets evaporation is the so-called coffee-ring effect. [31–34] This effect implies that particles tend to be deposited at the edge of the final dried pattern. However, several stud-ies have shown various mechanisms preventing this effect [29, 35]. Notably, it has been shown that Marangoni flows, driven by surface tension gradients, can be created from temperature gradients, surface tensio-active agents or in binary mixtures. [36–39] Those flows can strongly modify the deposits pattern and lead to patterns such as homogeneous deposits or polygonal networks. [40–42] Moreover, some researchers have shown that more com-plex deposits’ structures can be achieved thanks to vari-ous concentrations of proteins or liquid crystals. [43, 44] However, solutal Marangoni flows have been thoroughly described only when surface tension gradients are caused by temperature gradients or by tensio-active agents ad-sorbed at the surface of the droplets.
In the present paper, we show Marangoni instability can be triggered as a transitional flow by bulk-diluted tensio-active ions. Indeed, we evidence the flows which appear when a colloidal droplet containing bulk-diluted phosphate-buffered saline (PBS) is evaporating. We then show those flows can be understood by considering a com-petition between the mass conservation flow inducing the coffee-ring [31–34] and solutal Marangoni flows. [40, 45] This comes from the fact that the bulk concentration of PBS has a slight influence on the surface tension, like
other salts [46] (Supplementary Material contains data of surface tension as a function of PBS concentration[47]). We computed a few dimensionless numbers to understand the competition’s mechanisms. We eventually show how the PBS concentration consequently influences the final dried deposit of colloids and can possibly suppress the coffee-ring effect. We show that the PBS concentra-tion can be used as a parameter to progressively change the dried deposit pattern after the evaporation. To our knowledge, this is also the first time that such a thor-ough analysis of solutal Marangoni flow is performed in order to assess a quantitative influence of the solute on the dried deposit.
II. METHODS
A. Suspensions preparation
The experiments were performed with microspheres dispersed in water (Estapor R M1-070/60 and F1-100XC), with a volume fraction of φ = 50. 10−5 for M1-070 and φ = 2. 10−5 for F1-100XC. Those 1.2µ m diam-eter particles are made of polystyrene and covered with carboxyl charged groups to enable electrostatic stabiliza-tion of the suspension. The F1-100XC particles are also fluorescent and allow us to perform PIV analyses, while the M1-070/60 particles contain ferrite inclusions which make them dark and allow us to get high-contrast direct image to study the dried pattern. In order to ensure the purity of the dispersing phase, the commercial suspen-sions are first deposited in the bottom of their container with a centrifuge. The supernatant is then removed and the same quantity of distilled water is then poured back in the container. The particles are then dispersed again in the liquid thanks to an ultrasonic bath and mechanical agitation. This process is repeated three times. Then the particles are deposited once again and the supernatant is replaced with the adequate solution, i.e. water with di-luted phosphate buffered saline (PBS) (Supplier : VWR,
FIG. 1. Main results from PIV measurements. The pictures in row a) are obtained experimentally with focus near the top of the droplet. The pictures for different times are then taken from different focus height. Row b) shows the computed 2D velocity field ~v(~r) corresponding to the upper pictures. The colors correspond to the velocity’s 2D divergence ~∇ · ~v(~r), with blue being the positive values corresponding to areas from where the particles diverge and red being the negative values corresponding to areas of convergence. The green areas correspond to a zero divergence. Row c) depicts a 3D scheme of the streamlines based on the cumulative observations of the different heights, the colors of the arrows qualitatively matching the colors of the computed divergence. The approximate time of the transition between the different stages is indicated below in seconds with a typical precision of 20 s. Stage I corresponds to an outward flow. During stage II, a honeycomb-like pattern is observed near the surface of the droplet due to Marangoni instability. This pattern is then somehow collapsing on itself near the center of the drop during stage III. An outward flow, which tends to destabilize the previous structure, is observed during the final stage IV .
Composition: 137 mM NaCl, 2.7 mM KCl, 12 mM Phos-phate buffer). The PBS has been chosen since it is a com-mercially available pH buffer involving only non-organic molecules. Indeed, pH and ions concentration are often used as parameters to control electrostatic stabilization, [48] and organic molecules could potentially feed bacteria who could reach the suspension as it ages (which was a main trouble during the exploratory part of this work). At the final stage, particles are dispersed again thanks to an ultrasonic cell disruptor SONICS Vibra-Cell VC505.
B. Microscopy observations
To perform the observations, a 2 µl droplet of the sus-pension is placed on a microscope cover glass. A cus-tom airtight evaporative chamber is placed upon it. The chamber is made of plexiglass and is T-shaped. The ends
of the upper branches of the T are filled with silica gel to ensure reproducible humidity condition in the chamber. The central trunk is kept empty in order to keep a clear path for the light. Petroleum jelly is applied on the bot-tom of the chamber’s base to assess airtightness between the plexiglass and the cover glass. The suspension is ob-served from the bottom with a 6.4x magnification (or 20x to get details of the eventually dried deposits from several pictures). The microscope used is an inverted microscope Olympus IX73, connected to a 4070M-CL Thorlabs Cam-era with 2048 by 2048 pixels of 16 Bits depth. The PIV pictures are obtained by enlightening the sample with a blue led source, a 470 nm centered coolLED pE-100, and then filtering the re-emitted green light, centered around 525 nm from Estapor R datasheet, thanks to an Olympus filter cube U-FBWA. The PIV images are recorded with a frame rate of 1 fps, and the velocity field is computed with a Matlab code, with embedded image filtering to
3 0 100 200 300 400 500 600 700 800 900 1000 -0.15 -0.1 -0.05 0 0.05 0.1 0.15 0.2 0.25 0 0 0 0 0
I
II
III
IV
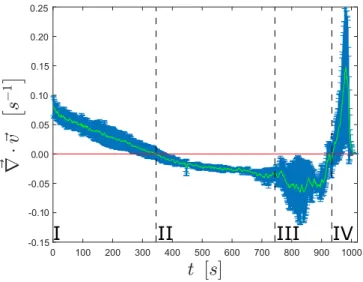
FIG. 2. Evolution of the mean 2D divergence of the flow field in a horizontal plane of the droplet, near the bottom plate. The Stage I, characterized by a divergent flow of mass con-servation, has a positive mean divergence. This mean diver-gence decreases as the Marangoni number M a increases (see main text). When the stage II occurs, along with Marangoni instability, this mean divergence cross the zero value and be-comes negative. When the Cheerios collapse, characterizing the stage III, occurs, the divergence encounters some nega-tive peak. The stage IV, seeing the resurgence of a strong outward flow before final deposition, is characterized by an important peak of divergence. Error bars are obtained from standard deviations between measurements. Differences are mainly due to the difficulty to accurately define the starting time of the experiments, as well as slight variations of the initial conditions for each droplet.
decrease the focus depth and based on the open-source PIVlab tool. [49, 50] Typical videos of evaporating drops are available in the Supplementary Material [47].
III. RESULTS
We prepared three different suspensions, each of them with various concentrations of PBS but with the same colloidal volume fraction of φ = 50 10−5 for the M1-070 and φ = 2. 10−5for the F1-100XC. The PBS was diluted in volume fraction as 6. 10−3, 10. 10−3 and 50. 10−3 of the respective final suspensions. For each of these suspen-sions, we observed the evaporation with 5 different focus heights above the glass substrate. For each of the spe-cific conditions, we observed at least 3 different droplets evaporation in order to assess the reproducibility of the results. In total, we then performed 15 measurements for each PBS concentration, leading to a total of 45 exploited videos. Typical videos for chosen focus height are avail-able as supplementary materials†. From those videos, we were able to determine four different stages during the evaporation process, observed for every tested
con-centration of PBS and illustrated in Fig. 1. An initial outward flow is observed during stage I. During stage II, Marangoni recirculation cells create a surface pattern of particles. This pattern collapses toward the centre in stage III, while an outward flow occurs near the sub-strate. During the last stage, stage IV , a global outward flow dominates the fluid motion while the particles are eventually deposited on the substrate. A quantitative approach to experimentally describe those transitions is to measure the mean 2D divergence of the flow field in a plane near the bottom plate, as described in Fig. 2. As we will show, the transition between the different stages can be understood mainly by considering a competition between the mass conservation flow, usually responsible for the coffee-ring effect, [38] and a solutal Marangoni instability. [40, 45]
A. Stage I: Initial outward flow
During stage I, an outward flow mainly corresponding to the usual mass conservation flow is observed. A small recirculation is observed at the center of the drop near the substrate, which is unusual. However, this might be understood by the fact that the outward flow increases the concentration of PBS near the edge of the droplet, which increases the surface outward flow. The mass leav-ing the center top of the droplet must then be replenished by an upward recirculation in the center of the drop. The mean divergence of the flow-field near the bottom plate is then positive, since the fluid mainly leaves the center of the drop to reach the edge, as illustrated in Fig. 2. During this first stage, the whole recirculation keeps in-creasing the concentration gardient of PBS, and then the surface tension gradient. Recent study have shown that such gradient can be as well caused by an active capture of the moving surface [51]. This surface tension gradient also slowly decreases the outward flow, then decreasing the mean divergence (Fig.2).
B. Stage II: Marangoni recirculation cells
After approximately 300 s, a flow pattern correspond-ing to Marangoni instability cells is observed. Actually, Rayleigh-B´enard instabilities could also lead to similar convection cells. However, since our drops are smaller than the capillary length, this gravity-driven flow is not plausible in our system. This implies that we observe a Marangoni recirculation, driven by a gradient of surface tension. This flow creates a honeycomb-like structure with the particles which are trapped at the surface, in all probability due to some partial unwetting as observed previously in other systems. [42] The detailed analysis of the 2D velocity’s divergence (row b in Fig.1) allows to clearly see those structures, with the alternation of re-gions where particles strongly converge with areas where particles strongly diverge. The mean 2D divergence,
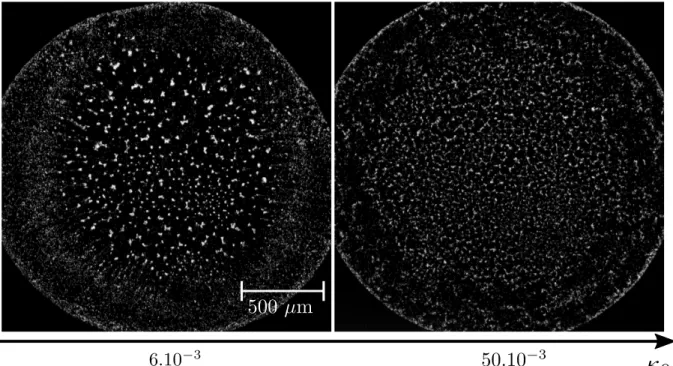
ob-FIG. 3. Comparisons of two droplets containing different concentrations of PBS. When the PBS concentration increases, the size of the Marangoni recirculation cells decreases. The resulting pattern then resists better to the outward flow of the stage IV . The two pictures of this figure, obtained by fluorescence microscopy, were taken after approximately 1000 s of evaporation.
served near the bottom plate, is then almost constant, but slightly negative (Fig.2). Indeed, when observed near the bottom plate, the velocity filed still converges towards the edge of the droplet near its boundaries, creating a bias in the mean value.
Such a surface tension gradient is often produced by a temperature gradient, but temperature gradients along surface of evaporating droplets appear almost instantly and only decrease along time. [36, 40] It is then not plau-sible that the observed delayed instability is driven by temperature gradient. Moreover, we noticed that modi-fying the PBS concentration modifies the size of the cells, which can also not be explained by temperature gradi-ents. In our case, the most probable explanation is then that the gradient of PBS concentration creates the sur-face tension gradient responsible for such instability.
The time at which this transition occurs is consis-tent with a magnitude order analysis, as we demon-strate here. Let us first consider a Marangoni num-ber M a = (∂γ∂κ 4 κ tf)/(η R) adapted from thermal
Marangoni number, [36, 40] where γ is the surface ten-sion of the fluid, κ ≡ Ci/Ci(P BS) is a dimensionless
volumic concentration defined as the ratio between the concentration Ciof any ionic component of the PBS over
the concentration Ci(P BS) of the same component in
the stock solution of PBS, tf ≈ 1600 s is the drying time,
η ≈ 10−3Pa s is the viscosity of the fluid and R ≈ 10−3m is the radius of the droplet’s contact line (often iden-tified as the droplet’s radius). The typical Marangoni number M a at which Marangoni instability occurs is of the order of M ac ≈ 102. [36, 40, 42] We measured that
∂γ ∂κ ≈ 10
−4N/m from the pending drop method
measure-ments performed with a CAM 200 apparatus from KSV instruments LTD (Supplementary Material contains the data[47]). The difference of concentration 4κ can be as-sessed from several hypotheses. First of all, we assume that every ionic component of the PBS has the same dis-tribution profile along the droplet radius, when normal-ized by its total amount. This ensures the definition of κ does not change when another component of the PBS is used to define its value. Then, since during the stage I the fluid in the center of the droplet globally flows to the edge of the drop, we assume that the concentration of the ions near the center of the droplet is close to the initial concentration κ0≈ 10−2 before the droplet begins
to evaporate. Eventually, we estimate that the concen-tration of ions near the droplet of the edge is of the order of magnitude of the average concentration κm= κ0V0/V ,
where V0is the initial volume and V is the current volume
of the drop. Since the volume of the droplet decreases linearly with time t, in the pinned contact line regime we observed, we can write V ≈ V0(tf − t)/tf. [30, 52]
The difference of concentration can then be assessed as 4κ ≈ κ0t/(tf − t). After t = 350 s of evaporation, we
then obtain a Marangoni number of
M a ≈
∂γ
∂κ κ0tf t
η R (tf− t)
≈ 102 (1)
which is then the order of usual critical Marangoni num-bers M ac above which Marangoni instability occurs.
5
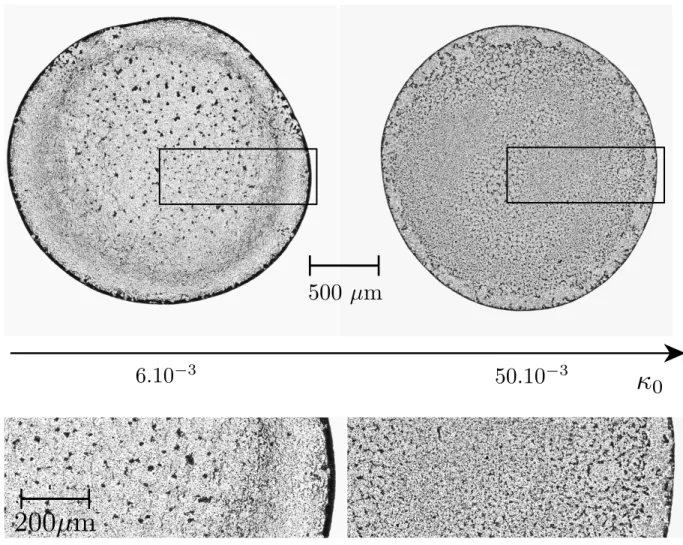
FIG. 4. Comparisons of two dried deposits from droplets containing different concentrations of PBS. The pictures are obtained from bright field observation. When the PBS concentration increases, the particles are deposited more homogeneously all over the deposit. On a smaller scale, the pattern produced by the Marangoni instability is almost unaffected in the dried pattern. The bottom pictures are a zoom of the box in the upper pictures.
C. Stage III : Cheerios collapse
At the end of the second stage, the honeycomb-like structure collapses near the center of the surface, decreas-ing the size of the pattern’s cells. Durdecreas-ing this stage III, there is an inward surface flow while the flow near the substrate is an outward flow corresponding to the usual mass conservation flow creating the coffee ring. In Fig.2, however, one can still see a negative peak corresponding to the convergence of the particles of the surface struc-tures. Indeed, the chosen focal plane is slightly above the bottom plate (in order to avoid noise from wall interac-tion), and the drop is then thin enough for the surface to be seen in the focal plane. Moreover, the detailed mo-tion of the structure during this stage is highly depending on the geometry of the droplet and the resulting honey-comb structure. Regarding quantitative data, it is then the stage with the highest noise amongst the four stages we identified.
We believe the inward surface flow is due to the
Cheerios attraction between the particles forming the honeycomb-like pattern. This is pretty hard to assess theoretically since we do not have any accurate idea on the contact angle between the spheres or their actual wetting and also because interaction of capillary charged particles is still challenging to model, especially for short distances, even on flat surfaces. [53–55] However, it has already been shown that Cheerios interactions can lead to structures of colloids and can even prevent the cof-fee ring effect, leading to flows similar to this collapse. [56, 57] The method used in those previous studies to verify that the Cheerios effect is responsible for struc-tures or motion is adding surfactants in the suspension to modify those interactions. Nonetheless, such an addi-tion of surfactants in our system would prevent or modify the Marangoni flow mechanism as well as the resulting pattern and can then not be used to check this hypoth-esis in our case. This will then be the focus of future studies. On the other hand, the fact that an outward flow occurs again in the system near the substrate can
0 0.2 0.4 0.6 0.8 1 1.2 1.4 1.6 1.8 2 0 0.2 0.4 0.6 0.8 1 ρ /N r/R κ0=6.10-3 κ0=10.10-3 κ0=50.10-3
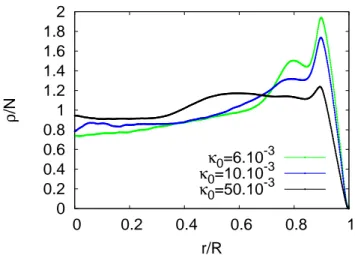
FIG. 5. Mean surface density of the dried agglomerates nor-malized by the number of particles (so that the integral of the curve is equal to one) as a function of the radial distance, for the various PBS concentration. For high PBS concentration the coffee ring effect is mainly countered, since the averaged density of the deposited particles is mainly uniform along the droplet’s radius. Error bars are not shown in order to avoid overloading of the curves, however maximal standard devia-tion is below 10% of the curve value.
be understood from the dependence of velocities on the geometry of the droplet. Indeed, Hu and Larson have shown that the velocity field from Marangoni flow and the mass conservation flow linearly superimpose. [40] From their equations, we can also identify that the ra-dial velocity depends on the geometry of the droplet as vCR ∼ 2 h0 R/(h tf) for the mass conservation flow and
vM a ∼ M a h h0/(R tf) for the Marangoni flow, where
h0is the initial height of the droplet and h is the current
height. The ratio of these two flows then behaves as vCR
vM a
∼ R
2
M a h2.
If we assume the Marangoni number does not change too much after the apparition of the Marangoni instability and we take into account the fact that the particles can still move for a height as small as h ≈ 10−6 m, since the radius is pinned at R = 10−3 m, it is easy to understand there is a time where the outward flow will destabilize the Marangoni instability since this ratio can reach values as high as vCR
vM a ≈ 10
4at the end of the evaporation process.
D. Stage IV : Outward flow and deposition
During stage IV , the bottom outward flow observed previously is the only flow remaining in the droplet. In Fig.2, a corresponding peak in the divergence is observed, in agreement with values of stage I. The outward flow can be so strong that it eventually breaks down the honeycomb-like structure formed by the Marangoni recir-culation cells. However, this latter observation strongly
depends on the initial concentration of PBS in the droplet κ0, as illustrated in Fig. 3. There are two mechanisms
by which the concentration of PBS can modify the inter-locking resistance and morphology of those structures. First of all, the PBS will screen electrostatic repulsion between the particles, which makes them more likely to irremediably aggregate, as well described in the DLVO theory. [58] Moreover, we have shown in Eq.(1) that the Marangoni number M a is proportional to the initial PBS concentration κ0. Since the size of the Marangoni cells
λ ∝ M a−12 is inversely proportional to the square root of the Marangoni number M a, [42, 59] this then implies that an increase of initial PBS concentration κ0 will give
rise to smaller cells. Those observations are illustrated in Fig. 3.
Those variations have a strong influence on the eventu-ally dried deposit of the droplet. Indeed, high initial PBS concentration κ0maintains the honeycomb-like structure
created by the Marangoni recirculation even in the dried deposit, contrary to the low PBS concentration as illus-trated in Fig. 4. The presence of this structure is then able to decrease and mainly prevent the coffee-ring ef-fect. This can be qualitatively observed on the pictures of Fig. 4. A more quantitative analysis of the deposits can be performed by computing the mean surface den-sity ρ of the deposit. We computed this quantity as a function of the relative distance from the centre r of the deposit, normalized by the radius R of the deposit. We then normalized it by its integral N =R1
0 ρ(δ)dδ, where
δ = Rr. This normalization enhances the relative varia-tion values and ensures that no difference in lightening are taken into account. Resulting curves are presented in Fig. 5. As it can be concluded from those curves, the initial PBS concentration κ0is a parameter which allows
to switch continually from a classical coffee-ring deposit (see κ0 = 6. 10−3 curve in Fig. 5) to a much more
ho-mogeneous deposit where the density of particles in the center and at the edge are comparable (see κ0= 50. 10−3
curve in Fig. 5).
IV. CONCLUSION
Our experiments evidenced the different flow steps in-duced by a solutal Marangoni flow in a sessile droplet by using PIV on various height of the droplet. Moreover, we were able to model most of the transitions and enhanced how the initial concentration of PBS influences the flow mechanisms by using simple dimension analysis. This analysis shows the key mechanism to understand the flow behavior is the competition between solutal Marangoni and mass conservation flow. We also showed that this influence can be used to control the dried deposit prop-erties. Actually, we showed that a sufficient initial PBS concentration maintains the structure formed in the pre-vious satge of evaporation. This looks like a promising way to control the deposition of other structures, like those obtained from self-assembled magnetic or Janus
7
colloidal particles.
CONFLICTS OF INTEREST
There are no conflicts to declare.
ACKNOWLEDGEMENTS
A.D. is financially supported by FNRS as research fel-low. This work was financially supported by the FNRS (Grant PDR T.0043.14) and by the University of Li`ege (Starting Grant C-13/88).
[1] J. S. Andreu, J. Camacho, and J. Faraudo, Soft Matter 7, 2336 (2011).
[2] J. H. Promislow, A. P. Gast, and M. Fermigier, J. Chem. Phys. 102, 5492 (1995).
[3] P. Dom´ınguez-Garc´ıa, J. Pastor, and M. Rubio, Eur. Phys. J. E 34, 1 (2011).
[4] A. Darras, E. Opsomer, N. Vandewalle, and G. Lumay, Scientific reports 7, 7778 (2017).
[5] J. Faraudo, J. S. Andreu, and J. Camacho, Soft Matter 9, 6654 (2013).
[6] A. Darras, J. Fiscina, M. Pakpour, N. Vandewalle, and G. Lumay, The European Physical Journal E 39, 1 (2016).
[7] N. Rojas, A. Darras, and G. Lumay, Physical Review E 96, 012608 (2017).
[8] A. Darras, J. Fiscina, N. Vandewalle, and G. Lumay, American Journal of Physics 85, 265 (2017).
[9] H. Ezzaier, J. Alves Marins, I. Razvin, M. Abbas, A. Ben Haj Amara, A. Zubarev, and P. Kuzhir, The Journal of Chemical Physics 146, 114902 (2017).
[10] K. S. Khalil, A. Sagastegui, Y. Li, M. A. Tahir, J. E. Socolar, B. J. Wiley, and B. B. Yellen, Nat. Commun. 3, 794 (2012).
[11] Y. Gurevich, Y. Mankov, and R. Khlebopros, Dokl. Phys. 11, 478 (2013).
[12] F. Martinez-Pedrero and P. Tierno, Phys. Rev. Applied 3, 051003 (2015).
[13] H. Carstensen, V. Kapaklis, and M. Wolff, Phys. Rev. E 92, 012303 (2015).
[14] K. M¨uller, N. Osterman, D. Babiˇc, C. N. Likos, J. Dob-nikar, and A. Nikoubashman, Langmuir 30, 5088 (2014). [15] M. Llera, J. Codnia, and G. A. Jorge, J. Magn. Magn.
Matter 384, 93 (2015).
[16] R. M. Erb, H. S. Son, B. Samanta, V. M. Rotello, and B. B. Yellen, Nature 457, 999 (2009).
[17] F. Martinez-Pedrero and P. Tierno, Phys. Rev. Applied 3, 051003 (2015).
[18] F. Martinez-Pedrero, A. Ortiz-Ambriz, I. Pagonabarraga, and P. Tierno, Phys. Rev. Lett. 115, 138301 (2015). [19] H. Carstensen, V. Kapaklis, and M. Wolff, Phys. Rev. E
92, 012303 (2015).
[20] P. Liu, J. W. De Folter, A. V. Petukhov, and A. P. Philipse, Soft Matter 11, 6201 (2015).
[21] K. V. Edmond, H. Park, M. T. Elsesser, G. L. Hunter, D. J. Pine, and E. R. Weeks, Chaos-Woodbury 21, 041103 (2011).
[22] R. Dreyfus, J. Baudry, M. L. Roper, M. Fermigier, H. A. Stone, and J. Bibette, Nature 437, 862 (2005).
[23] T. Yakhno, O. Sedova, A. Sanin, and A. Pelyushenko, Technical Physics 48, 399 (2003).
[24] T. A. Yakhno, V. G. Yakhno, A. G. Sanin, O. A. Sanina, A. S. Pelyushenko, N. A. Egorova, I. G. Terentiev, S. V. Smetanina, O. V. Korochkina, and E. V. Yashukova,
IEEE engineering in medicine and biology magazine 24, 96 (2005).
[25] D. Brutin, B. Sobac, B. Loquet, and J. Sampol, Journal of Fluid Mechanics 667, 85 (2011).
[26] L. Lanotte, D. Laux, B. Charlot, and M. Abkarian, Phys-ical Review E 96, 053114 (2017).
[27] K. Sefiane, Journal of Bionic Engineering 7, S82 (2010). [28] J.-H. Kim, S.-B. Park, J. H. Kim, and W.-C. Zin, The
Journal of Physical Chemistry C 115, 15375 (2011). [29] K. Sefiane, Advances in colloid and interface science 206,
372 (2014).
[30] H. Y. Erbil, Advances in colloid and interface science 170, 67 (2012).
[31] R. D. Deegan, O. Bakajin, T. F. Dupont, G. Huber, et al., Nature 389, 827 (1997).
[32] R. D. Deegan, O. Bakajin, T. F. Dupont, G. Huber, S. R. Nagel, and T. A. Witten, Physical review E 62, 756 (2000).
[33] A. G. Mar´ın, H. Gelderblom, D. Lohse, and J. H. Snoei-jer, Phys. Rev. Lett. 107, 085502 (2011).
[34] ´A. G. Mar´ın, H. Gelderblom, D. Lohse, and J. H. Snoei-jer, Physics of fluids 23, 091111 (2011).
[35] R. G. Larson, AIChE Journal 60, 1538 (2014). [36] H. Hu and R. G. Larson, Langmuir 21, 3972 (2005). [37] R. Bennacer and K. Sefiane, Journal of Fluid Mechanics
749, 649 (2014).
[38] J. R. Christy, Y. Hamamoto, and K. Sefiane, Physical review letters 106, 205701 (2011).
[39] T. Still, P. J. Yunker, and A. G. Yodh, Langmuir 28, 4984 (2012).
[40] H. Hu and R. G. Larson, The Journal of Physical Chem-istry B 110, 7090 (2006).
[41] H. Kim, F. Boulogne, E. Um, I. Jacobi, E. Button, and H. A. Stone, Physical review letters 116, 124501 (2016). [42] V. X. Nguyen and K. J. Stebe, Physical Review Letters
88, 164501 (2002).
[43] G. Chen and G. J. Mohamed, The European Physical Journal E 33, 19 (2010).
[44] Z. S. Davidson, Y. Huang, A. Gross, A. Martinez, T. Still, C. Zhou, P. J. Collings, R. D. Kamien, and A. Yodh, Nature Communications 8, 15642 (2017).
[45] X. Fanton and A. Cazabat, Langmuir 14, 2554 (1998). [46] L. M. Pegram and M. T. Record, The journal of physical
chemistry B 111, 5411 (2007).
[47] [See supplementary materials at [URL will be inserted by Editor] for Surface tension measurements and illustrative videos of the evaporation flows.].
[48] T. Cosgrove, Colloid science: principles, methods and applications (John Wiley & Sons, 2010).
[49] W. Thielicke and E. Stamhuis, Journal of Open Research Software 2, e30 (2014).
[50] W. Thielicke, E. Stamhuis, W. Thielicke, and E. Stamhuis, DOI 10, m9 (2014).
[51] S. J. Kang, V. Vandadi, J. D. Felske, and H. Masoud, Physical Review E 94, 063104 (2016).
[52] A.-M. Cazabat and G. Guena, Soft Matter 6, 2591 (2010).
[53] M. Nicolson, in Mathematical Proceedings of the Cam-bridge Philosophical Society, Vol. 45(2) (CamCam-bridge Uni-versity Press, 1949) pp. 288–295.
[54] P. A. Kralchevsky and K. Nagayama, Advances in colloid and interface science 85, 145 (2000).
[55] D. Vella, Am. J. Phys. 73, 817 (2005).
[56] P. Kralchevsky, N. Denkov, V. Paunov, O. Velev, I. Ivanov, H. Yoshimura, and K. Nagayama, Journal of Physics: Condensed Matter 6, A395 (1994).
[57] P. J. Yunker, T. Still, M. A. Lohr, and A. Yodh, Nature 476, 308 (2011).
[58] J. N. Israelachvili, Intermolecular and surface forces: re-vised third edition (Academic press, 2011).