HAL Id: hal-01858450
https://hal.archives-ouvertes.fr/hal-01858450
Submitted on 21 Aug 2018
HAL is a multi-disciplinary open access
archive for the deposit and dissemination of
sci-entific research documents, whether they are
pub-lished or not. The documents may come from
teaching and research institutions in France or
abroad, or from public or private research centers.
L’archive ouverte pluridisciplinaire HAL, est
destinée au dépôt et à la diffusion de documents
scientifiques de niveau recherche, publiés ou non,
émanant des établissements d’enseignement et de
recherche français ou étrangers, des laboratoires
publics ou privés.
Get ready for automated driving using Virtual Reality
Daniele Sportillo, Alexis Paljic, Luciano Ojeda
To cite this version:
Daniele Sportillo, Alexis Paljic, Luciano Ojeda. Get ready for automated driving using Virtual Reality.
Accident Analysis and Prevention, Elsevier, 2018, 118, pp.102-113. �10.1016/j.aap.2018.06.003�.
�hal-01858450�
Get Ready for Automated Driving using Virtual Reality
Daniele Sportilloa,b,∗, Alexis Paljica, Luciano Ojedab
aMINES ParisTech, PSL Research University, Centre for robotics, 60 Bd St Michel 75006 Paris, France bPSA Group, Technical Center of Velizy
Abstract
In conditionally automated vehicles, drivers can engage in secondary activities while traveling to their destination. However, drivers are required to appropriately respond, in a limited amount of time, to a take-over request when the system reaches its functional boundaries. Interacting with the car in the proper way from the first ride is crucial for car and road safety in general. For this reason, it is necessary to train drivers in a risk-free environment by providing them the best practice to use these complex systems. In this context, Virtual Reality (VR) systems represent a promising training and learning tool to properly familiarize drivers with the automated vehicle and allow them to interact with the novel equipment involved. In addition, Head-Mounted Display (HMD)-based VR (light VR) would allow for the easy deployment of such training systems in driving schools or car dealerships. In this study, the effectiveness of a light Virtual Reality training program for acquiring interaction skills in automated cars was investigated. The effectiveness of this training was compared to a user manual and a fixed-base simulator with respect to both objective and self-reported measures. Sixty subjects were randomly assigned to one of the systems in which they went through a training phase followed by a test drive in a high-end driving simulator. Results show that the training system affects the take-over performances. Moreover, self-reported measures indicate that the light VR training is preferred with respect to the other systems. Finally, another important outcome of this research is the evidence that VR plays a strategic role in the definition of the set of metrics for profiling proper driver interaction with the automated vehicle.
Keywords: conditionally automated vehicles, virtual reality, head-mounted display, take-over request, training
1. Introduction
Imagine you are reading this article in your car as you drive on the highway. Suddenly, your car asks you to “take-over”. What would you do? At the time of writ-ing, this scenario breaks numerous laws and is potentially
5
very dangerous. In the future, it would not only be le-gal and safe, but you would likely know how to react to your car’s demands to hand over control, keeping yourself, passengers, and other vehicles out of harm’s way.
In future automated vehicles the above situation would
10
be fairly common. In particular, conditionally automated vehicles (SAE Level-3 [1]) do not require drivers to con-stantly monitor their driving environment; they can, there-fore, engage in secondary activities such as reading, writ-ing emails and watchwrit-ing videos. However, when the
au-15
tomated system encounters unexpected situations, it will assume that drivers who are sufficiently warned will ade-quately respond to a take-over request.
The reestablishment of the driving context (i.e. rapid onboarding) is one challenge of conditionally automated
20
vehicles [2] for the car industry. The revolution of the driving activity, the complexity of these new systems and
∗Corresponding author
Email address: [email protected], mines-paristech.fr (Daniele Sportillo)
the variety of situations that the driver can face requires that drivers must have already acquired the core skills nec-essary to securely interact with the automated car before
25
their first ride. Establishing drivers’ role and avoiding con-fusion [3] is crucial for the safety of both the drivers them-selves and other road users.
At present, a vehicle’s functionalities are demonstrated to customers via an informal presentation by the car dealer
30
during the hand-over process; for further information, cus-tomers are required to read the car owner’s manual. For an automated vehicle, these traditional procedures would not be feasible to familiarize the new car owner with the auto-mated system, primarily because the acquisition of skills
35
by the customer is not ensured. In addition, car dealers themselves must be trained and kept up to date of each new version of the system.
In this context, Virtual Reality (VR) constitutes a po-tentially valuable learning and skill assessment tool which
40
would allow drivers to familiarize themselves with the au-tomated vehicle and interact with the novel equipment involved in a free-risk environment. VR allows for the possibility of encountering dangerous driving conditions without putting the driver at physical risk and enable the
45
controllability and reproducibility of the scenario condi-tions [4].
huge computational power. For these reasons immersive training based on CAVEs or Head-Mounted Displays has
50
until now been prohibitive in mainstream settings. How-ever, in recent years, technological progress and the in-volvement of dominant technology companies has allowed the development of affordable VR devices.
The objective of this research is to explore the
poten-55
tial of the role of light Virtual Reality systems, in particu-lar, for the acquisition of skills for the Transfer of Control (ToC) in highly automated cars. By using the adjective light, we want to mark the difference between VR systems that are portable and/or easy to set up (HMDs, mobile
60
VR) and systems that are cumbersome and require dedi-cated space to operate (CAVE systems). The idea is that thanks to the portability and the cost-effectiveness, light VR systems could be easily deployed in car dealerships to train a large amount of people in an immersive
environ-65
ment in a safe and reliable way.
The light VR system proposed in this paper consists of a consumer HMD and a racing wheel. This paper aims to compare the effectiveness of a training program based on this system with a user manual and with a fixed-base
driv-70
ing simulator. To validate the light VR system, user per-formances are evaluated during a test drive in a high-end driving simulator and self-reported measures are collected via questionnaires.
1.1. Related work
75
Virtual Reality has been extensively used to train pro-fessionals and non-propro-fessionals in various domains. The unique characteristics of learning in the 3D environment provided by immersive VR systems such as CAVEs or HMDs, can enable learning tasks that are not possible or
80
not as effective in 2D environments provided by traditional desktop monitors. Dalgarno et al. [5] highlighted the ben-efits of this kind of 3D Virtual Learning Environments (3D VLEs) by proposing a model based on their distinctive fea-tures such as the representational fidelity and the learner
85
interaction.
More in detail, HMD-based VR turns out to be more effective when compared to other training systems, for a wide range of applications such as surgery [6] (HMD com-pared to video trainer), aircraft visual inspection [7] (HMD
90
compared to PC-based training tool), power production [8] (HMD compared to traditional training), mining industry [9] (HMD compared to screen-based and projector-base training).
When it comes to Driving Simulation (DS), VR is used
95
to study several aspects of the driving task. In this con-text, moving-base simulators [10] are preferable to fixed-base simulators [11, 12] for their closer approach to real-world driving [13].
By investigating the physical, behavioral and cognitive
100
validity of these kind of simulators with respect to the real driving task [11], it has been also shown that DS can be a useful tool for the initial resumption of driving, because
it helps to avoid stress that may lead to task failure or deterioration in performance.
105
Although most of the studies in DS uses static screens as the display system, recent studies prove that HMD-based DS leads to similar physiological response and driv-ing performance when compared to stereoscopic 3D or 2D screens [14]. Taheri et al. [15] presented a VR DS system
110
composed of HMD, steering wheel and pedals to analyze drivers’ characteristics; Goedicke et al. [16] instead pro-posed an implementation of an HMD in a real car to sim-ulate automated driving as the vehicle travels on a road. Even if the steering wheel is the most used driving
in-115
terface, novel HMD systems usually come with wireless 6-DoF controllers which can be used to control a virtual car. In a pilot study, Sportillo et al. [17] compare steering wheel and controller-based interaction in HMD-based driv-ing simulators. The authors conclude that even though
120
objective measures do not provide decisive parameters for determining the most adequate interaction modality, self-report indicators show a significant difference in favor of the steering wheel.
Among other things, DS provides the opportunity to
125
implement, in a forgiving environment, critical scenarios and hazardous situations which are ethically not possi-ble to evaluate on real roads [18]. For this reason and to overcome the limited availability of physical prototypes for research purposes, DS is extensively used for studies on
130
automated vehicles to design future automotive HMI [19] for Take-Over Requests (TORs) and to investigate the be-havioral responses during the transition from automated to manual control [20].
A research area that is gaining interest in the
auto-135
mated driving community concerns the impact of non-driving activities on take-over performance. To study driver’s distraction during automated driving, researchers gener-ally use standardized and naturalistic tasks. Standardized tasks (such as the cognitive n-back task [21], the SuRT task
140
[21, 22], the Twenty Questions Task (TQT) [23]) provide experimental control, but they do not usually correspond to what the driver will do in the vehicle. Naturalistic tasks, instead, provide ecological validity, but they could intro-duce experimental bias. Important findings were found
145
by Zeeb et al. [24] who studied how visual-cognitive load impacts take-over performance by examining the engage-ment in three different naturalistic secondary tasks (writ-ing an email, read(writ-ing a news text, and watch(writ-ing a video clip). The authors found that the drivers’ engagement in
150
secondary tasks only slightly affected the time required to regain the control of the vehicle, but non-distracted drivers performed better in the lane-keeping task.
Most of the studies in this domain implement safety-critical take-over scenarios caused by an obstacle (usually a
155
broken down vehicle) on the current lane [24, 17, 21, 25, 23] and non-critical scenarios caused by the absence of lane markings [24, 26]. To ensure security and to succeed in the take-over process, it is important to understand how much time before a system boundary a driver who is out
of the loop should be warned. Gold et al. [22] indicate that shorter TOR-time leads to a faster but worse reac-tion. However, assessing the quality of the take-over per-formance remains an open problem. Reaction times (such as gaze reaction time, hands on wheel time, and
interven-165
tion time) are analyzed [21]. Time To Collision, lateral ac-celerations and minimum clearance towards are objective metrics used in obstacle avoidance scenarios [21]. Con-cerning subjective measures, drivers are usually asked to reply to questionnaires: the Driver Skill Inventory (DSI)
170
[27] and Driver Behaviour Questionnaire (DBQ) [28] have been largely used to evaluate the self-assessment of driv-ing skills [29] in the last decades. In recent studies, ques-tionnaires have been used to investigate the importance of initial skilling and to predict the deskilling in automated
175
vehicles [30]. In the same field, surveys have also been used to evaluate usefulness and satisfaction of take-over requests [31].
In the above studies it is not always clear how partic-ipants were taught to use the automated system. Zeeb et
180
al. [24] used a traditional approach that provided the par-ticipants with a description of the system, the functional boundaries and the alert notifications. In the vehicle, par-ticipants were also instructed to activate and deactivate the automated driving system. This approach could not
185
be adapted to the real case because it does not ensure the correct acquisition of knowledge; thus, the drivers would not be sufficiently skilled to safely respond to a take-over request. In other studies participants could freely practice in the high-end driving simulator before the actual test
190
drive [22]. This solution would not be feasible in terms of costs, space and maintenance because it would require every car dealership to be equipped with a simulator. A lighter VR system, such as the one proposed in this pa-per, could instead be more easily deployed and used for
195
training purposes at a much lower cost.
Payre et. al [26] addressed the problem of drivers’ training in an automated car by comparing two types of training: a simple training based only on practice in a driv-ing simulator and an elaborated traindriv-ing which included
200
a text, a tutorial video and a more elaborated practice in the simulator. They found that participants in the elabo-rated training group trusted more the automated driving and were able to take-over faster than those in the simple training group.
205
Automated car research also has relevance in the field of aviation [32], and in particular in studies concerning flight simulation for pilot training [33]. Although this kind of training is targeted towards professionals, impor-tant findings from this research include the occurrence of
210
positive transfer and the fact that abstracted rendering simulators allow people to learn better than with the real thing [34]. Pilots trained on a simulator are thus able to co-pilot a craft immediately after their simulation train-ing [33]. However, it is crucial that the traintrain-ing practices
215
allow for the generalization of the skills acquired in the virtual environment and not only for an application of the
rote-memorized skills specific to the training situation [35]. The considerable findings from aviation and the intense scientific production in recent years suggest that the
tran-220
sition of control in automated cars is a valuable research topic worth investigating from the design stage to the fi-nal implementation of the new systems. Moreover, the compelling need and interest of the car industry to train a large amount of people in a reliable and cost-effective way,
225
without compromising security, make light virtual reality system tools a promising solution for this purpose. 2. Methods
This study contained two parts: training and test drive. The aim of the training was to introduce the principles of
230
the Level 3 Automated Driving System (ADS)-equipped vehicle, present the novel Human-Machine Interface (HMI), help the drivers to localize the HMI in the vehicle, and describe the actions to perform in order to appropriately respond to unplanned requests to intervene. The
between-235
subject study with 60 participants was designed in order to compare a light Virtual Reality system to a user man-ual and a fixed-base driving simulator in terms of training effectiveness evaluated through a test drive. The test drive required the application of knowledge and skills acquired
240
during the training. 2.1. The target vehicle
This study takes into account Level 3 (Conditional Driving Automation) automated vehicles. In this level of automation the ADS performs the Dynamic Driving Task
245
(DDT) with the expectation that the human driver is ceptive to a Take-Over Request (TOR), also known as re-quest to intervene, and will respond appropriately. The DDT includes [1] lateral vehicle motion control via steer-ing; longitudinal vehicle motion control via acceleration
250
and deceleration; monitoring the driving environment via object and event detection, recognition, classification, and response preparation; object and event response execu-tion; maneuver planning; enhancing conspicuity via light-ing, signaling and gesturlight-ing, etc.
255
For a more detailed taxonomy and description please refer to the Recommended Practice by SAE [1]. A TOR is a notification by the ADS to a human driver that s/he should promptly begin or resume performance of the DDT. Unplanned TORs are prompted by the ADS when it reaches
260
system boundaries because of unpredictable and poten-tially hazardous situations that it cannot handle. These situations could be represented by an obstacle on the road, missing road markings or system failure. The target ve-hicle provided two driving modes on highways: Manual
265
Driving and Conditionally Automated Driving. The vehi-cle was not expected to execute automatic lane changes.
In the implementation the vehicle had 5 possible states: (a) Manual driving: the human driver is in charge of all the aspects of the dynamic driving task (execution
270
(b) ADS available: the human driver can transfer control to the ADS, by operating the HMI.
(c) ADS enabled: the ADS performs all the aspects of the dynamic driving task, namely the control of the
275
longitudinal and the lateral guidance.
(d) Take-over request: the ADS reaches a system bound-ary and thus is no longer able to perform the dy-namic driving task. The human driver is notified with a visual-auditory alert indicating the time
bud-280
get s/he has to take-over.
(e) Emergency brake: the human driver does not take over in the allotted amount of time and the vehicle performs an emergency brake on the lane. The alert continues until the control is transferred back to the
285
human driver.
When the ADS was activated, the car kept a constant longitudinal speed of 90 km/h, accelerating or decelerating if the speed at the activation was respectively lower or higher.
290
2.1.1. Human-Machine Interface
The Human-Machine Interface in the target vehicle consisted of a head-up display (HUD) and a button on the steering wheel. The HUD (see Figure 1) showed infor-mation about current speed, speed limit, distance traveled
295
and current state of the vehicle. In Figure 1, the different symbols representing the states of the system are illus-trated; the arrows indicate the possible transition between states. The symbols are taken from previous studies [36]. The background color of the HUD also changed according
300
to the current state of the vehicle.
Take-over requests were notified to the human driver with a visual-auditory alert. The visual alert consisted of the symbol in Figure 1d with a countdown indicating the budget of time available to take over. The auditory alert
305
was a 0.7 second beep looped every second.
In the implementation of the automated driving sys-tem, the human driver could activate the ADS (if avail-able) by pushing a button on the steering wheel. When the ADS was enabled, at any time the human driver could
de-310
activate it and immediately take back control. This could be done in three ways: (i) pushing the same button on the steering wheel, (ii) using the brake pedal, or (iii) using the accelerator pedal and the steering wheel.
Since all the participants were French speakers, all the
315
text in the HMI was displayed in French to avoid language comprehension problems.
2.2. The training
The aim of the training was to teach drivers how to in-teract with automated cars in three situations: the manual
320
mode, automated mode and the take-over request. To do so, the training introduced the participants to the HMI for each situation, the actions they were free to perform
Figure 1: The HUD of the target vehicle and the symbols that rep-resent the states of the vehicle: (a) manual driving, (b) autonomous driving system available (c) autonomous driving system activated, (d) take over request with countdown, (e) emergency brake. The arrows represent the possible transition between the states.
during the automated driving and the best practice to re-spond to a take-over request. For all the participants,
325
the training program started with an introduction video that briefly presented the main functionalities of a Level 3 ADS-equipped car. The video was displayed onto a differ-ent support according to the display system used during the training.
330
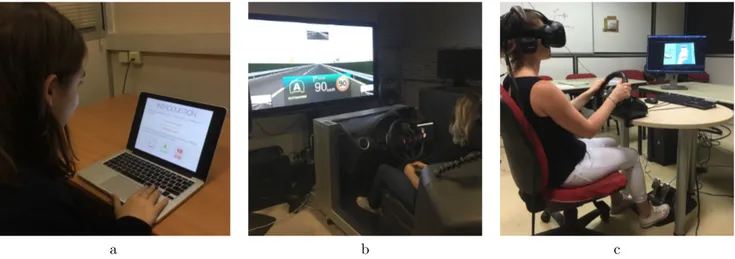
In the study three different training systems were com-pared (Figure 2)
• a User Manual (UM) displayed on a laptop;
• a Fixed-Base driving simulator (FB) with real cock-pit and controls (pedals and steering wheel);
335
• a Light Virtual Reality (LVR) system consisting of a Head-mounted display (HMD) and a game racing wheel.
These systems differed in terms of level of immersion and interaction they provided. “Immersion” refers to the
tech-340
nological capabilities a system is able to deliver from an objective point of view [37]. “Interaction” refers to the modality through which the user can perform actions in the virtual environment. Immersion and interaction do not apply to the User Manual group. The fixed-base
driv-345
ing simulator and the LVR system shared the same inter-action modalities, but the level of immersion was different. In what follows, the three systems are described.
2.2.1. User manual training
The user manual (UM) consisted of a slide presentation
350
displayed on a 13.3” screen of a laptop computer (Fig-ure 2a). First, the introduction video was played. Then, the participants were asked to carefully read each of the 8 slides and to go to the next one when they felt ready. They did not have any time limit. The slides used text and
355
images to present the actions to be performed during the manual driving, the automated driving and the take-over requests. For each situation the correspondent icons were also presented. An animated slide was included to show how to activate the automated driving.
360
This system represented the immersive and non-interacting training environment. The participants could only browse forward and backward the slides, with no time
a b c
Figure 2: The three training systems: (a) the user manual displayed on the laptop computer, (b) the fixed-base driving simulator, (c) the light VR system
limit; however, they were not involved in a driving situa-tion and they could not practice the acsitua-tion required with
365
the real equipment.
2.2.2. Fixed-base simulator
The fixed-base simulator (FB) consisted of an actual car cockpit including a driving seat, a dashboard, a force-feedback steering wheel and a set of pedals (Figure 2b).
370
All of these components were real components of a Cit-roen C3; this allowed participants to have a more natural interaction with the driving controls. A 9.7” tablet used by the driver to perform the secondary activity was placed in the center console. To display the virtual environment
375
a 65” plasma screen was positioned behind the cockpit at 1.5m from the driver.
This simulator represented the low-immersion training environment. The limited size of the screen did not allow the implementation a 1:1 scale between the virtual and
380
the real world. Also, another implication of the reduced field of view was the lack of isolation for the participant who was surrounded by the experimental room during the training.
2.2.3. Light Virtual Reality system
385
The light VR system (LVR) included an HMD as a dis-play system, and a Logitech G25 Racing Wheel as driving system (Figure 2c). The HMD was an HTC Vive which provides stereoscopic vision at 90 FPS, 2160 x 1200 (1080 x 1200 per eye) resolution, a field of view of 110 degrees
390
and low-latency positional tracking. Spatial sound was presented via headphones. Thanks to these features, the LVR system represented the high-immersion training sys-tem. The trainee was totally surrounded by the virtual environment, but once wearing the headset s/he lost the
395
possibility to see any part of his/her own body. Although the field of view of the HTC Vive is not comparable with the human vision, the design choices for the training sce-nario (no traffic, straight lane) helped to reduce the stimuli
in the peripheral vision, which is one of the causes of
sim-400
ulator sickness [38].
At the beginning, the participants were immersed in a virtual room with white walls. This room represented a transitional environment from the real world to the vir-tual learning activity. A transparent effect was applied
405
(Figure 3a) to the car to ease the transition to the vir-tual world. The introduction video was displayed on the front wall. We hypothesized that, at the beginning of the experiment, a simpler environment with a few visual el-ements could help participants better accept the system
410
[39]. The purpose of this environment was twofold. First, novices of Virtual Reality and participants who were us-ing an HMD for the first time could become familiar with the new system by experiencing the effects of their actions (head rotation, head movement) on the system. Second,
415
since the participants could not see their hands, they could become aware of the car controls, identifying the position of the steering wheel, the button on the steering wheel, and the pedals.
The participants were located inside a virtual model of
420
a Citr¨oen DS3 car [40]. To have a spatial correspondence between the real steering wheel and the virtual one, the steering wheel inside the virtual car was a 3D model of the real racing wheel with which the participants were in-teracting. Moreover, the position and the movements of
425
the virtual model corresponded to the real one, allowing for co-located manipulation. After this phase of acclima-tization, the virtual environment evolved into the training environment. The car was displayed with as much realism as possible. Thus, the participant performed the training
430
described in Table 1.
2.2.4. The Virtual Learning Environment
For the training using the LVR system and the fixed-base driving simulator, a step-by-step tutorial was de-veloped in the form of a Virtual Learning Environment
435
stim-uli to the two groups of participants, except for the differ-ences due to the nature and the limits of the two systems involved.
The characteristics of the target vehicle described in
440
Section 2.1 were implemented in the VLE. The task of the participants consisted of interactions with the car fol-lowing the instruction of a virtual vocal assistant. The messages announced by the assistant were also displayed on a yellow panel in front of the trainee (Figure 3c). The
445
panel appeared when the user intervention was required, and disappeared as soon as the trainee performed the re-quired actions. No other actions were possible other than the required one.
The driving scenario was a straight 2-lane road
delim-450
ited by guardrails. No traffic was implemented. Only trees were placed on the roadside. A simple environment was specifically chosen to focus participants on the training task without any distractions, and to reduce the periph-eral optical flow which can contribute to simulation
sick-455
ness [41]. The training steps are described in Table 1. Before the driving scenario, an acclimatization virtual en-vironment was proposed to the participants to help them locate and identify the controls of the car.
Secondary activity. This training also included a secondary
460
activity that required the use of a tablet (a real one in the case of the fixed-base simulator, a virtual one in the case of LVR system). The tablet was used to distract the hu-man driver from the driving task during the automated driving. The distraction task was the same for all the
465
participants and consisted of a video of a TEDx Talk in French. The participants were asked, but not forced, to look at the tablet. The video was automatically played when the automated system was enabled and paused dur-ing the manual drivdur-ing and the take-over requests.
470
2.3. The test drive
After the training, the participant performed a test drive designed to evaluate their performance in a more realistic driving scenario. The system used for this pur-pose was a high-end driving simulator consisting of the
475
front part of a real car surrounded by a panoramic display (Figure 4). The display was placed 2.5m from the driver and covered a field of view of 170 degrees. Three three-chip DLP projectors displayed the scene. The rear part of the car was substituted with a monitor that displayed
480
the virtual environment from the rear window. The lateral mirrors consisted of two LCD displays as well. The cockpit was also equipped with a microphone to communicate with the experimenter and 4 cameras to record the scene inside the car. Data including position, speed and acceleration
485
of the car, and current driving mode were recorded. Inside the car, a 10.8 inch tablet was placed in the center console. It provided 9 different secondary activities: 3 games (a solitary, 2048, Simon) and 6 videos (3 talks, 2 movies and 1 movie trailer). The tablet was only available
490
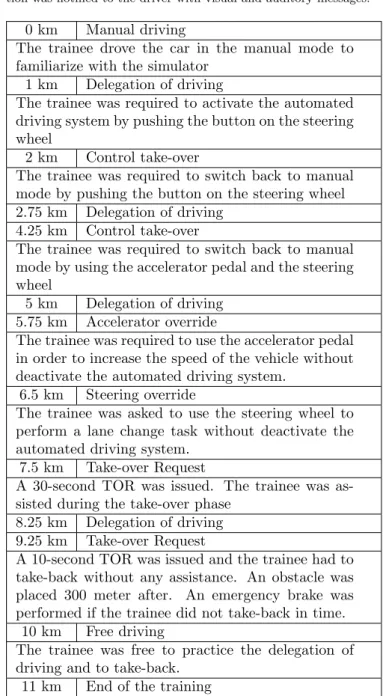
Table 1: The tasks in the Virtual Learning Environment. Each ac-tion was notified to the driver with visual and auditory messages.
0 km Manual driving
The trainee drove the car in the manual mode to familiarize with the simulator
1 km Delegation of driving
The trainee was required to activate the automated driving system by pushing the button on the steering wheel
2 km Control take-over
The trainee was required to switch back to manual mode by pushing the button on the steering wheel 2.75 km Delegation of driving
4.25 km Control take-over
The trainee was required to switch back to manual mode by using the accelerator pedal and the steering wheel
5 km Delegation of driving 5.75 km Accelerator override
The trainee was required to use the accelerator pedal in order to increase the speed of the vehicle without deactivate the automated driving system.
6.5 km Steering override
The trainee was asked to use the steering wheel to perform a lane change task without deactivate the automated driving system.
7.5 km Take-over Request
A 30-second TOR was issued. The trainee was as-sisted during the take-over phase
8.25 km Delegation of driving 9.25 km Take-over Request
A 10-second TOR was issued and the trainee had to take-back without any assistance. An obstacle was placed 300 meter after. An emergency brake was performed if the trainee did not take-back in time.
10 km Free driving
The trainee was free to practice the delegation of driving and to take-back.
11 km End of the training
during autonomous driving and it displayed the message “Take back control” during the requests to intervene.
Before starting the test, participants were instructed about the use of the equipment inside the car and were shown the button to activate/deactivate the automated
495
driving system.
The choice of a fixed rather than a moving-base sim-ulator was justified by the driving scenario which did not provide important lateral or longitudinal acceleration. 2.3.1. Driving scenario
500
The driving scenario of the test drive represented a dual carriageway with two lanes in each direction. Dense traffic was added to both directions. The aim of the test drive was to investigate the skills acquired by the participants
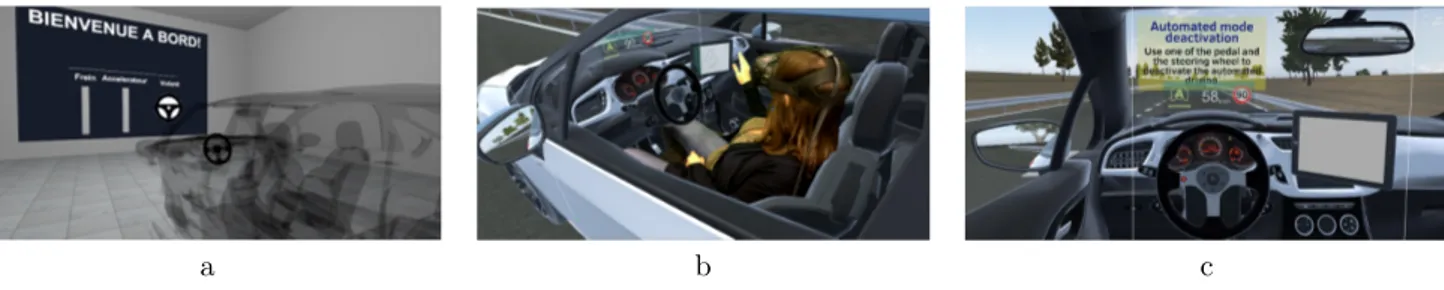
a b c
Figure 3: The Virtual Learning Environment. In (a) the familiarization environment. The car is displayed with a transparent effect and the panel on the front wall shows the indicators for the accelerator and brake pedal and for the steering wheel. In (b) a post-production illustration of a participant immersed in the virtual environment. In (c) a view of the interior of the car with the training message (on the yellow panel) and the virtual tablet used for the secondary activity
a b
Figure 4: The test drive simulator: (a) the real cabin with the 170 degree panoramic display and (b) a view of the cabin interior
Figure 5: The test drive scenario with the three situations that pro-voked the TORs: (A) stationary car on the lane, (B) loss of ground marking, (C) sensor failure
during the training and their reaction when a non-planned
505
take-over request was issued. For this purpose, 3 requests to intervene Figure 5 were issued during the test drive:
(A) a 10-second TOR caused by a road narrowing pro-voked by a stationary car on the right lane; this situ-ation (Obstacle) required the driver to brake and to
510
change lane in order to avoid the obstacle.
(B) a 10-second TOR caused by a loss of road marking (Road Marking); this situation required the driver to hold the vehicle inside the lane.
(C) a 5-second TOR caused by a sensor failure
(Fail-515
ure); this situation did not require any specific ac-tions from the driver.
To control order effects, the arrival order of TOR A and TOR B was randomized. TOR C was always issued as the last one in order.
520
The test drive lasted for about 20 minutes time dur-ing which the participants drove for 24 km. After a first phase of manual driving (4km) to familiarize drivers with
the simulator, the three TORs were issued after an au-tonomous driving phase, at 11.5 km, 19km and 23km.
525
During the autonomous driving, participants were asked to engage in one of the secondary activities proposed by the tablet.
2.4. Measures
Defining the quality of take-over is not an easy exercise,
530
because assessing the ability to drive or to operate an au-tomated vehicle requires the evaluation of various aspects related or not to the actual driving task. In literature there exists a set of well-known parameters which can be used to evaluate performance in driving scenarios like the once
535
used in the test-drive. To evaluate the training systems and the learning environment, objective and self-reported measures were collected and treated anonymously. 2.4.1. Self-reported measures
In total 6 different questionnaires were proposed to
540
the participants. A demographic questionnaire (contain-ing also questions about driv(contain-ing habits, familiarity with Virtual Reality and previous experiences with driving sim-ulators) was administered at the begininning of the study along with a survey about opinion concerning automated
545
cars. This last survey was also administered at the end of the study. To evaluate the appreciation of the training, participants were asked to answer to 10 questions survey and to evaluate graphical and physical realism of the Vir-tual Environment (only for FB and LVR groups). After
550
administered to the LVR group. After the test-drive, all the groups answered to a final questionnaire.
2.4.2. Objective measures
To evaluate the take over quality and the state of the
555
driver during the autonomous phase, objective measures were used as performance factors in the test drive with the high-end simulator. According to the take over situation, both raw data from the simulator (such as position and speed of the car, current driving mode, etc.) and video
560
feeds were used to assess the following variables:
• Reaction time (measured in seconds), the elapsed time from TOR until the driver takes back control. • Maximum deviation from the lane center (measured
in meters), within an interval of 30s after the
take-565
over request.
• Time To Collision (measured in seconds), “the time required for two vehicles to collide if they continue at their present speed and on the same path”. This measure was used to evaluate the evasive maneuver
570
to avoid the stationary car [21].
• Stress and confidence in the vehicle, during the au-tomated driving phases.
2.5. Participants
Sixty subjects participated in the experiment. The
par-575
ticipants included 30 females (50%) and 30 males (50%) aged between 22 and 71 (M = 43, SD = 14). Three groups of age were identified: the first group contained participants aged between 22 and 34 years old (7 males, 11 females); the second group participants aged between
580
35 and 54 (14 males, 9 females); the third group partici-pants older than 55 (9 males, 10 females). They were ran-domly assigned to one of the system in which they would be trained. The three groups contained 20 subjects each. All the subjects were volunteers recruited by a company
585
specialized in hiring consumer tests participants and had a valid driving license. At the end of the experiment, each participant was rewarded with a 40 euros voucher. 2.6. Procedures
The duration of the full experiment was about 60
min-590
utes for each participant. Participants were divided into three groups of 20. Each group underwent training with one of the systems described above. The study consisted of the following phases:
Introduction (10 minutes). The participants were welcomed
595
and informed in detail about the purpose of the study. They signed the consent form.
First questionnaire (5 minutes). The participants com-pleted questionnaires A and B.
Training (15 minutes). The training contained two parts:
600
the introductory video (2 minutes) and the actual training (slides for the user manual group, and the Virtual Learning Environment for the fixed-base and light VR system). The training for the user manual group generally lasted for less time with respect to the LVE one.
605
Second questionnaire (5 minutes). The participants filled out questionnaire C. Participants of the VLE group filled out questionnaire D. Participant of the LVR group filled out also the questionnaire E.
Test Drive (20 minutes). The participants drove in the
610
high-end simulator.
Third questionnaire (5 minutes). The participants com-pleted questionnaires F and B.
3. Results
All the participants completed the experiment.
Self-615
report and performance variables were tested for group differences using ANOVAs (and Tukey’s HSD test for pair-wise comparison) for continuous normally distributed data and Kruskal-Wallis (and Fisher’s LSD for pairwise compar-ison) test for ordinal, categorical and non-normally
dis-620
tributed data. Paired t-test was used for PrePost ques-tionnaires. The significance level of 5% was chosen for all the tests.
3.1. Self-report measures
Self-reported measures were collected through a set of
625
questions at the beginning of the test, after the training and after the test drive. The measures of user appreciation and simulator sickness were tested for group differences using Kruskal-Wallis test. In case of significant differences among the three groups (p < 0.05), the Fisher’s LSD test
630
was used to identify which pairs of means were significantly different, and which were not. The measure of confidence on automated vehicles was tested using a paired t-test. 3.1.1. Appreciation of the training
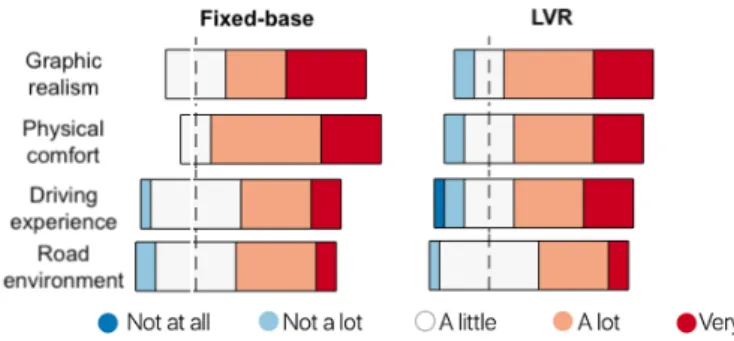
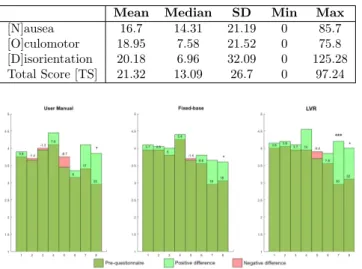
To evaluate the appreciation of the training the
partic-635
ipants filled out a 10-question survey containing questions about perceived usefulness, easiness, pleasantness, realism and so on. The Likert results are reported in Figure 6. The LVR scored better in all the questions, and in 4 of them the difference was significant. Moreover, to have a general
640
score, all the questions were summed up. Up to a total of 50 points (the highest the better), results showed that the LVR scored significantly better (M = 43) than both the fixed-base simulator (M = 40, p < 0.05) and the user manual (M = 39.5, p < 0.05). The results of the survey
645
Table 2: Demographic features distributed across the different systems
System Gender Age Age Group Car with Cruise Control? First time in a driving simulator (F/M) y (SD) Yes (no use) / No (Y/N)
UM 11/9 45 (12.9) 5/9/6 11(2) / 8 16/3 FB 10/10 46.9 (15.5) 7/6/7 16(4) / 4 16/4 LVR 9/11 43.5 (13.9) 6/8/6 11(1) / 9 14/6 Total 30/30 45.1 (14) 18/23/19 38(7) / 21 46/13
Figure 6: Likert responses to the questionnaire of training appreciation.
Figure 7: Likert responses to the realism survey for FB and LVR groups
3.1.2. Simulator Sickness Questionnaire (SSQ)
The SSQ was filled out only by the participants who performed the training with the LVR. The Total Score (TS) and the subscales relative to Nausea, Oculomotor
650
and Discomfort symptoms were calculated according to the formulas described by Kennedy et. al [42]. Results are reported in Table 3 and Figure 8. According to the catego-rization of SSQ proposed by Kennedy et. al. [43], 50% of the subjects reported no symptoms (TS = 0) or minimal
655
symptoms (TS < 10). The highest scores were reported by a participant affected by monocular vision impairment (TS = 71) and a participant affected by kinetosis also in traditional vehicles (TS = 97.24). However, they as well as all the other participants were able to complete the
660
training (no dropouts occurred). There were no signifi-cant differences with respect to participants’ age or gen-der. Analyzing the subscales, the Disorientation subscale
Figure 8: Results of SSQ scores (Nausea, Oculomotor, Disorientation subscales and Total) for the LVR group. In orange, the percentile graph. The vertical blue lines represent the value of SSQ if all the symptoms were reported as “slight” on that subscale.
(with symptoms related to vestibular disturbances such as dizziness and vertigo) registered the highest scores. This
665
result was expected and is mainly due to the nature of the HMD, which causes conflicts between the vestibular and the visual signal.
3.1.3. Pre-post Questionnaire on automated vehicles At the beginning of the test, participants were asked to
670
give a score from 1 to 5 to a set of 8 sentences to express their opinions on automated vehicles. After the test drive, they reply to the same questionnaire for the second time. The questionnaire contained sentences about confidence in the actions performed by the automated system, perceived
675
security, usefulness in the society and so on. The Wilcoxon Rank Sum Test was performed to compare the answers to
Table 3: Results of the Simulator Sickness Questionnaire.
Mean Median SD Min Max
[N]ausea 16.7 14.31 21.19 0 85.7 [O]culomotor 18.95 7.58 21.52 0 75.8 [D]isorientation 20.18 6.96 32.09 0 125.28 Total Score [TS] 21.32 13.09 26.7 0 97.24
Figure 9: Mean of the answer to the pre-post questionnaires. A light-green bar indicates an increase in the post questionnaire for the given question. The values indicate the percentage of change in the questions.
the pre and the post questionnaires.
Results are reported in Figure 9 and they show a gen-eral increase of the post-questionnaire score. It is very
680
interesting to point out that the sentence n. 5 is the only one for which the post-score was lower than the pre-score in all the system (“I think that the semi-autonomous car can reduce the risk of accident.” ). Nevertheless, the dif-ference for this question was not statistically significant.
685
Important increases in the post-questionnaire score can be observer in particular for the sentences 7 (“I see myself do-ing other tasks than drivdo-ing in a semi-autonomous car”) and 8 (“I have confidence in the decisions that the semi-autonomous car would take at my place”). The positive
690
difference for n. 7 was significant (p < 0.01) only for the LVR group; for n. 8 was significant (p < 0.05) for all the three groups.
3.2. Performance measures
The performance measures evaluated the quality of the
695
take-over in terms of reaction time, maximum deviation from the lane center, and the trajectory during an eva-sive maneuver. These variables were tested for group dif-ference using ANOVA (for normally distributed data) or Kruskal-Wallis (for non-normal distributed data); in case
700
of significant differences (p < 0.05) each pair was tested with the Tukey’s HSD test (after ANOVA) or Fisher’s LSD test (after Kruskal-Wallis test).
3.2.1. Reaction time
Three TORs were issued during the test drive after an
705
automated driving phase. In Figure 10 the mean of the reaction time per TOR for each system is reported. For the first and the second TOR, the participants trained with the LVR and the FB simulator reacted faster with respect
to the ones trained with the user manual. Moreover, the
710
reaction time of the second TOR of the User Manual group was significantly higher than the reaction time of the first TOR of the two other groups. No difference was observed for the third TOR between the three groups. The order of arrival of the three TORs did not impact the reaction
715
time (p = 0.51).
(a) Mean and 95% Confidence Interval of reaction times for each Take-Over Request.
TOR UM FB LVR
1 7.36 (3.55)a 3.80 (1.61)b 3.34 (0.95)b p < .01 2 5.97 (3.06)a 3.01 (0.92)b 3.275 (0.89)b p < .01
3 3.20 (0.67) 2.87 (0.71) 2.84 (0.83) p = .17
1, 2 6.66 (3.34)a 3.41 (1.37)b 3.32 (0.91)b p < .01 (superscripts indicate significance groups)
(b) Mean and Standard Deviation
Figure 10: Take-over reaction times for each systems and for each TOR. The first two were 10-second TORs; the last one was a 5-second TOR.
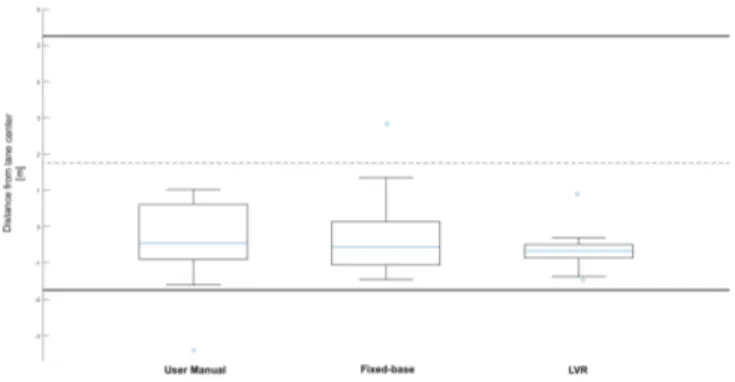
3.2.2. Deviation from lane center
Considering the TOR caused by loss of road marking, the stability of the trajectory was evaluated. Performing lane change in situation in which is not required is usually
720
considered a low-quality take over [44]. In the driving sce-nario, given that the width of the lane was lane w = 3m and the width of the car was car w = 2m, the maxi-mum possible distance from the lane center beyond which the car does not cross the separation line is d = 0.75m.
725
For each participant, the maximum deviation from the lane center in the 10 seconds after the TOR was calcu-lated. The value was kept with the sign (from −1.75m to +1.75m). The difference between this value and the maximum deviation was evaluated. Results are reported
730
in Figure 11. It can be observed that even though the medians are not significantly different, the LVR group has a lower standard deviation (σLVR = 0.48) than the UM (σUM= 1.05) and the FB (σFB= 1.03) group.
Figure 11: Box plot of deviation from lane center for each system. The two lanes are plotted. The value 0 in the y-axis represents the center of the right lane in the driving scenario.
Figure 12: Time To Collision [21]: the red block represents the sta-tionary obstacle; the red line is the trajectory of the vehicle; in green, the position of the car when the TTC h is calculated; in blue, the position of the car when the TTC l is calculated.
3.2.3. Time To Collision
735
One of the TOR was issued because of a stationary car on the right lane. The task of the trainee was to take over and avoid the car. The quality of the maneuver was evaluated with the Time To Collision (TTC) Figure 12 in the same way described by Happee et al. [21]. The TTC
740
was computed using the following formula T T C = dx v , where dx was the distance of the car from the obstacle and v was the speed of the car at that moment. Two TTC were evaluated: TTC h was computed when the heading of the car no longer intersected the obstacle; TTC l was
745
computed when the full vehicle front was in the new lane. The results are shown in table Table 4 and no significant differences were observed among the three groups. 3.3. Stress and confidence during autonomous driving
To evaluate drivers stress and confidence in the vehicle
750
during automated driving, the video feed recorded during the test drive was analyzed and annotated with a video-labeling tool developed by the authors.
During the automated driving phase drivers were free to engage in non-driving related activities by using the
755
Table 4: Means (and standard deviation) of Time To Collision (TTC) and Distance To Collision (DTC) used to evaluate the evasive ma-neuver UM FB LVR DTC h [m] 54.21 (35.61) 58.45 (49.63) 67.5 (62.72) p = .70 DTC l [m] 18.64 (19.12) 33.35 (78.17) 23.8 (41.61) p = .67 TTC h [s] 4.01 (2.89) 3.87 (2.59) 3.43 (2.10) p = .77 TTC l [s] 1.27 (1.13) 1.09 (1.69) 1.25 (1.86) p = .93
Figure 13: Means and 95% Confidence Interval of the stress and con-fidence score attributed to the participants during the 3 autonomous driving phases.
Table 5: Number of gaze switch between the secondary activity and the road environment for each autonomous driving phase; Eyes-on-Road is the ratio between the total amount of time spent looking at the road and the duration of the autonomous driving phase
UM FB LVR
N. of gaze 17.9 | 16 | 5 26.6 | 22.9 | 5.6 18 | 18.9 | 6.5 Eyes-on-Road 0.25 | 0.32 | 0.16 0.21 | 0.33 | 0.15 0.22 | 0.25 | 0.16
tablet in the car. Before the beginning of the test-drive, participants were instructed in using the tablet to switch between active (games) or passive activities (videos, movies).
A score was attributed to each participant during the three autonomous phases. The score ranged from 1 to 5
760
(the higher the better), where 1 corresponded to “Com-plete monitoring of the driving environment” and 5 corre-sponded to “Complete focus on the non-driving activity”. The score of 3 was assigned to drivers who occasionally monitored the driving environment.
765
To attribute this score several aspects were taken into consideration, such as the rate of gaze switch between the driving environment and the tablet and the length of the gazes, the insistence to talk to the experimenter, the po-sition of the driver on the seat, the popo-sition of the hands.
770
In Table 5 are reported the number of gaze switch and the ratio between the total amount of time spent looking at the road and the duration of each automated driving phase.
Results are reported in Figure 13 and they show that
775
the group trained with the User Manual scored less in the first autonomous phase with respect to the others. Considering that those participants were experiencing au-tonomous driving for the first time, this behaviour is ex-pected. It can be observed that the score for the UM group
780
increases in the second autonomous phase, while for the FB and HMD groups the behaviour is almost the same. In the third and last phase the score for all the groups increases.
4. Discussion
785
A first outcome of the study is that the training al-lowed all the participants to respond to the Take-Over Requests. In summary, according to the objective metrics
measured during the test drive, it is possible to identify two groups of participants that significantly differed for
790
the reaction time. The group of participants trained with the Virtual Learning Environment (FB and LVR) were able to respond to the take-over request faster than the group of participants trained with the user manual. After the take-over, the training system did not significantly
in-795
fluence the driving performance in the lane keeping task and in the evasive maneuver. Furthermore, self-reported measures showed responses in favor of the LVR training system. There are no variables (self-reported nor objec-tive) for which the LVR system scored significantly worse
800
than the other training systems. 4.1. Self-report measures
Self-report measures showed statistically significant re-sults. In particular, significant differences were observed in the answers to the training appreciation questionnaire
805
in which participants evaluated, among other character-istics, its usefulness, ease of understanding and pleasant-ness. In this questionnaire the LVR system scored sig-nificantly better than the fixed-base simulator and user manual training. Analyzing each questions of the survey,
810
we found that the participants considered the FB training more confusing than the LVR even though the training program was exactly the same. Another interesting out-come is that the LVR-based training was considered easier to understand than the other systems. Although it is
pos-815
sible that these results can be attributed to a VR “wow fac-tor”, participants’ previous experiences with driving sim-ulators (p = 0.41) and their knowledge of the concept of Virtual Reality (p = 0.25) did not significantly impact the answers. A hypothesis to explain these results is that the
820
technical characteristics exclusive to the LVR system, such as the large field of view, the head tracking, the 1:1 scale between the real and the virtual world, affected the per-ception of the learning. A second hypothesis is that since the participants of the LVR group were isolated from the
825
real world, both visually and acoustically, they could bet-ter focus on the training.
There were no significant differences (p = .66) in the answers of the questionnaire concerning the graphic real-ism and the physical realreal-ism of the simulator. This result
830
suggests that even if with the LVR the participants in-teracted with a racing wheel instead of the real steering wheel and they were not able to see their hands, these fac-tors did not play a significant role. Also, the transitional environment (Figure 3a) from the real to the virtual world
835
familiarized the participant with the lack of visual rep-resentation of the hands. Some of the participants were surprised to not see their hands, but then they realized in this environment that they could rely on proprioception to interact in a natural way with the commands.
840
Analyzing the single questions of the pre-post question-naire about automated cars, it is important to point out that for all the questions but one, the post-questionnaire score was higher than the pre-questionnaire among all the
three groups. The questionnaire aimed at evaluating the
845
confidence on automated cars in terms of usefulness, per-ceived security, willingness to perform secondary tasks and so on. While at the end of the study participants trusted more the actions of the automated system than the begin-ning, they did not confirm their expectations that the
con-850
ditionally automated car could reduce the risk of accidents. The hypothesis is that people tended to idealize the au-tonomous car as a perfect entity, but then their perception was influenced by the driving scenario. In fact, during the test drive the automated driving system prompted three
855
non-planned take-over requests in a short time. This could let the participants think that this kind of TORs were more frequent than they actually are. Furthermore one of the TOR was caused by a critical situation (stationary car). This result suggests that the driving scenario should also
860
present planned take-over requests with longer time buffers and no critical situation. The participants were also asked to self-evaluate on a 1-5 likert scale their readiness to drive an automated vehicle after the training and after the test drive. The answer after the test drive was higher among
865
all the systems, but the difference (+10%) was significant only for the user manual group.
4.2. Simulator Sickness
The aim of the evaluation of the SSQ was not to com-pare the LVR and the FB groups since previous studies
870
in literature already proved that HMDs usually produce more simulator sickness than fixed base simulators [45, 14]. Instead, the experimental protocol included the SSQ [42] with the objective of investigating if the use of an HMD would prevent participants from being trained in an
effec-875
tive way and analyzing the causes of sickness in case of dropouts. A first promising outcome is that no dropouts occurred; this result is very important in particular be-cause 70% of participants in the LVR group used a Virtual Reality headset for the first time. Furthermore, the HMD
880
produced no or minimal symptoms of simulator sickness in 50% of the cases. These results agree with Kennedy et. al [42] who showed that in their survey “the 0-value (the zero point) contained at least 40%, and as much as 75%, of the observations”. Although this study was not focused on
885
the reduction of simulator sickness, we adopted some well-known strategies [38] on both the Virtual Environment (such as straight road, simple environment and low periph-eral optical flow) and the physical system (positional co-herence of the virtual and the real steering wheel) to limit
890
the manifestation of oculo-vestibular conflicts. Thanks to these choices, the SSQ results (mean score T S = 21.32 and the absence of dropouts), are comparable, or even lower, than the score found in recent studies about simu-lation sickness related to virtual reality driving simusimu-lation
895
[46, 14]. However, further studies focused on this issue are needed to validate this result and to improve the training experience.
4.3. Objective and performance measures
In the test drive, data in the simulator were recorded
900
to assess the take-over quality and the driver’s behaviors during the automated driving. The take-over quality was evaluated according to the reaction time, the maximum lateral position on the lane, and the time to collision during the evasive maneuver to avoid the stationary car on the
905
lane.
Concerning the reaction time in the two 10-second TORs, the participants in the UM group reacted slower than the other two groups. No differences were instead observed comparing the FB and the LVR groups. For the 5-second
910
TOR the difference was not significant among any of the groups. This result suggests that participants who actu-ally performed a take-over during the training were able to respond better to the first request to intervene in a realistic situation. Furthermore, we hypothesize that the
915
decrease of reaction time for the 5-second TOR is due to (i) a learning effect and (ii) the results of Gold et al. [22] who showed that the reaction time depends on the time budget given for the take-over request. With respect to the TOR caused by the stationary car on the right lane, not all
920
participants were able to perform a safe evasive maneuver to avoid the obstacle. However, no significant differences were observed between the three groups as far as the time to collision is concerned. Furthermore, according to the age group, no significant differences were observed
regard-925
ing the reaction time nor the maximum lateral position; this result is in agreement with Korber et al. [23] who found that older drivers handle critical traffic events and adapt to the experience of take-over situations as well as younger drivers. Finally, considering the TOR caused by
930
loss of road marking, the stability of the trajectory in the 30 seconds after the TOR was evaluated and no significant differences between the groups were observed comparing the maximum lateral distance from the center of the lane. The absence of significant differences in these measures
935
suggests that, although these metrics could be useful to as-sess driving performance and driver behavior after a take-over request, they are not suitable to compare training effectiveness. In fact, evaluating driving and interaction skills in automated cars is a hard task because it is still
940
not clear what it means to be able to drive or operate this kind of vehicles. According to Walker et al. [47] lack of practice arising from sustained automatic control could erode driving skills. The same concern about driving skills emerges from the paper of Stanton et al. [32] who asked
945
“if drivers are not performing a function, how can they be expected to take it over adequately when the automated systems fail to cope?”.
Therefore, in the near future, traditional metrics could no longer be relevant to assess driving performance in
au-950
tomated vehicles. The results of this work suggest that Virtual Reality represents a promising tool to evaluate as well all those metrics that are not strictly related to the driving activity.
4.4. About learning-by-driving
955
An important observation which challenged the study was the feeling that the participants trained with the VLE (FB and LVR groups) did not experience the training as an actual training program, but more like a session of auto-mated driving simulator. Let us recall that the aim of the
960
VLE was (i) to inform drivers about the characteristics of the automated driving system, (ii) help them in identifying and localize the HMI in the car and (iii) teach the appro-priate response (activation and deactivation of the auto-mated driving system) to a given stimulus. For the last two
965
objectives, a virtual vocal assistant provided instructions to the participants; while instructions relative to the take-over were provided to the subjects during the secondary activity, those relative to the activation of the automated driving systems were given to them while they were
per-970
forming the driving task; in other words, participants were asked to aim attention at the training instructions while they were already focusing on a high-demand cognitive ac-tivity. However, the driving scenario during the training was kept as simple as possible (no traffic, straight lane) in
975
order to limit driver interventions. Although this hypoth-esis, all the trainees were able to assimilate the procedural skills. One of the research questions we will investigate in the future study will be if learning-by-driving actually im-proves the skill acquisition process, or if the driving task
980
requires a cognitive load which deteriorates the training performance.
5. Conclusion
The aim of this study was to investigate the effective-ness of a light Virtual Reality system based on HMD for
985
the training of conditionally automated vehicle drivers. To evaluate the usefulness of the system and to assess the ef-fectiveness of the training, the LVR was compared to a fixed-base simulator and a user manual; a test drive in a high-end simulator was performed by the participants
af-990
ter the training. To the best of our knowledge, this study represents the first attempt of use of HMD-based Virtual Reality for training purposes in automated vehicles.
The results of this research persuade us that light Vir-tual Reality systems represent a valuable tool for the
ac-995
quisition of operational skills in conditionally automated vehicles. The proposed training system, composed of an HMD and a game racing wheel, is a portable and cost-effective device that provides an adequate level of immer-sion for teaching drivers how to respond to a take-over
re-1000
quest in a safe environment. Therefore, this system could be employed for the training of future customers of au-tomated cars before their first ride. The step-by-step tu-torial implemented in the Virtual Learning Environment impacted on the performance and provided faster reaction
1005
time in the test drive. Moreover, among all the train-ing systems, participants preferred the light VR system in terms of usefulness, ease of use and realism.
A direct outcome of these results is the acknowledg-ment of VR as key player in the definition of the set of
1010
metrics for profiling drivers’ behavior in automated vehi-cles in order to ensure a safer interaction between humans and automated systems.
Starting from these results, in future work we will im-plement the training program in the form of a serious game
1015
in which the level of instruction adapts to the drivers’ needs in order to assess the acquisition of skill during the training itself. Furthermore, the need of the simulated driving task during the training will be investigated. Fi-nally, longer test-drives with real vehicles are considered
1020
of primary importance to validate current results.
Acknowledgement
This research was supported by the French Foundation of Technological Research under grant CIFRE 2015/1392 for the doctoral work of D. Sportillo at PSA Group.
1025
References
[1] S. International, Taxonomy and Definitions for Terms Related to Driving Automation Systems for On-Road Motor Vehicles. [2] S. M. Casner, E. L. Hutchins, D. Norman, The challenges of
par-tially automated driving, Communications of the ACM 59 (5)
1030
(2016) 70–77.
[3] I. Y. Noy, D. Shinar, W. J. Horrey, Automated driving: Safety blind spots, Safety Science 102 (2018) 68 – 78. doi:https: //doi.org/10.1016/j.ssci.2017.07.018.
URL http://www.sciencedirect.com/science/article/pii/
1035
S0925753517304198
[4] J. De Winter, P. Van Leeuwen, R. Happee, Advantages and dis-advantages of driving simulators: a discussion, in: Proceedings of Measuring Behavior, 2012, pp. 47–50.
[5] B. Dalgarno, M. J. Lee, What are the learning affordances of
1040
3-d virtual environments?, British Journal of Educational Tech-nology 41 (1) (2010) 10–32.
[6] E. Hamilton, D. Scott, J. Fleming, R. Rege, R. Laycock, P. Bergen, S. Tesfay, D. Jones, Comparison of video trainer and virtual reality training systems on acquisition of laparoscopic
1045
skills, Surgical Endoscopy and Other Interventional Techniques 16 (3) (2002) 406–411.
[7] J. Vora, S. Nair, A. K. Gramopadhye, A. T. Duchowski, B. J. Melloy, B. Kanki, Using virtual reality technology for aircraft vi-sual inspection training: presence and comparison studies,
Ap-1050
plied ergonomics 33 (6) (2002) 559–570.
[8] G. Avveduto, C. Tanca, C. Lorenzini, F. Tecchia, M. Car-rozzino, M. Bergamasco, Safety training using virtual real-ity: A comparative approach, in: International Conference on Augmented Reality, Virtual Reality and Computer Graphics,
1055
Springer, 2017, pp. 148–163.
[9] H. Zhang, Head-mounted display-based intuitive virtual reality training system for the mining industry, International Journal of Mining Science and Technology.
[10] W.-S. Lee, J.-H. Kim, J.-H. Cho, A driving simulator as a
vir-1060
tual reality tool, in: Robotics and Automation, 1998. Proceed-ings. 1998 IEEE International Conference on, Vol. 1, IEEE, 1998, pp. 71–76.
[11] I. Milleville-Pennel, C. Charron, Driving for real or on a fixed-base simulator: is it so different? An explorative study, Presence
1065
24 (1) (2015) 74–91.
[12] D. L. Fisher, N. E. Laurie, R. Glaser, K. Connerney, A. Pollat-sek, S. A. Duffy, J. Brock, Use of a fixed-base driving simulator
to evaluate the effects of experience and pc-based risk aware-ness training on drivers’ decisions, Human factors 44 (2) (2002)
1070
287–302.
[13] M. Kl¨uver, C. Herrigel, C. Heinrich, H.-P. Sch¨oner, H. Hecht, The behavioral validity of dual-task driving performance in fixed and moving base driving simulators, Transportation re-search part F: traffic psychology and behaviour 37 (2016) 78–96.
1075
[14] F. Weidner, A. Hoesch, S. Poeschl, W. Broll, Comparing VR and non-VR driving simulations: An experimental user study, in: Virtual Reality (VR), 2017 IEEE, IEEE, 2017, pp. 281–282. [15] S. M. Taheri, K. Matsushita, M. Sasaki, Development of a Driv-ing Simulator with AnalyzDriv-ing Driver’s Characteristics Based on
1080
a Virtual Reality Head Mounted Display, Journal of Transporta-tion Technologies 7 (03) (2017) 351.
[16] D. Goedicke, J. Li, V. Evers, W. Ju, Vr-oom: Virtual reality on-road driving simulation, in: Proceedings of the 2018 CHI Conference on Human Factors in Computing Systems, ACM,
1085
2018, p. 165.
[17] D. Sportillo, A. Paljic, M. Boukhris, P. Fuchs, L. Ojeda, V. Roussarie, An immersive virtual reality system for semi-autonomous driving simulation: a comparison between realis-tic and 6-dof controller-based interaction, in: Proceedings of
1090
the 9th International Conference on Computer and Automation Engineering, ACM, 2017, pp. 6–10.
[18] Q. C. Ihemedu-Steinke, R. Erbach, P. Halady, G. Meixner, M. Weber, Virtual reality driving simulator based on head-mounted displays, in: Automotive User Interfaces, Springer,
1095
2017, pp. 401–428.
[19] V. Melcher, S. Rauh, F. Diederichs, H. Widlroither, W. Bauer, Take-over requests for automated driving, Procedia Manufac-turing 3 (2015) 2867–2873.
[20] N. Merat, A. H. Jamson, F. C. Lai, M. Daly, O. M. Carsten,
1100
Transition to manual: Driver behaviour when resuming control from a highly automated vehicle, Transportation research part F: traffic psychology and behaviour 27 (2014) 274–282. [21] R. Happee, C. Gold, J. Radlmayr, S. Hergeth, K. Bengler,
Take-over performance in evasive manoeuvres, Accident Analysis &
1105
Prevention 106 (2017) 211–222.
[22] C. Gold, D. Damb¨ock, L. Lorenz, K. Bengler, “Take over!” How long does it take to get the driver back into the loop?, in: Pro-ceedings of the Human Factors and Ergonomics Society Annual Meeting, Vol. 57, SAGE Publications Sage CA: Los Angeles,
1110
CA, 2013, pp. 1938–1942.
[23] M. K¨orber, C. Gold, D. Lechner, K. Bengler, The influence of age on the take-over of vehicle control in highly automated driving, Transportation research part F: traffic psychology and behaviour 39 (2016) 19–32.
1115
[24] K. Zeeb, A. Buchner, M. Schrauf, Is take-over time all that mat-ters? The impact of visual-cognitive load on driver take-over quality after conditionally automated driving, Accident Analy-sis & Prevention 92 (2016) 230–239.
[25] J. Navarro, M. Fran¸cois, F. Mars, Obstacle avoidance under
1120
automated steering: impact on driving and gaze behaviours, Transportation research part F: traffic psychology and be-haviour 43 (2016) 315–324.
[26] W. Payre, J. Cestac, N.-T. Dang, F. Vienne, P. Delhomme, Impact of training and in-vehicle task performance on manual
1125
control recovery in an automated car, Transportation Research Part F: Traffic Psychology and Behaviour 46 (2017) 216 – 227. doi:https://doi.org/10.1016/j.trf.2017.02.001.
URL http://www.sciencedirect.com/science/article/pii/ S1369847816300651
1130
[27] K. Spolander, Drivers’assessment of their own driving ability, Tech. rep. (1983).
[28] J. Reason, A. Manstead, S. Stradling, J. Baxter, K. Camp-bell, Errors and violations on the roads: a real distinction?, Ergonomics 33 (10-11) (1990) 1315–1332.
1135
[29] M. M. Roy, M. J. Liersch, I am a better driver than you think: examining self-enhancement for driving ability, Journal of ap-plied social psychology 43 (8) (2013) 1648–1659.