médecine/sciences médecine/sciences
Diagnostic
efficacy of serum
procalcitonin,
C-reactive protein
concentration and
clinical pulmonary
infection score
in
Ventilator-Associated
Pneumonia
Changqin Chen, Molei Yan, Caibao Hu, Xiaochun Lv, Huihui Zhang, Shangzhong Chen
>
Objective: The aim of this study was to evaluate
the diagnostic efficacy of serum procalcitonin
(PCT), c-reactive protein (CRP) concentration and
clinical pulmonary infection score(CPIS) in
ventila-tor-associated pneumonia(VAP). Methods:
Forty-nine patients who were admitted to the intensive
care unit (ICU) of Zhejiang Hospital with suspected
VAP were recruited in this study. The serum level
of PCT and CRP of all patients were measured and
CPIS was calculated at the time of VAP suspected
diagnosis. Of the included 49 patients, 24 were
finally confirmed of VAP by microbiology assay.
And the other 25 patients were considered as
cli-nical suspected VAP without microbiology
confir-mation. The diagnostic sensitivity, specificity and
area under the receiver operating characteristic
(ROC) curve (AUC) were calculated using the serum
PCT, CRP concentration and CPIS. The correlation
among serum PCT, CRP concentration and CPIS
were also evaluated by Spearson correlation test.
Results: A total of 100 bronchoscopic
aspira-tion sputum specimen were examined in bacterial
culture. 30 samples were found with suspected
pathogenic bacteria. Six samples were found with 2
types of suspected pathogenic bacteria. PCT serum
concentration and CPIS score were significantly
different (P<0.05) between the patient group [1.4
(0.68 ∼ 2.24), 6.0 (4.25 ∼ 8.00)] and the control
group [0.4 (0.17
∼ 1.39), 3.0 (1.00 ∼ 5.00)] ;
However, the serum CRP [102.8(66.75
∼ 130.90)
vs 86.1(66.95 ∼ 110.10)] was not statistically
dif-ferent between the two groups (P>0.05). A
signi-ficant correlation was found between serum PCT
and CRP concentrations (r=0.55, P<0.01), but not
between PCT vs CPIS and CRP vs CPIS (p>0.05). The
diagnostic sensitivity, specificity and AUC were
72.0%, 75.0%, 0.81 (0.69
∼ 0.93) for CPIS; 60.0%,
87.5%, 0.76 (0.62
∼ 0.90) for PCT and 68.0%,
Department of ICU, Zhejiang Hospital. No 12. Lingyin Road, Hangzhou City, Zhejiang Province, 317000 PR China. Corresponding author: Molei Yan moleiy1980@163.com
Introduction
Ventilator associated pneumonia (VAP) that occurs more than 48 hours after initiation of mechanical ventilation is one of the most diagnosed infectious complication in the department of intensive care unit (ICU)
[1, 2]. It has been reported that the morbidity rate ranges from 10% to 20% with a mortality rate of 50% [3-5]. Furthermore, this complication also prolonges the duration of mechanical ventilation, hospital stay and increases the cost of treatment [6-8]. Early diagnosis and effective antibiotic treatment were key methods for improving the prognosis of
58.3%, 0.59 (0.43
∼ 0.76) for CRP. Conclusion: PCT serum level
and CPIS score are elevated in VAP patients and could therefore
represent potential biomarkers for VAP early diagnosis.
<
Key words:
procalcitonin; c-reactive protein; clinical
pulmo-nary infection score; ventilator-associated pneumonia.
médecine/sciences 2018 ; 34 (focus issue, F1) : 26-32
This research was supported by Zhejiang Provincial Natural Science Foundation of China under Grant No. LQ14H150001.
SYNTHÈSE
REVUES
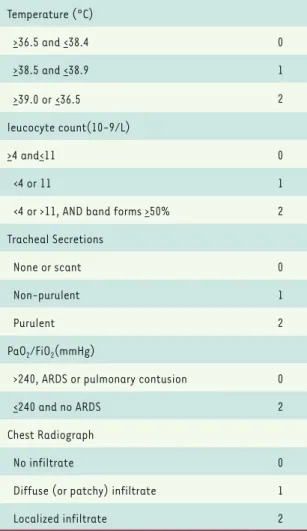
cultures [14]. Diagnosis of the CPIS results in fewer missed VAP episodes and can also prevent unnecessary antibiotic administration due to treatment of colonized patients. The CPIS score evaluation system is shown in
Table 1.
Statistical analysis
Stata 11.0 statistical software was used for all the data analysis. Because of abnormal distribution, the serum concentration of PCT and CRP was expressed as a median value, with a 95% confidence interval and analyzed by non-parametric Mann-Whitney U-test. The CPIS score was expressed as means ± standard deviation (SD) and compared by a student-t test between two groups. A receiver operator characteristic (ROC) curve was used to evaluate the diagnostic per-formance of CPIS, PCT and CRP for VAP confirmation. Two tails P values <0.05 were considered as statisti-cally significant.
patients with VAP. At present, the most clinical used methods for VAP diagnosis are clinical standards and etiological examination. However, the specificity is low with regard to clinical diagnosis standards because of relative loose criteria. For etiological examination, although its speci-ficity is high, it always needs quantitative or semi-quantitative bacterial culture assays which usually delays the diagnosis process.
Procalcitonin (PCT) is a peptide precursor of the hormone calcitonin, the latter being involved with calcium homeostasis. C-reactive pro-tein (CRP) is an annular (ring-shaped) pentameric propro-tein found in blood plasma, whose levels rise in response to inflammation. Previ-ous studies have demonstrated that the serum levels of PCT and CRP are elevated in patients with infected lesions and could be potential biomarkers for infection disease diagnosis [9-11]. However, the con-clusion about the diagnostic pertinence of serum PCT and CRP for VAP remains controversial [12, 13].
Material and methods
PatientsPatients admitted to the ICU department form January 2015 to June 2017 in Zhejiang Hospital for mechanical ventilation were screened as potential cases. Written informed consent was obtained from all the included patients. The study was approved by the Local Ethics Commit-tee of Zhejiang Hospital. The patients inclusion criteria were: Age more than 18 years; mechanical ventilation more than 48h; With suspected VAP diagnosis: (1) Persistent or new invasive shadows in the lung; (2) At least two below items: temperature more than 38 °C or less than 36 °C; leucocyte count>10×10-9/L or <410×10-9/L; purulent sputum. With confirmed VAP diagnosis: (1) Persistent or new inva-sive shadows in the lung; (2) At least two below items: temperature more than 38 °C or less than 36 °C; leucocyte count >10×10^9/L or <4×10^9/L; purulent sputum; (3) Any of the item below: bronchoscopic aspiration sputum specimen bacterial culture +++~++++; Pathogenic bacteria were cultured from blood. The patients exclusion criteria were confirmed pulmonary or extrapulmonary infection before mechani-cal ventilation; malignant carcinomas; HIV positive patients; confirmed extrapulmonary infection during mechanical ventilation potential increase of serum PCT or CRP related to other diseases; acute myocardial infarction; dead within 48h.
Serum PCT, CRP measurement
On the day of VAP suspected diagnosis or confirmation diagnosis, 6mL of peripheral blood were sampled from each included patient and then centrifuged to separate the serum. The obtained serum was stored at -20 °C for subsequent assays. The serum PCT and CRP concentration were measured by electrochemiluminescence immunoassay and neph-elometry assay, respectively. Procedures were performed according to the manufacturer’s recommendations.
CPIS score evaluation
Pulmonary infection score (CPIS) was used to make the diagnosis of VAP by predicting which patients will benefit from obtaining pulmonary
Parameter Score Temperature (°C) >36.5 and <38.4 0 >38.5 and <38.9 1 >39.0 or<36.5 2 leucocyte count(10-9/L) >4 and<11 0 <4 or 11 1
<4 or >11, AND band forms >50% 2
Tracheal Secretions
None or scant 0
Non-purulent 1
Purulent 2
PaO2/FiO2(mmHg)
>240, ARDS or pulmonary contusion 0
<240 and no ARDS 2
Chest Radiograph
No infiltrate 0
Diffuse (or patchy) infiltrate 1
Localized infiltrate 2
in control group, respectively with statistical differ-ence (P<0.05); However, the serum CRP [102.8 (66.75 ~130.90) vs 86.1 (66.95~110.10)] was not statistical different between the two groups (P>0.05) (Table 3). A significant correlation was found between serum PCT and CRP concentrations (r=0.55, P<0.01), but not between PCT vs CPIS and CRP vs CPIS (p>0.05) (Figure 3). Diagnostic efficacy of Serum PCT, CRP concentration and CPIS
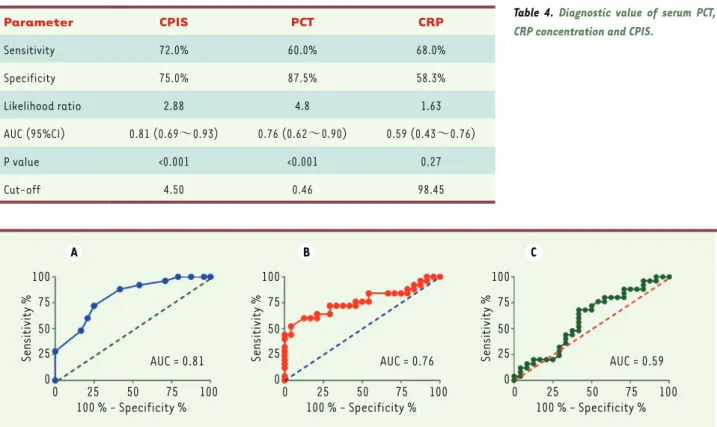
The diagnostic sensitivity, specificity and AUC were 72.0%, 75.0%, 0.81 (0.69~0.93) for CPIS; 60.0%, 87.5%, 0.76 (0.62~0.90) for PCT and 68.0%, 58.3%, 0.59 (0.43 ~0.76) for CRP (Table 4) (Figure 4).
Discussion
Ventilator associated pneumonia(VAP), a common infection disease in the department of intensive care unit (ICU), is one of the main cause of increased mor-tality, prolonged hospital stay and elevated treatment costs [2, 7]. Accurate and timely diagnosis is the key
Results
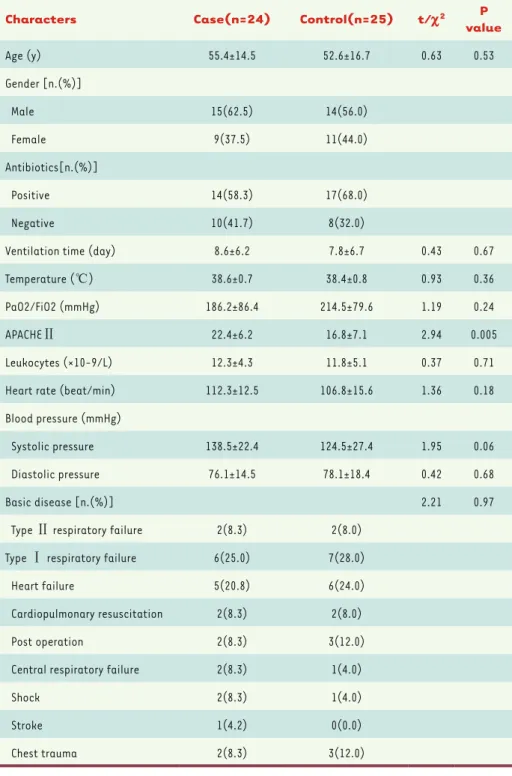
Patients inclusion and general characteristics
One hundred and forty-one patients were screened initially. 80 cases were excluded for fail to meet the inclusion critera. Thus, 61 patients were initially recruited in the study. During the treatment process, 12 patients were further excluded because of extrapulmonary infection during the mechanical ventilation. Finally, 49 cases were included for data analysis
(Figure 1). Of the included 49 patients, 24 were confirmed with VAP (case group) and 25 subjects were not confirmed (control group) according to bronchoscopic aspiration sputum specimen pathogenic bacteria culture. The general characteristics of the included patients are shown in Table 2.
Pathogenic bacteria analysis
A total of 100 bronchoscopic aspiration sputum specimen were examined in bacterial culture. 30 samples were found with suspected pathogenic bacte-ria. Six samples were found with 2 types of suspected pathogenic bactebacte-ria. The suspected pathogenic bacteria distribution is shown in Figure 2.
Serum PCT, CRP concentration and CPIS
PCT serum concentration and CPIS score were 1.4 (0.68~2.24), 6.0 (4.25~8.00) in patients group and 0.4 (0.17~1.39), 3.0 (1.00~5.00) Patients screened for inclusion
(n = 141)
Patients initially recruited (n = 61)
Patients analyzed (n = 49)
VAP confirmed
(n = 24) VAP not confirmed(n = 25)
Extrapulmonary infection during mechanical ventilation (n = 12) Patients excluded (n = 80)
Ventilation < 48 h (n = 45)
Infection before ventilation (n = 22) Other disease potential increase serum PCT or CRP (n = 7) Others (n = 6)
Patients identification
Patients screening
Patients included
SYNTHÈSE
REVUES
Currently, the most used method for VAP diagnosis is a standard-ized clinical diagnosis. However, its specificity is low because of relative loose condition. Another drawback for this clinical stan-dard is the high false positive rate which may lead to the abuse of antibiotics and overtreat-ment. On the basis of this clinical standard, another VAP diagno-sis system called clinical pulmo-nary infection score (CPIS) has been developed. This new sys-tem consideres that patients are at high risk of developing VAP when CPIS is greater than 6 points
[14, 17]. Pugin[18] and Papa-zian[19] argued that CPIS is a good approach for VAP diagnosis, exhibiting a relatively high sensi-tivity and specificity. In the pres-ent study, we found that the CPIS in the patient group is signifi-cantly higher than in the control group. Further analyses indicated that the diagnosis sensitivity and specificity are 72.0% and 75.0% with the AUC of 0.81 (0.69~0.93) by using the CPIS approach. This demonstrates that CPIS is a good method for VAP diagnosis. Also, thanks to its easy clinical maneu-verability, CPIS has been exten-sively used for clinical practice. Procalcitonin (PCT), a peptide precursor of the hormone cal-citonin, and C-reactive protein (CRP) an annular (ring-shaped) pentameric protein, were always elevated in the serum of patients with infected lesions. They have been therefore extensively applied as biomarkers of infec-tion disease. However, serum concentrainfec-tion of PCT and CRP as biomarkers for VAP diagnosis have been seldomly reported.
In the present study, we included 49 patients with suspect or confirmed VAP and evaluated the clinical efficacy of serum PCT and CRP as biomarkers for VAP confirmation diagnosis. We found that serum level of PCT and CPIS score are elevated in VAP patients, and, to reduce the risk of death and to decrease the treatment costs [15,
16]. However, major difficulties and controversies still exist in the definition of diagnostic standards for VAP. Most of them focus on: (1) the technique of ideal sampling for routine applications; (2) the evaluation of quantitative culture of respiratory secretions; (3) the advantages and disadvantages of the invasive and non-invasive tech-nologies for VAP diagnosis; (4) whether the diagnosis approach can affect the prognosis or not.
Characters Case(n=24) Control(n=25) t/c2 P
value Age (y) 55.4±14.5 52.6±16.7 0.63 0.53 Gender [n.(%)] Male 15(62.5) 14(56.0) Female 9(37.5) 11(44.0) Antibiotics[n.(%)] Positive 14(58.3) 17(68.0) Negative 10(41.7) 8(32.0)
Ventilation time (day) 8.6±6.2 7.8±6.7 0.43 0.67
Temperature (℃) 38.6±0.7 38.4±0.8 0.93 0.36
PaO2/FiO2 (mmHg) 186.2±86.4 214.5±79.6 1.19 0.24
APACHEⅡ 22.4±6.2 16.8±7.1 2.94 0.005
Leukocytes (×10-9/L) 12.3±4.3 11.8±5.1 0.37 0.71
Heart rate (beat/min) 112.3±12.5 106.8±15.6 1.36 0.18
Blood pressure (mmHg)
Systolic pressure 138.5±22.4 124.5±27.4 1.95 0.06
Diastolic pressure 76.1±14.5 78.1±18.4 0.42 0.68
Basic disease [n.(%)] 2.21 0.97
Type Ⅱ respiratory failure 2(8.3) 2(8.0)
Type Ⅰ respiratory failure 6(25.0) 7(28.0)
Heart failure 5(20.8) 6(24.0)
Cardiopulmonary resuscitation 2(8.3) 2(8.0)
Post operation 2(8.3) 3(12.0)
Central respiratory failure 2(8.3) 1(4.0)
Shock 2(8.3) 1(4.0)
Stroke 1(4.2) 0(0.0)
Chest trauma 2(8.3) 3(12.0)
cally different between the two groups. It indicates that its diagnostic value is limited.
hence, that they could represent useful potential biomarkers for VAP early diagnosis. However, the serum CRP was not found to be
statisti-Figure 2. Suspected pathoge-nic bacteria of 30 bronchos-copic aspiration sputum spe-cimen. Total = 30 26.67% Pseudomonas aeruginosa 20.00% Acinetobacter Bauman 16.67% Staphylococcus aureus 13.33% Streptococcus pneumoniae 10.00% Stenotrophomonas maltophilia 6.67% Enterococcus faecalis 3.33% Escherichia coli 3.33% Haemophilus influenzae
Table 3. Serum PCT and CRP concentrations and CPIS.
Serum markers Case(n=24) Control(n=25) valueP
CPIS 6.0(4.25~8.00) 3.0(1.00~5.00) <0.05 CRP(ng/mL) 102.8(66.75~130.90) 86.1(66.95~110.10) >0.05 PCT(mg/L) 1.4(0.68~2.24) 0.4(0.17~1.39) <0.05 12 9 6 3 0 CPIS
Case (n = 24) Control (n = 25) Case (n = 24) Control (n = 25) Case (n = 24) Control (n = 25)
A B C D E F 8 6 4 2 0 0 3 6 9 12 r = 0.05, P = 0.75 PCT (ng/mL) CPIS 0 3 CPIS6 9 12 0 2 PCT (ng/mL)4 6 8 PCT (ng/mL) CRP (mg/L) 8 6 4 2 0 –2 200 150 100 50 0 200 150 100 50 0 CRP (mg/L) CRP (mg/L) r = 0.02, P = 0.89 250 200 150 100 50 0 r = 0.55, P < 0.01
Figure 3. Serum PCT, CRP concentration and CPIS score of the two groups. (A) Scatter plot of CPIS score of the two groups. (B) Scatter plot of serum concentration of PCT. (C) Scatter plot of serum concentration of CRP. (D) Pearson correlation for serum PCT concentration and CPIS score. (E) Pear-son correlation for serum CRP concentration and CPIS score. (F) Pearson correlation for serum PCT and CRP concentration.
SYNTHÈSE
REVUES
6. Eagye KJ, Nicolau DP, Kuti JL. Impact of superinfection on hospital length of stay and costs in patients with ventilator-associated pneumonia. Semin
Resp Crit Care Med 2009;30:116-23.
7. Kappstein I, Schulgen G, Beyer U, Geiger K, Schumacher M, Daschner FD. Prolongation of hospital stay and extra costs due to ventilator-associated pneumonia in an intensive care unit. Eur J Clin Microbiol Infect Dis 1992;11:504-8.
8. Nicasio AM, Eagye KJ, Kuti EL, Nicolau DP, Kuti JL. Length of stay and hospital costs associated with a pharmacodynamic-based clinical pathway for empiric antibiotic choice for ventilator-associated pneumonia.
Pharmacotherapy 2010;30:453-62.
9. Hatherill M, Tibby SM, Sykes K, Turner C, Murdoch IA. Diagnostic markers of infection: comparison of procalcitonin with C reactive protein and leucocyte count. Arch Dis Child 1999;81:417-21.
10. Dominguez-Comesana E, Estevez-Fernandez SM, Lopez-Gomez V, Ballinas-Miranda J, Dominguez-Fernandez R. Procalcitonin and C-reactive protein as early markers of postoperative intra-abdominal infection in patients operated on colorectal cancer. Int J Colorect Dis 2017.
11. Tachyla SA, Marochkov AV, Lipnitski AL, Nikiforova YG. The prognostic value of procalcitonin, C-reactive protein and cholesterol in patients with an infection and multiple organ dysfunction. Korean J Anesthesiol 2017;70:305-10.
12. Habib SF, Mukhtar AM, Abdelreheem HM, Khorshied MM, El Sayed R, Hafez MH, et al. Diagnostic values of CD64, C-reactive protein and procalcitonin in ventilator-associated pneumonia in adult trauma patients: a pilot study.
Clin Chem Lab Med 2016;54:889-95.
13. Linssen CF, Bekers O, Drent M, Jacobs JA. C-reactive protein and procalcitonin concentrations in bronchoalveolar lavage fluid as a predictor of ventilator-associated pneumonia. Ann Clin Biochem 2008;45:293-8. 14. Zilberberg MD, Shorr AF. Ventilator-associated pneumonia: the clinical
pulmonary infection score as a surrogate for diagnostics and outcome. Clin
Infect Dis 2010;51 (suppl 1):S131-5.
15. Allaouchiche B, Jaumain H, Dumontet C, Motin J. Early diagnosis of ventilator-associated pneumonia. Is it possible to define a cutoff value of infected cells in BAL fluid? Chest 1996;110:1558-65.
Besides the positive findings of this work, this study also had several limitations. Firstly, only 49 patients were included in this study. Thus, the statistical power is limited due to the relative small samples size. Secondly, all the patients were recruited from a single hospital, which may lead to a sample selection bias. Thirdly, more than half of the patients received antibiotic drugs before mechanical ventilation treatment. The antibiotic drug used may decrease the positive rate of bacterial culture. In view of these above limitations, well-designed large multicenter prospective cohort studies are needed for further evaluate this VAP early diagnosis method. Such studies should pro-vide more and relevant clinical epro-vidence of the interest of using this method. ‡
DISCLOSURE OF CONFLICT OF INTEREST
None.
REFERENCES
1. Charles MP, Kali A, Easow JM, Joseph NM, Ravishankar M, Srinivasan S, et al. Ventilator-associated pneumonia. Australasian Med J 2014;7:334-44.
2. Guillamet CV, Kollef MH. Update on ventilator-associated pneumonia. Curr Opin Crit Care 2015;21:430-8.
3. Bekaert M, Timsit JF, Vansteelandt S, Depuydt P, Vesin A, Garrouste-Orgeas M, et al. Attributable mortality of ventilator-associated pneumonia: a reappraisal using causal analysis. Am J Respir
Crit Care Med 2011;184:1133-9.
4. de Pont AC. Attributable mortality of ventilator-associated pneumonia. Lancet Infect Dis 2013;13:1014. 5. Timsit JF, Zahar JR, Chevret S. Attributable mortality of ventilator-associated pneumonia. Curr
Opin Crit Care 2011;17:464-71.
Table 4. Diagnostic value of serum PCT, CRP concentration and CPIS.
Parameter CPIS PCT CRP Sensitivity 72.0% 60.0% 68.0% Specificity 75.0% 87.5% 58.3% Likelihood ratio 2.88 4.8 1.63 AUC (95%CI) 0.81 (0.69~0.93) 0.76 (0.62~0.90) 0.59 (0.43~0.76) P value <0.001 <0.001 0.27 Cut-off 4.50 0.46 98.45 A B C 100 75 50 25 0 0 25 50 75 100 Sensitivity % 100 % - Specificity % AUC = 0.81 100 75 50 25 0 0 25 50 75 100 Sensitivity % 100 % - Specificity % AUC = 0.76 100 75 50 25 0 0 25 50 75 100 Sensitivity % 100 % - Specificity % AUC = 0.59
Figure 4. ROC curve of serum PCT, CRP concentration and CPIS for confirmation diagnosis of VAP. (A) ROC curve of CPIS. (B) ROC curve of PCT. (C) ROC curve of CRP.
18. Pugin J, Auckenthaler R, Mili N, Janssens JP, Lew PD, Suter PM. Diagnosis of ventilator-associated pneumonia by bacteriologic analysis of bronchoscopic and nonbronchoscopic „blind“ bronchoalveolar lavage fluid.
Am Rev Respir Dis 1991;143:1121-9.
19. Papazian L, Thomas P, Garbe L, Guignon I, Thirion X, Charrel J, et al. Bronchoscopic or blind sampling techniques for the diagnosis of ventilator-associated pneumonia. Am J Respir Crit Care Med 1995;152:1982-91. REFERENCES
16. Mongodi S, Via G, Girard M, Rouquette I, Misset B, Braschi A, et al. Lung Ultrasound for Early Diagnosis of Ventilator-Associated Pneumonia. Chest 2016;149:969-80.
17. Lauzier F, Ruest A, Cook D, Dodek P, Albert M, Shorr AF, et al. The value of pretest probability and modified clinical pulmonary infection score to diagnose ventilator-associated pneumonia. J Crit