Applied Energy 294 (2021) 116904
0306-2619/© 2021 Elsevier Ltd. All rights reserved.
Analysis of the impact of automatic shading control scenarios on occupant’s
comfort and energy load
Amir Tabadkani
a,*, Astrid Roetzel
a, Hong Xian Li
a, Aris Tsangrassoulis
b, Shady Attia
c aSchool of Architecture and Built Environment, Deakin University, Geelong Waterfront Campus, AustraliabDepartment of Architecture, University of Thessaly, Perion Areos, 38334 Volos, Greece
cSustainable Building Design Lab, Dept. UEE, Faculty of Applied Science, University of Liege, Liege, Belgium
H I G H L I G H T S
•Conducting a brute-force method to assess the impact of automated shading controls. •Three environmental parameters are significantly effective on results.
•Higher improvements are observed in cities with high environmental variations. •In case of targeting single objective an open-loop control mechanism performed better. •Activation thresholds have the least impact on indoor operative temperature.
A R T I C L E I N F O Keywords:
Adaptive façade
Building performance simulation Energy management system Occupant comfort User interaction Shading control
A B S T R A C T
Building envelopes should be responsive to boundary conditions changing in short-time, daily, or seasonal patterns. To this end, adaptive facades provide the ability to react, or benefit from, outdoor fluctuations and dynamic indoor requirements. On the other hand, the parallel trend of developing new technologies to control their performance, make adaptive facades more applicable to counterbalance both user’s comfort and building energy load. This goal can be met using active control mechanisms, either manually or automatically. Automatic shading controls require indoor/outdoor signal inputs to operate a shading system. However, in the literature, there is no consent on the effectiveness of automatic shading control strategies and all of the studies were investigated within specific environmental conditions. Therefore, this paper aims to compare the most used control functions and their implications on user comfort and energy load in different climate zones. To this end, EnergyPlus was used as a simulation platform to employ Energy Management System (EMS) for linking sensors, actuators to the control logic of adaptive venetian blinds. Then, a brute-force method was performed through Ladybug-tools to conduct 15,390 iterations parametrically. Results showed that climatic conditions impact the shading control scenario significantly, and the optimum scenario was an open-loop algorithm based on direct solar radiation due to the earlier activation of blind closure to block solar radiation while increasing lighting load at the same time.
1. Introduction
1.1. Background
According to the International Energy Agency, the building sector energy demand is expected to rise up by 20% till 2040 [1] in which it is expected to consume more by 2.1% in non-industrial countries. This trend demands thinking of using effective measurements to minimize
building energy load [2,3] while maximizing indoor environmental quality. The former is related to the cost, while the latter is associated with user comfort. Adaptive façades (AFs) offer a multifunctional po-tential to balance human comfort that can be divided into two main categories based on their motion layouts: conventional AFs (e.g. Vene-tian Blinds) and non-conventional AFs (e.g. folding systems) [4] (Fig. 1). They facilitate and distribute daylight to avoid dim areas, reducing glare, increasing view to outside or privacy, and controlling solar gains
* Corresponding author.
E-mail address: [email protected] (A. Tabadkani).
Contents lists available at ScienceDirect
Applied Energy
journal homepage: www.elsevier.com/locate/apenergy
https://doi.org/10.1016/j.apenergy.2021.116904
to control thermal comfort along minimizing energy costs [5]. These conflicting aspects become more crucial in recent architectural design layouts which favor buildings with a high portion of glazing areas. Thus, it is a necessity to apply appropriate measures to predict AFs’ perfor-mance at early stages of design.
In recent years, a wide range of AFs have been installed including roller shades, light shelves, switchable windows, venetian blinds etc.
[6]. According to several studies [7,8], venetian blinds are the most commonly used. These shading devices can be controlled either by the users directly (e.g. manual [8] or interfaces [9]) or automatically through implemented sensors within two main strategies called open- loop or closed-loop mechanisms. An open-loop control mechanism often feeds outdoor environmental variations into the algorithm without any feedback loop [10,11], while a closed-loop control mechanism embeds a feedback loop from indoor environment [12]. However, the aim of the entire proposed shading control strategies is delivering user comfort along maximizing the energy savings [13].
Utilizing automation systems initiates the potential of monitoring the indoor comfort in three levels: (1) interacting with physical variables via sensors, (2) executing the data in a control logic, and (3) enabling automated adjustments from physical measurements to actuators. Therefore, they can deliver optimum conditions considering the out-door/indoor dynamic changes without disturbing users to operate the shades if they are correctly designed. To this end, several studies out-lined the positive effects of automatic shading controls [7,10]. However, their overall performance is still under investigation due to potential limitations such as high number of shading adjustments over automated control by users [14], or the level of complexity and its acceptance by users [15].
In the literature, user comfort has been addressed mainly based on thermal or/and visual comfort metrics as control variables including: indoor temperature [16], outdoor temperature [17], solar radiation
[18], sky condition [19], task illuminance [20], Daylight Glare Index (DGI) [21], Daylight Glare Probability (DGP) [22], Daylight Autonomy (DA) [23], spatial Daylight Autonomy (sDA) and Annual Sun Exposure
[24], Useful Daylight Illuminance (UDI) [25], vertical eye illuminance (Ev) [26], glare frequency [27], and so forth. But, to ensure a
comfort-able indoor condition, designers need to choose an appropriate control strategy based on climatic variations and user visual/thermal demands
[28]. In most cases, researchers automated the shading system when it exceeded a certain threshold by utilizing a built-in control algorithm to keep user’s comfort in acceptable range.
1.2. Control thresholds
The impacts of current automatic control strategies for AFs on energy loads and indoor environmental quality can be underestimated or overestimated. This is because a successful shading control strategy should correspond to two dynamic changes instantly; (1) outdoor environmental conditions, and (2) user comfort demands. The climate dictates non-linear variations in the form of solar radiation, sky coverage, temperature and so forth that results in uncertain solar gain and daylight penetration into the indoors. Therefore, coupling electric
lighting controls with daylight availability is an essential method to reduce the electrical energy demand automatically when there is suffi-cient daylight. However, there is no agreement on choosing the opti-mum location of artificial lighting sensors [7], but in the literature, studies mostly focused on task plane conditions [23,29,30]. As a step further from existing studies, instead of satisfying only a single condition such as maintaining indoor task illuminance level, recent studies inte-grated multi-objective controls to control both thermal and visual comfort simultaneously [31,32]. In particular, in most cases researchers investigated venetian blinds and their adjustments through certain controls including; deploying/retracting the entire system, or changing the slat angles as either fully-closed/open [33] or in sequential inter-mediate steps [34].
Although the number of studies that investigated automatic shading controls are quite large, but they were mostly adopted by a pre-defined threshold that could potentially impact their performance significantly. As an example, Table 1 outlines the studies that used solar radiation as a parameter to adjust the shading system in which emphasizes a lack of agreement on a specific control activation threshold.
This limitation embeds a wide range of other parameters in the literature such as vertical eye illuminance (Ev) [23,37,48,49], view
luminance [50], window transmitted solar radiation [35,39], task
Fig. 1. Examples of adaptive facades [4]. Table 1
Recommended activation thresholds in case of solar radiation.
Reference Location(s) Climate(s) Threshold(s) (W/ m2)
[35] Boise, USA Hot 120
[25] Mannheim, Germany Cold 50
[24] Montreal, Canada Cold 610
Boulder, USA Temperate 570
Miami, USA Tropical 530
Santiago, Chile Warm and
Temperate 450
[23] Freiburg, Germany Cold 150
[16] Catania, Italy Warm and
Temperate 200
[21] Singapore Tropical 100, 150, 200, 300
Phoenix, USA Hot Inchon, South Korea Subtropical Hamburg, Germany Temperate
[36,37] Aalborg, Denmark Cold 100, 150
[32] Rome, Italy Subtropical 150
[38] Daejeon, South
Korea Subtropical 50
[39] Portugal Temperate 50
[40] Sheffield, UK Temperate 150
[41] Boston, USA Humid 50
[42] Vienna, Austria Cold 200
[43] Berkeley, USA Subtropical 15
[44] Montreal, Canada Cold 20
[31] Brussels, Belgium Temperate 250
[45] Brussels, Belgium Temperate 50
[14] Weilheim, Germany Cold 50
[46] Toronto, Canada Cold 233
illuminance [2,20,51], and indoor/outdoor temperature [16,17,36,52]
that are used as control inputs to adjust a shading system but still there is no consent on the thresholds among studies. These differences are mainly due to the performing of different case studies’ specifications such as the physical dimensions, sensors location, user positions and distance to the window, shading system, and more importantly the climate. In addition, the implication of commonly-used shading control scenarios on energy load and user comfort is not clear and a comparative analysis is needed to outline the significance. There are only few studies that investigated the effectiveness of a control scenario with a range of thresholds on glare index and lighting load [21], or developing a framework to map the effects of control thresholds on user comfort [53]. However, these studies assumed the shading system to be fixed during a year [21], or it is only limited to solar radiation as the main control driver of the shading system [53]. Therefore, knowing the potential feedback of different automated shading controls on user comfort and energy load help designers, façade engineers, and building operators to choose the right shading control decision at early stages of design. As a result, this research stands as an addition to the work done by con-ducting a comprehensive simulation-based comparison among different control strategies, thresholds and climates to fulfill the aforementioned research gaps by answering the following research questions:
– What are the effective environmental parameters on automatic shading controls?
– What are the implications of shading control strategies on energy savings and indoor comfort?
2. Research methodology
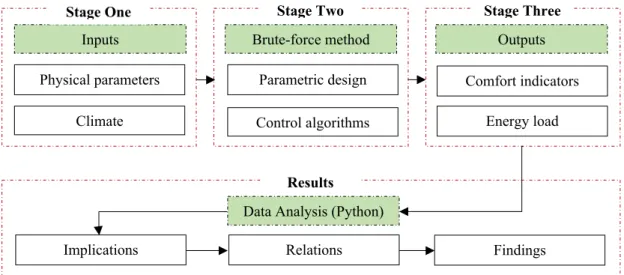
In this research in order to investigate the energy saving potential of adaptable venetian blinds, the modelling inputs are delivered to a parametric interface called ‘Grasshopper’ through environmental plu-gins Ladybug-tools. These tools are facilitated with validated engines including EnergyPlus and OpenStudio for thermal calculations along Radiance and Daysim engines for daylighting simulations. This approach allows the designer to simulate the entire number of design alternatives (brute-force method) that would be a time-consuming approach using typical building simulation tools; however, it helps to increase the robustness of the study against uncertainties. The research process includes three main stages as shown in Fig. 2 from collecting inputs till deriving outputs that will be explained by the following subchapters. Eventually, the outputs are post-processed and analyzed through Python programming language to study the implications of
variables on energy load and occupant’s comfort, relations within var-iables and outputs, and main findings.
2.1. Modeling information
This work utilizes the building geometry and material specifications based on a reference case study developed by Reinhart for adaptive fa-çades and lighting systems for office spaces [54]. Although, only selected modeling inputs are taken from the reference and other build-ing settbuild-ings related to the aim of this study will be explained accordingly.
The reference case study represents an elevated office unit with one south facing window (in northern hemisphere) with a window-to-wall ratio (WWR) of 45%. Fig. 3 illustrates the three-dimensional model and associated dimensions. The south-facing wall (in northern hemi-sphere) is exposed to outdoor environmental conditions such as solar radiation during a day with no nearby obstructions, while interior walls, ceiling and floor are adiabatic surfaces. Additionally, authors extend the variations with respect to building orientation and WWR to investigate architectural layout significance within different shading controls. In overall, three building orientations are considered as South, East, West for north hemisphere, while North, East and West for south hemisphere. Similarly, WWR can vary between 35%, 45%, and 55%. The glazed portion of the envelope is a double-glazed window with low-e coating. Particularly, the building is a single office space as one thermal zone that
Fig. 2. Research methodology workflow.
all simulation settings except the shading system are equal for each time interval during a year. Table 2 shows more information with respect to the thermal conductivity of the envelope.
Internal loads are considered as an open-plan office program asso-ciated with occupancy profiles, equipment and lighting. Mainly, the office is occupied from 8AM to 6PM during weekdays which is a high occupancy rate in line with the IES LM-83-12 [55]. Unlike the reference case study [54], it is assumed that the space is occupied with a single user seated towards window and is performing typical office work on a work. This assumption results in a 0.033ppl/m2 occupant load. With
respect to equipment loads, it is assumed a peak load of 8 W/m2 for a single occupant using one LCD monitor and laptop. The choice of having only one occupant is due to the aim of this study which aims to inves-tigate the effectiveness of different control variables and their thresholds on lighting load and visual comfort. The office is equipped with auto-mated venetian blind system, in which the target task illuminance with a height of 0.75 m for electric lighting is fixed at 500 lx (Fig. 4). This is in agreement with a study that explored the probability of switching on the lights after 500 lx is almost zero [46]. Moreover, the electric lighting fixtures are controlled through a continuous dimming control with a peak load equal to 10.1 W/m2. To this end, if lightings are switched off
(fL,min) due to the sufficient indoor task illuminance, a minimum light
output fraction equal to 0.15 is applied and when the indoor illuminance (itot) is lower than threshold (iset), the required fractional power will be
calculated as fp. fL= iset− itot iset (1) fp= ⎧ ⎪ ⎨ ⎪ ⎩
fp,min for : fL<fL,min fL+ (1 − fL) − fL,min 1 − fL,min for : fL,min≤fL≤1 (2) where ⎧ ⎪ ⎪ ⎪ ⎪ ⎨ ⎪ ⎪ ⎪ ⎪ ⎩
fp final fractional power fL calculated light output fraction fL,min minimum light output fraction
iset illuminance threshold itot calculated illuminance value at sensor
This reference model aims to explore the implications of control variables associated with the automated shading system, thus applying a detailed HVAC system for a shoebox model is not within the scope. As a result, an ideal air load system has been assigned to the model to control the heating and cooling set-point temperatures during occupied hours and set-back temperature during unoccupied hours. The ideal air load system has no physical representation in the model and will be able to meet the heating and cooling demands with 100% efficiency. No air
handling unit (AHU) or domestic hot water are considered in this study to make further comparison for each shading control scenario easier. The infiltration rate is 0.000092 m3s/m2 of external façade which
cor-responds to 0.5 ac/h according to ASHRAE 90.1 [57].
2.2. Location and climatic analysis
To investigate the implication of each shading control scenario on the energy load and user’s visual comfort, nine different cities have been selected based on ASHRAE climate zone that include a wide range of climatic conditions from different continents and both hemisphere. The selected locations are Melbourne (Australia), Cairo (Egypt), Singapore (Singapore), London (UK), New Dehli (India), Berlin (Germany), Mon-treal (Canada), Tehran (Iran), and Santiago (Chile), that their geographical specifications are sorted based on their climate zones in
Table 3.
The climate files are collected from ASHRAE IWEC2 database which each one contains hourly enviornmental factors. The data can be further imported as .epw files in building simulation tools that embeds Ener-gyPlus as the main calculation engine. Fig. 5 shows the variations of the most important environmental indicators for each city that might play a key role in developing a shading control strategy, including: dry bulb temperature (DBT) as outdoor temperature, direct solar radiation (SRdir)
and diffuse solar radiation (SRdiff) referring to solar irridiance on a
horizontal surface (e.g. roof), global solar radiation (SRglobal) as sum of
the SRdir and SRdiff, global horizontal illuminance (GHI) as the
avail-ability of daylight illuminance on a horizontal surface, and sky coverage (SC) that varies from 0 (clear) to 10 (overcast).
Table 2
Parameter settings in energy simulations.
Parameters Assigned Value(s) Space type Single Office Space Roof/Ground floor Adiabatic Interior walls Adiabatic
Exterior wall U-Value: 0.365 W/m2k
Window U-Value: 1.6 W/m2k, SHGC: 0.28, VT: 0.65 Internal loads Equipment: 8 W/m2
Infiltration ratio: 0.5 ac/h Lighting density: 10.1 W/m2 Number of people: 1 occupant Natural ventilation Not assigned
Solar distribution Full interior and exterior (with reflections) Shadow calculation method Time step frequency
HVAC system Ideal Air Load Heating set-point/set-back
Cooling set-point/set-back 21
◦C / 15.6 ◦C 24 ◦C / 26.7 ◦C Reference point 1 (P1)
Reference point 2 (P2) 0.75 m (height) for target task illuminance 1.2 m (height) for glare index (DGI)
Fig. 4. Continuous dimming control of artificial lighting [56]
Table 3
Geographical information of selected locations. City and
Country Climate Zone (CZ) Latitude (◦) Longitude (◦) Elevation (m) Time Zone (h) Singapore (Singapore) 0A 1.37 103.98 16 +8.00 New Dehli (India) 1B 28.58 77.20 216 +5.30 Cairo (Egypt) 2B 30.12 31.40 116 +2.00 Melbourne (Australia) 3A −37.81 144.96 32 +10.00 Tehran (Iran) 3B 35.68 51.31 1190 +3.30 Santiago (Chile) 3C –33.43 −70.68 520 −4.00 London (UK) 4A 51.5 −0.117 5 0.00 Berlin (Germany) 5A 52.47 13.4 49 +1.00 Montreal (Canada) 6A 45.5 −73.62 133 −5.00
2.3. Simulating automated venetian blinds
To date, all the BPS tools are originally developed for the purpose of static concepts where façade geometry and its properties is not consid-ered as a variable during simulation. Adaptive systems require more complex workflows that can correctly predict their performance along indoor/outdoor environmental variations; however, existing BPS in-terfaces lack of supporting such functions. Moreover, existing knowl-edge of modeling approaches towards AFs’ performance is fragmented which restricts choosing the right software and strategies. Nevertheless, conventional adaptive mechanisms in both micro (e.g. switchable win-dow) or macro (e.g. venetian blinds) level of façade are limited to certain performance and controlling criteria. Progressively, different graphical user interfaces have been introduced behind the BPS tools as dependent plugins that support this method such as Energy Management System (EMS) in EnergyPlus, user defined control macros (IDA ICE), APpro (IES VE), or W-editor (TRNSYS) [58]. Among them, EnergyPlus interface itself has a wide range of capabilities to control commonly-used adaptive facades (e.g. venetian blinds) and by coupling it with EMS as a user- customized coding plugin, it extends the shading control flexibility based on indoor/outdoor environmental conditions as sensors [59]. However, it requires a high knowledge of scripting by the user to manually overwrite the EnergyPlus calculations without recompiling of EnergyPlus source codes.
To that end, to employ an automatic shading control using Ener-gyPlus and EMS within Ladybug-tools, three main components need to be considered: (1) reading the indoor/outdoor environmental variables from predefined reference points in the simulation model, (2) passing the time-dependent environmental inputs through conditional
statements scripted in EMS as the main control logic, and (3) converting the control logic into physical reactions to adjust the shading system.
With respect to the input variables, five control variables including direct solar radiation (W/m2), solar incident radiation on window (W/
m2), illuminance level at task level (lux), transmitted solar radiation
from window (W/m2), and view luminance (Cd/m2) have been chosen
to compare their implications in different climates (Table 4). These control variables have been often used among previous studies
[9,20,24,36,60–62]; however, as stated in [63] there is no study to outline the correlation between climate and shading controls explicitly. Since each of the incoming signals into the control logic refers to a different environmental condition, an identical methodology is written for each control scenario. The first three control scenarios trigger the shading activation based on indoor environmental feedback whether from a sensor or user as closed-loop control algorithms. S1 takes the luminance value of the user’s field of view towards the window, S2 takes the transmitted vertical solar radiation through shading and window panes, and S3 is the most common used trigger, using the task illumi-nance at desk level (0.75 m). Alternatively, the other two scenarios employ solar radiation in form of outdoor horizontal direct solar radi-ation (S4) and incident vertical solar radiradi-ation on window (S5) within open-loop algorithms. Therefore, S1, S2, and S5 are mainly taking the window surface as the main source of incoming control signals.
Since there is no agreement on certain control thresholds and pre-vious studies investigated specific circumstances, in this study control domains have been selected with 10 and 100 increments with respect to solar radiation and daylight metrics respectively. This feature attempts to explore the implications of different thresholds for each scenario by covering a wide range of possibilities that recommended in the literature
[7].
In addition, the degree of freedom of venetian blinds is limited to certain actuations including lowering or retracting and tilting the slats. To reduce the computational effort, only the slat angles are controlled by the aforementioned scenarios. In this research, the actuation range is considered either 0 or 90◦which corresponds to fully-closed and fully-
open slats respectively. Thus, there is no intermediate slat position due to computational effort and limitations. Also, both slat sides have an equal physical and material property as stated in Table 5.
To that end, five different scripts have been added to the simulation model within Ladybug-tools that connects EMS to the calculation pro-cess. This is a necessary step to adjust the slat angles based on control scenarios. Therefore, to script the required control scenarios manually, definitions are defined in specific format that EMS can read and feed them into EnergyPlus to output energy and user’s comfort performance. One example of EMS scripting can be found in the Appendix.
2.4. Computational effort and outputs
As previously mentioned, Grasshopper and Ladybug-tools allow parametric simulations where the designer is capable of automating a wide range of analyses. In this research, five main variables are considered: (1) building location (Table 3), (2) window-to-wall ratio (35%, 45%, and 55%), (3) building orientation (East, West, South for northern hemisphere, and North for southern hemisphere), (4) control scenarios (Table 4), and (5) control thresholds (Table 4). Multiplying all possible combinations results in 15,390 simulation iterations that will be simulated on a cloud-based Windows Server with the following config-urations: Dual AMD EPYC Rome 64 Core CPU’s @2.25 GHz (Total 128 Core / 256 Threads), and 256 GB RAM. Furthermore, each combination results in four main outputs that are in line with the research aim as following:
– Total energy load including; normalized heating and cooling loads (Kwh/m2), and electric usage for artificial lightings (Kwh/m2),
– Total number of hours that exceeded typical lower and upper limits of indoor operative temperature (OT) as 21 ◦C and 24 ◦C equal to
heating and cooling HVAC set-points respectively (Table 2). It should be noted that indoor OT is calculated in the center of the zone,
– Total number of hours that exceeded the acceptable maximum in-door task illuminance as 2500 lx suggested by [64]. Task illuminance sensor is assumed to be at the same level of office working desk (P1 in
Table 2),
– Total number of hours that user experiences discomfort glare through an index called Daylight Glare Index (DGI) based on Eq.3, in which above 22 is recommended unacceptable [56,65]. View di-rection of the user is considered at user’s eye level in sitting position (1.2 m) looking towards window,
DGI = 10log10 [ 0.478∑ n i=1 ( L1.6 s.i∙ω0.8s.i Lb+0.07ω0.5∙Lwin∙P1.6i ) ] (3) where ⎧ ⎪ ⎪ ⎪ ⎪ ⎨ ⎪ ⎪ ⎪ ⎪ ⎩
Ls luminance intensity of glare source (window) Lb Background luminance
ωs Solid angle towards glare source P Position index
Lwin Window luminance
– Total number of hours that luminance of the user’s view direction to window, in which above 1800 cd/m2 occupants close the blinds
according to [50].
3. Results
For the nine selected cities (Melbourne, Cairo, Singapore, London, New Dehli, Berlin, Montreal, Tehran, and Santiago), the results are studied according to the inputs seperately based on the two main do-mains: thermal performance including lighting and cooling/heating loads, and user comfort including indoor operative temperature, glare index, view luminance and indoor task illuminance. Findings are explained in the following sections.
3.1. Evaluation based on building location
With respect to the building location as the main source of com-parison regardless of other paramteres listed as inputs, Fig. 6 shows Berlin and Singapore have the lowest and highest mean energy con-usmption fluctuations respectively. Although, the minimum and maximum energy loads vary from 6 kWh/m2 (London) to 169 KWh/m2
(Singapore). This finding shows the significant implications of shading control strategies especially in Singapore where the climatic variation such as sky coverage and outdoor temperature is insignificant, but thermal load changes for each control scneraio is 15% (Table 6).
In case of lighting loads variation, it is expected solar-related metrics such as illuminance, solar radiation and sky coverage play significant roles in shading control performance. To this end, Berlin and Cairo have the least and the most lighting load fluctuations; however, sky coverage is the most and the least in Singapore and Cairo respectviely. As a result,
Table 4
Control scenarios.
Scenario Variable Position Source index in
EnergyPlus Variable name(s) in EnergyPlus Domain (min–max) Increments S1 View luminance (Cd/
m2) Indoor Window (vertical) Daylighting Window Reference Point ‘X’ View Luminance 300–4000 100 S2 Transmitted solar
radiation (W/m2) Indoor Internal surface of window (vertical) Surface Window Transmitted Solar Radiation Rate per Area 15–385 10 S3 Task illuminance (lux) Indoor Task plane level
(horizontal) Daylighting Reference Point ‘X’ Illuminance 300–4000 100 S4 Direct solar radiation
(W/m2) Outdoor Environment (horizontal) Site Direct Solar Radiation Rate per Area 15–385 10 S5* Solar incident
radiation on window (W/m2)
Outdoor External surface of
window (vertical) Surface Window Blind Beam to Beam Solar Transmittance (A) Surface Outside Face Beam Solar Incident Angle Cosine Value (B) Surface Window Transmitted Diffuse Solar Radiation Rate (C)
15–385 10 * S5 = A × B + C.
Table 5
Venetian blinds properties.
Slat orientation Horizontal
Slat width 0.05 m
Slat separation 0.05 m Slat thickness 0.00025 m
Slat angle Ranges from 0◦(fully-closed) to 90◦(fully open) Slat conductivity 221 W/mk
Reflectance 90%
GHI shows a stronger environmental factor that can affect the overal lighting performance in which Berlin has the least trend among other locations (Fig. 5).
Similarly, Fig. 7 illustrates the potential variations corresponding to the user comfort objectives that following results can be drawn:
– The number of hours that DGI exceeded varies from 0 to 1179 h, in which the least variation can be observed in Singapore due to
insignificant solar-related environmental variations, while it in-creases in relatively-clear sky coverage with high seasonal variations of GHI and SRglobal like in Tehran,
– In all cities, there is no significant changes in regard to exceeded task illuminance (above 2500 lx),
– The number of exceeded view luminance (above 1800 cd/m2) rea-ches to above 2000 h during a year in Tehran, Cairo and Santiago,
Fig. 6. Lighting and thermal loads variations based on building locations. Table 6
Variations of mean energy loads and mean discomfort hours based on WWR.
City Lighting (↓) Thermal Load (↑) DGI (↑) OT (↑) Illuminance (↑) View Luminance (↑)
Berlin 4.75 11.77 42.85 6.47 37.24 5.71 Cairo 4.85 6.05 43.91 3.53 0* 1.73 London 4.82 11.86 47.73 9.65 42.15 10.37 Melbourne 5.14 7.28 48.28 11.46 2.29 2 Montreal 4.64 8.24 53.24 3.85 24.23 7.72 New Delhi 5.01 5.77 25.72 2.43 41.87 0.52 Santiago 5.1 7.43 50.31 8.89 70.72 1.71 Singapore 5.59 4.87 40.71 0* 0* 6.72 Tehran 4.07 8.41 33.9 3.4 40.6 3.45
Values are in percentage.
while records show the minimum distribution in Berlin which is exposed to the least GHI and solar radiation,
– With respect to exceeded operative temperature, it can be noticed that in warmer climates such as Cairo or Tehran, the shading control is more effective to improve the thermal comfort comparing to colder climates such as Berlin or London. However, no global agreement can be concluded from Fig. 7. In addition, there is no improvement in case of Singapore where in all design scenarios, thermal comfort never meets comfortable range.
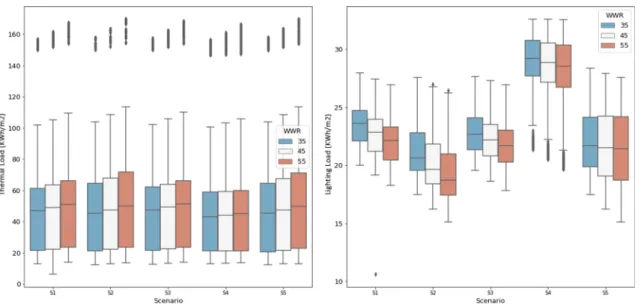
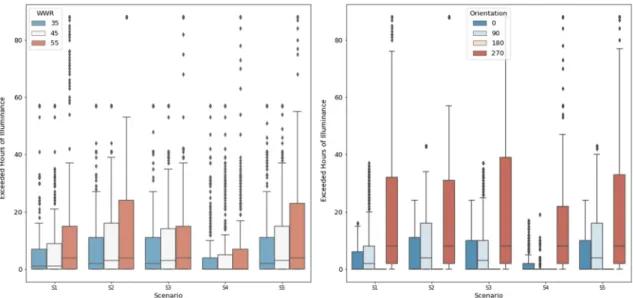
3.2. Evaluation based on window-to-wall ratio
Increasing the window-to-wall ratio influence both energy loads and user comfort performance through solar gains and daylight penetration respectively. Table 6 depicts the overall variations that are caused by changing the window-to-wall ratio of the building in which results are derived by the following equation in percentages, where i corresponds to the building location:
Variationi=
(
1 − minimum mean value of objective
maximum mean value of objective
)
×100 (4) In overall, results show a significant variation within each objective and building location. In particular, increasing WWR impacts all of the
objectives incrementally (↑) except lighting load that is affected reversely (↓) due to higher daylighting penetration. However, in certain locations (Singapore and Cairo), no changes are observed with respect to exceeded illuminance and operative temperature. On the other hand, large variations in DGI and excessive task illuminance require significant attention in choosing the appropriate automatic shading control stra-tegies as the potential negative impacts of increasing WWR is remark-able high. For example, increasing WWR caused higher occupant discomfort glare experiences by 53.24% (Montreal) and excessive in-door illuminance by 70.72% (Santiago). In terms of energy loads, thermal load is more sensitive to WWR changes from 4.87% (Singapore) to 11.86% (London) comparing to lighting load. Moreover, Melbourne has recorded the highest variation of OT up to 11.46% comparing to Montreal with the lowest DBT in which emphasizes a strong correlation between WWR, clear sky condition and high SRglobal to automate the
shading system.
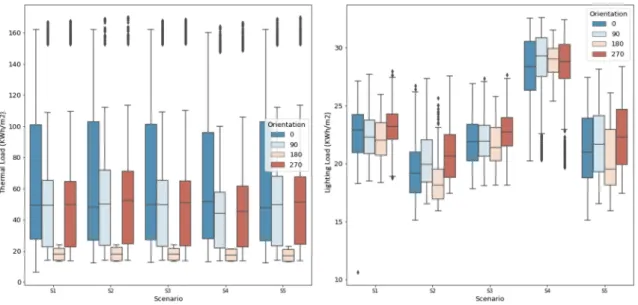
3.3. Evaluation based on building orientation
Following the next comparison, automatic shading control perfor-mance can be affected by building orientation which takes the advan-tage of sun position with its positive or negative implications on indoor environment. Using the same principle in the equation (Eq. (4)), Table 7 Fig. 7. Comfort objectives variations based on building locations.
draws variations from mean values of energy loads and discomfort hours with respect to building orientation. In this study, results show east (270◦) and west (90◦) orientations are behaving very similar in terms of
energy load. Moreover, a south-faced orientation for northern hemi-sphere (0◦) consumes more thermal energy comparing to southern
hemisphere (180◦), while lighting load variations quite similar except
for Singapore comparing to other objectives except (Table 7). This finding emphasizes the role of outdoor temperature fluctuations on thermal load regardless of shading control strategies, in which in both Melbourne and Santiago as southern-hemisphere cities, DBT is changing within a short domain (8 ◦C to 22 ◦C) comparing to northern-hemisphere
locations (− 10 ◦C to 35 ◦C) (Fig. 5). Although, the highest excessive OT
variations corresponds to Melbourne and Santiago by 14.87% and 16.39% respectively. Additionally, changing building orientation im-pacts visual discomfort hours remarkably in all locations that shows the high reliance of visual metrics on sun position.
3.4. Evaluation based on control scenarios
The implication of automatic shading controls can vary from different perspectives as shown from Figs. 8–17. Basically, this is due to the potential of each control scenario and the environmental trigger that cause the shading operation in hourly basis. Fig. 8 illustrates the relation between WWR and control scenarios in which activating shading system based on transmitted solar radiation (S2) performing the best to save lighting loads by increasing WWR. It is clear that all control scenarios lead to excessive thermal load if WWR increases (Fig. 8 and Fig. 9). However, in case of using direct solar radiation as trigger (S4), it im-proves the thermal performance insignificantly, while it has the worst performance to save lighting loads that is due to the high number of
times that shading system is fully-closed.
Taking building locations into account, Table 8 draws the energy load differences in which four cities (Berlin, Cairo, London, and Mon-treal) have equal improvements by 26%, while in Tehran automated shading control could reduce thermal load from 61.12 to 41.41 KWh/m2
(47%). In addition, both S2 and S5 increased thermal loads equally in Cairo, New Delhi and Singapore that show their competence in mini-mizing energy performance. In extreme climatic conditions like Singapore, the least improvement is yielded. This finding shows the higher effectiveness of shading controls in climates that experiences higher climatic variations throughout a year. Alternatively, cities like Melbourne and Santiago that are experiencing similar climatic fluctua-tions, are showing similar energy savings potential by 37% and 39% respectively. With respect to control scenarios, S5 and S4 are the main alternatives to reduce the thermal loads, while S5 and S2 are responsible for maximizing the loads. Moreover, in all cities except London, only outdoor-based control scenarios are performing the main roles in changing absolute maximum and minimum energy loads. This obser-vation shows the potential of such control scenarios to close the shades before permitting the penetration of unwanted solar gains to indoors.
With respect to both WWR and building orientation variables, unlike thermal load variations, there is a significant difference to choose the appropriate shading control scenario based on lighting loads. As a result, both S2 and S5 perform equally the best to save energy comparing to other control scenarios for a south-faced building with 55% WWR. Although, control scenarios’ impacts on user comfort performance are different and vary among objectives as described in the following:
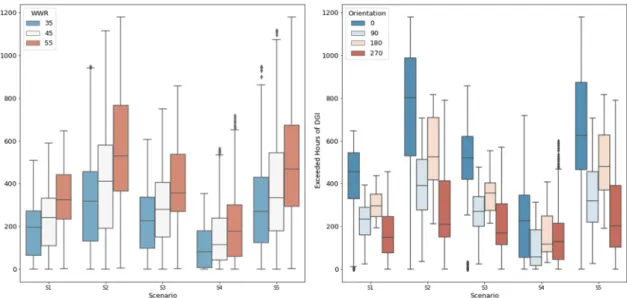
Control scenarios vs. exceeded DGI:
Table 7
Variations of mean energy loads and mean discomfort hours based on building orientation.
City Lighting Thermal Load DGI OT illuminance View Luminance
Berlin 4.1 6.26 87.18 4.51 82.92 57.46 Cairo 4.43 2.94 63.22 6.16 100 29.64 London 4.87 11.95 85.9 8.3 96.5 59.27 Melbourne 5.57 10.49 65.32 14.87 100 44.26 Montreal 4.5 7.91 75.5 5.58 100 51.53 New Delhi 3.53 1.36 64.4 4.76 100 24.27 Santiago 4.05 10.06 63.11 16.39 100 35.85 Singapore 1.13 2.87 95.85 0 0 69.19 Tehran 4.25 11.42 74.56 5.6 100 38.35
Values are in percentage.
– The median values in case of S4 is the least except in Singapore where S1 performs slightly better,
– It can be noted that SRglobal and SC are the most effective factors on choosing the proper shading control strategy and imposing the range of exceeded discomfort hours in all cities. For example, in Cairo, Tehran and New Delhi, this range is very similar; however, S4 per-forms the best in Tehran among all other cities with a median value close to zero (Fig. 10),
– Looking at absolute maximum values, in several cities (London, Melbourne, Berlin, and Singapore) S1 performs better than S4 which can be an alternative control design especially in spaces where using an indoor sensor is more favorable (Fig. 10),
– When WWR and building orientation are the main concerns (Fig. 11), the discomfort glare index range is the least in case of S4 scenario where results show the direct impact of solar radiation on user’s visual performance,
– Using transmitted and incident solar radiation sensors increases discomfort hours remarkably as worst cases,
– Luminance and illuminance-based scenarios (S1 and S3) control the glare index similarly, although S3 causes higher discomfort glare hours but the overall difference is less than 100 h for all cities (Table 9),
– Increasing WWR results in higher discomfort glare hours,
– In case of building orientation, a south-faced building in north hemisphere has the highest discomfort glare range from 0 to 1179 h, while in the south hemisphere it decreases to a maximum of 815 h, – In overall, the mean exceeded hours of glare index varies from 61 h
(S4) to 585.3 (S2) in which both thresholds are observed in Tehran city (Table 9). This finding is in line with the high fluctuation of
SRglobal domain of Tehran from 125 W/m2 to above 350 W/m2.
Control scenarios vs. exceeded OT:
– For all scenarios, there are times that operative temperature reaches maximum number as 8760 h which represents the entire year (Fig. 12) corresponding to Singapore city (Table 9) where all control scenarios could not improve user thermal comfort,
– Unacceptable operative temperature increases by adding WWR, – From Fig. 12, there is no significant difference between S1 and S3 on
discomfort OT like in London that the difference is only 37 h, – S4 performs the best in all orientations and window-to-wall ratios
and operative temperature can be improved up to 60% using S4
comparing to the worst control scenario (S5) in Santiago city (Fig. 13),
– Similar to previous finding, S4 has the highest contribution to improve the discomfort OT hours in all cities, in which apart from Singapore, the minimum and maximum ranges belong to New Delhi and Santiago respectively,
– Interestingly, the two extremes of the spectrum in all cities are caused by using an outdoor sensor (S4) and an indoor sensor (S2) while both are taking solar radiation in different ways as the main control input. This observation proves the existing challenges of choosing the sensor position even if the incoming signal is the same parameter,
Control scenarios vs task illuminance:
– Unlike previous two comparisons, S4 outperforms other scenarios insignificantly in which there are cases that median values among all control scenarios are less than 5 h difference like in London to limit unwanted indoor illuminance (Fig. 14),
– In several cities such as Cairo, Melbourne or Montreal, absolute minimum values are zero for the entire control scenarios which il-lustrates the main challenge of limiting maximum values among five control scenarios (Fig. 14),
– In Fig. 14, records show no discomfort hours in Singapore which is due to the cloudy sky condition throughout the year,
– Especially in Tehran, the overall exceeded range is the highest and S4 performs the most effective comparing to other location, although in Cairo that has similar environmental conditions, none of the control alternatives perform equally effective with the least exceeded discomfort hours (Fig. 14),
– As shown in Fig. 15, the overall discomfort domains regarding WWR are relatively similarly in case of S1 and S3, while S4 and S5 performs the best and worst to control excessive task illuminance respectively, – With respect to building orientation, there is no excessive task
illu-minance for a south-faced space in south hemisphere (Melbourne and Santiago), while an east-faced building performs the worst for all scenarios,
– Comparing to other comfort objectives, number of outliers are remarkably higher that shows a non-linear response due to the impact of different activation thresholds on shading control strategy. Control scenarios vs view luminance:
– In contrary to previous findings, south-faced building in Melbourne or Santiago increases the discomfort range more than north hemi-sphere locations. This means the studied control scenarios are not ideal for south hemisphere locations to improve discomfort level regarding view luminance (Fig. 16),
– Having higher WWR increases the mean excessive view luminance except when the control scenario is based on task illuminance that shows an inverse correlation between WWR and an illuminance- based shading control,
– From Fig. 17, it is noted that S4 has a distinct influence on controlling user’s view luminance starting from nearly zero hours up to almost 1000 h, although it has the least impact in Singapore,
–S2 performs the worst in all locations (Fig. 17) and following pre-vious finding, controlling venetian blinds by an outdoor sensor po-sition could limit user’s view luminance more effective than using an indoor position since in former case it aims to close the shades before user meets discomfort condition,
–Comparing to the other two visual comfort indicators (task illumi-nance and glare index), the maximum absolute values are remark-able higher throughout a year especially in Tehran (up to 2500 h)
(Fig. 17). This observation potentially illustrates the existing short-comings of the investigated control alternatives to limit the user’s view luminance,
Following the above individual findings, Table 9 outlines the overall performance of each control scenario based on building location. In practice, it can be noted that using an automated shading control cannot deliver ideal comfort for users in all locations. For example, in Singapore visual comfort objectives are in comfortable range most of the time while operative temperature never meets the comfort criteria. In addi-tion, climatic condition and its variation causes a unique shading control response on user’s comfort demands which is evident from Table 9. Although, the overall performance among control scenarios can be prioritized from S2 as the worst scenario to S4 as the best scenario. Alternatively, maximum and minimum values are highlighted in colors to identify the optimum control scenario for each city, in which S4 outperforms other scenarios in improving the comfort condition in all cities which is mainly due to the fact that it closes the shading position most of the time. Therefore, if view to outdoor is a concern, then this strategy might cause potential problems. Exceptionally, S1 shows a
distinctive control strategy only in Singapore regarding discomfort glare. Nonetheless, there are occasions that there is no optimum shading control solution and all scenarios result in same discomfort level like in Cairo and Singapore.
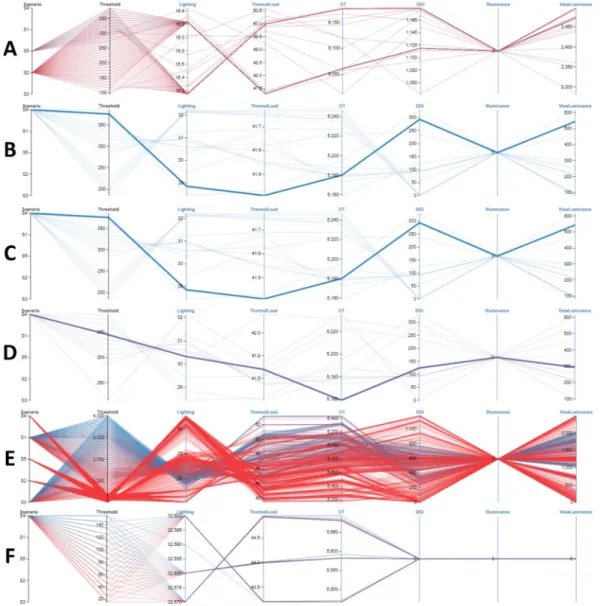
3.5. Evaluation based on activation thresholds
In practice, activation thresholds define the controlling behavior of a shading system which directly impact its performance. Due to the high number of simulation iterations, a web-based parametric visualizer called ‘Design Explorer’ is used to illustrate possible design solutions based on certain objectives. As shown in Fig. 18, black column headings for each column corresponds to the inputs while blue headings are representing the outputs. For the purpose of this research, Tehran city is selected to study its variations in more detail since using an automated shading control could improve the thermal loads by 47% according to
Table 6. Design Explorer allows creating parallel coordinate charts for designers to verify different design scenarios to find optimum solution. To this end, Fig. 18 shows the possible alternatives in Tehran as an example and the following results are outlined:
(A) Optimum lighting load: Records show there are multiple alter-natives using either S2 or S5 with a minimum threshold of 135 W/m2 and 345 W/m2 respectively. Maximum threshold is 385
W/m2 for both scenarios.
(B) Optimum thermal load: Fig. 18(B) shows S4 with 375 W/m2 has
the highest contribution to save thermal load.
(C) If minimum exceeded OT hours is the aim, since it is facilitated by HVAC system based on predefined heating/cooling set-points, the same control scenario (S4) but with a different threshold equal to 345 W/m2 is recommended (Fig. 18(C)).
(D) If minimum exceeded DGI hours is the aim of the design, S4 outperforms other scenarios while the threshold ranges from 15 to 325 W/m2.
(E) If exceeded task illuminance should be minimized, all control scenarios perform equally efficient which means in most cases indoor task illuminance did not exceed 2500 lx; however, in cases with lower uncomfortable threshold (e.g. 1000 lx) results could suggest alternative solutions accordingly.
(F) If exceeded view luminance at user’s view is the aim to improve, then results recommend S4 with a threshold between 15 to 155 W/m2.
Fig. 11. Relation between window-to-wall ratio, orientation and glare index.
The above outcomes are only subjected to Tehran city and cannot be generalized for other cities because shading control performance highly relies on outdoor environmental circumstances. This is also approved in
Table 10 which highlights the optimum control scenarios and thresholds with respect to individual energy and comfort objectives for each loca-tion. In all cities, using transmitted solar radiation on inner side of the window (S2) and incident solar radiation on outer side of the window (S5) are performing the best to reduce the lighting loads, although a wide range of activation thresholds can be used. This means from a certain threshold like 125 W/m2 in Berlin, London, and Melbourne no
more improvements are expected. On the other side, minimum thermal loads are derived by inconsistent control scenarios and thresholds among different cities as controlling indoor temperature depends on incoming solar gain and number of hours that HVAC system requires to deliver set-point temperatures. To this end, closing the shades based on direct solar radiation (S4) shows promising results in most cities like Cairo, New Delhi or Tehran where sky coverage is mostly clear. Inter-estingly, in cold climates such as London, Montreal, and Berlin, using high thresholds are more favorable to keep the shades open. Similar to thermal loads, S4 plays a significant role to reduce the exceeded OT hours in most cities except London and Singapore where in latter case no
improvements could be achieved using automated shading system (Table 9). In particular, it is evident that using S4 with a minimum threshold of 15 W/m2 to trigger closing the shades, prevent potential
problems due to discomfort glare especially in hot climates such as Cairo, Tehran, or New Delhi. However, there are few cities like Berlin, London and Singapore in which no single shading control strategy is expected to perform the best. In this study, automatic shading controls have the minimum implications on exceeded task illuminance except in Cairo, while S4 outperforms other scenarios with minimum threshold in all cities to control excessive view luminance at user’s view field. Along with previous findings in Table 9, automating venetian blinds using an open-loop control mechanism based on direct solar radiation has the greatest potential to control thermal load and comfort objectives in most cities due to its earlier activation trigger to close the shades. However, this is not the case when saving lighting load is the first priority and more importantly, when sufficient task illuminance and view to out-doors are needed by users.
4. Discussion on the findings
The use of sensor to automate a shading system either in an open-
loop or closed-loop mechanism can have positive impact on energy loads and occupant’s comfort. On the other hand, a parametric-based simu-lation approach enables the designer to evaluate hundreds of possible design alternatives for a comparative analysis and find an optimum solution at design stage. In this study, results reveal a strong correlation between global horizontal illuminance and lighting loads, while no correlation is found between indoor illuminance and glare index. In addition, there is no significant difference between east and west ori-entations in terms of energy load, although a south-faced building in north hemisphere consumes remarkably more than north-faced in south hemisphere. It should be noted that automating a shading system has the least positive implication on improving the indoor comfort in extreme climatic condition like Singapore. In fact, higher improvements are observed in cities with high environmental variations. Interestingly, in south hemisphere cities none of the proposed control scenarios and thresholds could reduce exceeded view luminance. In most observa-tions, controlling venetian blinds based on direct solar radiation (S4) with a threshold equal to 15 W/m2 delivers the least discomfort hours, in
which it could improve operative temperature by 60%. However, changing activation thresholds has the least impact on indoor operative
temperature when the space is air-conditioned. Nonetheless, an open- loop control algorithm performed better than proposed closed-loop scenarios, although users are highly satisfied if automatic controls meet their preferences, otherwise they are a source of discomfort (e.g. blocking their view connection).
The efforts of counterbalancing building energy performance and user comfort by means of adaptive facades are to be considered during design stage where the advantage of devising simulation techniques, is the integration of user-customized shading controls into parametric design. Comparing to existing studies that were mainly assessed an automated shading systems based on certain thresholds, or specific environmental conditions, a comparative analysis to represent the effectiveness of various control scenarios in different context was necessary to fulfill the gap. The findings here provide the façade engi-neers and building operators a better understanding to explore; firstly the role of architectural layouts (WWR and orientation) on shading control performance, secondly comparing the overall performance of control scenarios to pick the right sensor in a given location, thirdly choosing the right activation threshold for a given control mechanism and lastly, the prepared supplementary data in [66] provides an online
platform to choose an alternative solution manually.
5. Conclusion
This study reviewed the potential of automated venetian blinds and its performance on energy performance and occupant visual/thermal comfort by overriding EnergyPlus control language utilizing Energy Management System and Ladybug-tools. This algorithmic-based meth-odology allows the designer to test multiple control scenarios at design stage and compare the control varieties. To this end, a brute-force method was applied to simulate 15,390 different design alternatives parametrically and their implications were outlined to answer the following two main research questions:
What are the effective environmental parameters on automatic shading controls?
This research underpins a comparative analysis in nine cities repre-senting the existing climate zones throughout the world. Three envi-ronmental parameters depicted outstanding impacts on automatic shading control performance: (1) global solar radiation, (2) sky coverage, and (3) global horizontal illuminance. The first two factors revealed significant impacts on occupant comfort especially discomfort
glare, while global horizontal illuminance mainly influences illuminance/luminance-based metrics including lighting loads and discomfort luminance level for user view field. Based on results, auto-matic shading controls has the most influence on indoor environment in climates with high seasonal variations, while in climates with no large month-to-month variation like Singapore, minimum improvements could be found. In addition, no correlation between dry bulb tempera-ture and shading control performance was observed.
What are the implications of shading control strategies on energy savings and indoor comfort?
This study investigated five potential variables that are outlined in the literature as potential variables including climate zone, window-to- wall ratio, building orientation, shading control strategy and its acti-vation threshold. In particular, five shading control strategies with 38 different activation thresholds were tested. Each alternative depicted prominent contribution to an automated venetian blinds performance. According to the results, using solar radiation is the most effective control trigger comparing to illuminance or luminance-based triggers; however, its position impacts the automatic shading control remarkably. Indoor position resulted in the worst case control scenario (S2) in reducing thermal loads and discomfort hours, although it was an ideal
Fig. 15. Relation between window-to-wall ratio, orientation and task illuminance.
solution to save lighting loads. On the other side, an outdoor position (S4) could enhance both energy efficiency and occupant’s comfort regarding discomfort glare which is mainly due to the earlier activation of blind closure that might hinder daylight penetration at the same time
and thus, increasing the lighting loads as shown in Fig. 8 and Fig. 9. Therefore, choosing the appropriate shading control refers to the initial design objective. If the aim is targeting energy along a single comfort objective like glare, an open-loop control mechanism performs better
Fig. 17. City-based comparison between control scenarios and view luminance. Table 8
Table 9
Mean user comfort performance based on control scenarios and locations.
Green color: minimum value, Yellow color: maximum value.
than closed-loop controls. But, if the aim is delivering multi-comfort objectives such as reducing discomfort glare and keeping task illumi-nance in acceptable range to save lighting loads, then an integration of open-loop and closed-loop controls is necessary which still remains as a challenge for future studies.
Despite contributing to the field, the findings need to be treated with caution due to two main limitations: (1) due to the computational effort thresholds are limited to limited ranges for each control scenario that can be extended to higher number of possibilities; however, in this study the most common comfort targets are used, and (2) results are limited to an air-conditioned space, therefore more investigations are needed in case of a naturally-ventilated or mixed-mode buildings. Future studies can integrate multiple occupancy-related controls such as window opening/closing actions, lights switching, HVAC thermostat into auto-matic shading controls to verify their interconnections within different
context.
CRediT authorship contribution statement
Amir Tabadkani: Conceptualization, Methodology, Software,
Visualization, Writing - original draft. Astrid Roetzel: Supervision, Writing - review & editing. Hong Xian Li: Writing - review & editing.
Aris Tsangrassoulis: Writing - review & editing. Shady Attia:
Re-sources, Methodology.
Declaration of Competing Interest
The authors declare that they have no known competing financial interests or personal relationships that could have appeared to influence the work reported in this paper.
Appendix
The figure shows the fourth control scenario (S4) as an example of EMS scripting that collects the aforementioned three steps in a single additional script: (1) taking the identical variable name from EnergyPlus as ‘Site Direct Solar Radiation Rate Per Area’ to read the outdoor environmental condition, (2) using the in-built control type as ‘Slat Angle’ as an actuation to be overridden by control scenario, (3) managing the control logic before each time step in which ‘BeginTimestepBeforePredictor’ has been selected to ensure the implication of current indoor comfort condition on the next slat angle adjustments, and (4) basic ‘if’ conditional statements to adjust the shading system based on a threshold that itself is a variable as ‘XX’.
Table 10
Recommended control scenarios along their thresholds for each city and objective.
Objectives Lighting load Thermal load OT DGI Task illuminance View luminance
City Scenario Threshold* Scenario Threshold Scenario Threshold Scenario Threshold Scenario Threshold Scenario Threshold
Berlin S2-S5 125 to 385 S3 2600 S4 45 Und. Und. Und. Und. S4 15
Cairo S2-S5 105 to 385 S4 15 S4 15 S4 15 S4 15 S4 15
London S2-S5 125 to 385 S1 3800 S1 3800 Und. Und. Und. Und. S4 15
Melbourne S2 125 to 385 S5 165 S4 255 S4 15 Und. Und. S4 15
Montreal S2-S5 155 to 385 S2-S5 155 to 385 S4 15 S4 15 Und. Und. S4 15
New Delhi S2-S5 115 to 385 S4 15 S4 15 S4 15 Und. Und. S4 15
Santiago S2-S5 115 to 385 S5 15 S4 345 S4 15 to 65 Und. Und. S4 15
Singapore S2-S5 105 to 385 S4 15 Und. Und. Und. Und. Und. Und. S4 15 to 75
Tehran S2-S5 135 to 385 S4 375 S4 345 S4 15 to 325 Und. Und. S4 15 to 155
* Threshold units correspond to the identified control scenario accordingly. Und. = Undetermined.
Supplemental data
Supplemental data for this study can be accessed here: https://dx.doi.org/10.17632/2539k77m86.1.
References
[1] IEA. Outlook for energy: a perspective to 2040, 2019. https://corporate.exxonmo bil.com/-/media/Global/Files/outlook-for-energy/2019-Outlook-for-Energy_v4. pdf.
[2] Kim K, Lee H, Jang H, Park C, Choi C. Energy-saving performance of light shelves under the application of user-awareness technology and light-dimming control. Sustain Cities Soc 2019;44:582–96. https://doi.org/10.1016/j.scs.2018.10.005. [3] Kar P, Shareef A, Kumar A, Harn KT, Kalluri B, Panda SK. ReViCEE: a
recommendation based approach for personalized control, visual comfort & energy efficiency in buildings. Build Environ 2019;152:135–44. https://doi.org/10.1016/ j.buildenv.2019.01.035.
[4] Tabadkani A, Roetzel A, Li HX, Tsangrassoulis A. Design approaches and typologies of adaptive facades: a review. Autom Constr 2021;121:103450. https://doi.org/ 10.1016/j.autcon.2020.103450.
[5] Attia S, Bilir S, Safy T, Struck C, Loonen RCGM, Goia F. Current trends and future challenges in the performance assessment of adaptive façade systems. Energy Build 2018;179:165–82. https://doi.org/10.1016/j.enbuild.2018.09.017.
[6] Attia S, Lioure R, Declaude Q. Future trends and main concepts of adaptive facade systems. Energy Sci Eng 2020. https://doi.org/10.1002/ese3.725.
[7] Tabadkani A, Roetzel A, Li HX, Tsangrassoulis A. A review of automatic control strategies based on simulations for adaptive facades. Build Environ 2020:106801.
https://doi.org/10.1016/j.buildenv.2020.106801.
[8] O’Brien W, Kapsis K, Athienitis AK. Manually-operated window shade patterns in office buildings: a critical review. Build Environ 2013;60:319–38. https://doi.org/ 10.1016/j.buildenv.2012.10.003.
![Fig. 1. Examples of adaptive facades [4].](https://thumb-eu.123doks.com/thumbv2/123doknet/5646576.136648/2.892.459.835.489.905/fig-examples-of-adaptive-facades.webp)
![Fig. 4. Continuous dimming control of artificial lighting [56]](https://thumb-eu.123doks.com/thumbv2/123doknet/5646576.136648/4.892.58.316.473.666/fig-continuous-dimming-control-artificial-lighting.webp)
![Risiko- & [und] Schutzfaktoren der psychischen Gesundheit humanitärer Einsatzhelfer : eine systematische Literaturübersicht](data:image/gif;base64,R0lGODlhAQABAIAAAP///wAAACH5BAEAAAAALAAAAAABAAEAAAICRAEAOw==)