Distribution patterns and indicator species of butterfly
assemblages of wet meadows in southern Belgium
Javier Sawchik
1,2, Marc Dufrêne
1,3and Philippe Lebrun
11Unité d’Écologie et de Biogéographie, Centre de Recherche sur la Biodiversité, Université catholique de Louvain, Place Croix du Sud 5, B-1348 Louvain-la-Neuve, Belgium
2Sección Ecología Terrestre, Facultad de Ciencias, Universidad de la República, Uruguay
3Ministère de la Région Wallonne, Centre de Recherche de la Nature, des Forêts et du Bois, Avenue Maréchal Juin 23, B-5030 Gembloux, Belgium
Corresponding author : Philippe Lebrun, e-mail : lebrun@ecol.ucl.ac.be
ABSTRACT. Focal species are a valuable tool for proposing and evaluating management practices for biodiversity conservation. Assemblages of indicator species could be used to cover a wide range of habitats. We identified the main patterns of variation in butterfly assemblages on a diverse set of wet meadows in southern Belgium. We used multivariate techniques to identify the butterfly assemblages and the species that characterize these habitats. Three main assemblages were identified, based principally on the dominance of five butterfly species : Brenthis ino,
Clos-siana selene, Lycaena helle, Lycaena hippothoe and ProclosClos-siana eunomia. These are indicator species of different
habitats structured along a vegetation gradient. This gradient is partially determined by altitude and edaphic factors (base-richness, pH, fertility). We assume that focusing the conservation practices upon these species will promote the preservation of a wide range of organisms inhabiting the wet meadows.
KEY WORDS : butterflies, indicator species, multivariate analysis, wet meadows, biodiversity conservation.
INTRODUCTION
Almost every ecosystem on Earth is going through a strong anthropogenically induced disturbance biodiver-sity crisis, in which several thousands species are involved. Natural and semi-natural biotopes are suffering from high rates of modification and, as a consequence, the number of species threatened by extinction increases. In order to evaluate and monitor biodiversity as well as to implement conservation measures, the development and use of shortcuts is a necessity. Obviously, it is not viable to consider the development of a detailed study for each one of the endangered species. One possible approach is based on diversity measures, but it has several limitations like excluding particular taxonomic information about the communities (NOSS, 1990; DUFRÊNE & LEGENDRE, 1997).
The criterion of representative diversity which is based on the recognition of assemblages of species that are typical for specific habitats seems more interesting (DUFRÊNE &
LEGENDRE, 1997). A potentially useful tool is the
single-species approach based on focal or surrogate single-species, which can indicate ecological change, patterns of richness or habitat type (NOSS, 1990; CARO & O’DOHERTY, 1999;
FLEISHMAN et al., 2000). Focal species include umbrella,
flagship and different kind of indicator species (MCGE -OCH, 1998; SIMBERLOFF, 1998). Some of these species
could be used as targets for conservation efforts, assum-ing their preservation may help to protect other species that share the same habitats. Thus, the use of surrogate species may be a valuable tool for conservation planning, allowing considerable reductions of time and funding costs. Moreover, the use of assemblages instead of single species as indicators enables the enlargement of the focus
of the single-species approach to wider ecological situa-tions (KREMEN, 1992). Assemblages of species, with
determined species richness, level of dominance, and tax-onomic composition, can characterize different habitats. The use of a small set of surrogate species allows the inclusion of a broader range of habitats. Using keystone species may be an interesting alternative to surrogate spe-cies (SIMBERLOFF, 1998). However, the effort and time
demanded by this approach in the study of the community processes and the high rate of degradation of the biotic diversity, makes the use of other tools necessary (e.g., surrogate species) enabling conservation managers to develop faster responses to the anthropogenic distur-bances. Hence, important research effort is needed to select appropriate surrogate species.
Lepidoptera have been proposed as surrogate species by several authors (KREMEN, 1992; BECCALONI & GAS -TON, 1995; FLEISHMAN et al., 2000). Several features of
the butterflies make them good candidates for indicator, umbrella and/or flagship species (NEW, 1997; FLEISHMAN
et al., 2000; MAES & VAN DYCK, 2001). They have a wide
distribution, are relatively easy to sample and identify, and both as individuals and as species they show impor-tant numbers in different ecosystems (BLAIR, 1999; CARO
& O’DOHERTY, 1999; RICKETTS et al., 2002). They are
also strongly influenced by local weather and highly sen-sitive to environmental changes (SPITZER et al., 1997),
besides being charismatic insects that could attract the public attention. Finally, some authors have identified patterns of co-variation between the abundance and/or the richness of Lepidoptera and those of other taxonomic groups (BLAIR, 1999; SWENGEL & SWENGEL, 1999).
How-ever, these relationships are highly dependent on the taxa and the spatial scales considered (RICKETTS et al., 2002).
Butterflies are extremely sensitive to changes in vege-tation composition and structure, and different types of vegetation show different butterfly species composition. So, the butterfly assemblages may be used to characterize different habitats (ERHARDT, 1985). Plants are the
essen-tial source of nourishment of butterflies; some specific plant species provide the trophic resources for caterpil-lars, while others provide nectar for adults. The vegeta-tion can also play an important role for butterfly survival offering particular structural elements for sun-basking or mating and determining certain suitable microclimates (DOVER et al., 1997). Therefore, it would be expected that
butterflies respond more strongly to vegetation gradients than to edaphic gradients (SAWCHIK et al., 2003).
Human disturbance in Western Europe, including Bel-gium, has accelerated during the second half of the 20th century, resulting in a very high pressure on some particu-lar ecosystems. An important factor in this relatively recent panorama has been changes in land use, i.e. the abandonment of traditional agricultural practices (MAES
& VAN DYCK, 2001). Some of the most threatened
ecosys-tems are the semi-natural wet meadows, which have been abandoned or modified by modern and intensive agricul-tural practices. Many of these biotopes are being invaded by shrubs or trees, while others suffer eutrophication, pol-lution or acidification. Moreover, these modifications lead to an increasing isolation of the remaining fragments. The result is that semi-natural humid grasslands are seri-ously threatened in Belgium (GOFFART et al., 2000).
The objectives of this study were : (1) to describe the main variation pattern in the butterfly fauna of a wide range of wet meadows; (2) to identify the indicator spe-cies of the different habitat types; (3) to explore the rela-tionships between the butterfly assemblages and the vege-tation and the soil properties of the sites.
METHODS
Study area
The studied area is the basin of the Martin-Moulin river located in the Plateau de Tailles (Fig. 1). This high pla-teau (max. height 654 m) is situated in the Ardennes bio-geographical area, southern Belgium. Coniferous forests and pastures dominate the landscape. Immersed in this mixed forest-prairie matrix there are several semi-natural habitats, particularly a great diversity of wet meadows and mires. These meadows are biologically interesting habitats, displaying high levels of species richness and sustaining populations of many vulnerable species. Thirty-four sites were selected for the present work, all of them wet meadows. They account for all the main vegeta-tion associavegeta-tions that may be found in this area.
Field measurements
The definition of the sites was based on homogeneous floristic composition. All these sites show relatively well-defined boundaries. We identified all the plant species present in a quadrate of 5 (5 meters randomly placed in each site. The size of the quadrate is considered conven-ient to describe meadow communities (KENT & COKER,
1992). Then, the size of the quadrate was progressively increased until no new species were identified. Percent-age cover of plants was estimated visually. These vegeta-tion surveys were made during the summer of 1996.
Within each site, soil samples were collected at five randomly located places. The soil was sampled at 0-20 cm depth. The samples were pooled, and the following edaphic variables measured : soil pH, organic matter (OM), soil moisture (SM), total N, concentrations of Ca, K, Mg and Na. We also determined water-table depth (WT) recorded in 3 locations at each site in the summer of 1997. Values of WT were averaged prior to data analysis. As OM and total N were highly correlated (r > 0.9) we dropped N from the analysis data set. The chemical analy-ses were carried out at “l’Unité d’Écologie des Prairies” (UCL/AGRO/ECOP/Belgium).
Butterflies (Rhopalocera : Papilionoidea) were recorded by visual observation along zigzag transects from May to August of the years 1994, 1995 and 1996. More precisely, in each site we walked at a regular step until the total area was visited. We registered all the indi-viduals observed in a corridor of approximately 6 m of width. We sampled each site as many times as possible in sunny conditions (POLLARD, 1977; THOMAS, 1983). The
sampling program covered the flying periods of most spe-cies and ensured that a minimum of 3 sampling visits was made for each species in each site and each year.
As a measure of relative abundance of the butterfly species we used the maximum number of observed indi-viduals in each site (SMALLIDGE et al., 1996). This
meas-ure allows controlling sampling intensity and weather dif-ferences. Moreover, field experience in such habitats demonstrated that after three or four visits well distrib-uted along the main activity period, the maximum does not change considerably. Indeed, very similar results were obtained with additional analyses using other measures of relative abundance (e.g. mean, median, and sum). The
Fig. 1. – Study area in the Plateau des Tailles, Ardennes, Bel-gium.
data from the 3 years were pooled, so the maximum over the 3 years was used as a measure of abundance. Because all the sites were small (range from 0.1 to 2 ha; median = 0.775), they might be highly affected by stochastic effects. By pooling the data from different years, we inte-grate over annual weather effects on local abundance as well as extinction and rescue events generated by metap-opulation dynamics on a network of habitat patches (HANSKI et al., 1995; FLEISHMAN et al., 1999).
Assemblage structure and indicator species identification
The structure of the butterfly species assemblage was studied by ordination and classification methods. The but-terfly matrix details the distribution of 15 species in 34 sites and shows a 31% of zeros. As suggested by LEGEN -DRE & LEGENDRE (1998), rare species (< 1% of the total
number recorded) were removed from the analysis. In general, these rare species were represented by single, vagrant individuals that probably do not concern local populations. This category also concerns migratory spe-cies as Vanessa atalanta and Cynthia cardui. Moreover, correspondence Analysis (CA) and classification tech-niques are sensitive to the occurrence of rare species, so these species may distort the analysis impeding a reliable description of the main patterns of variation (EZCURRA,
1987). A distance matrix was constructed using the Bray Curtis coefficient. Hierarchical agglomerative clustering was conducted on the distance matrix using the UPGMA method. We used the IndVal approach developed by DUFRÊNE & LEGENDRE (1997) to identify the indicator
species of a site typology resulting from a clustering of the butterfly data set. For each step of the clustering proc-ess indicator species are revealed by an index (IV, i.e., Indicator Value) that combines an estimator of the species specificity and fidelity (MCGEOCH & CHOWN, 1998).
With this kind of approach the indicator species are defined as the most characteristic species of a site cluster, found mostly in a site cluster of the typology (specificity) and present in the majority of the sites belonging to that cluster (fidelity). The significance of the IV index is assessed by a permutation approach (1000 permutations). Species with significant high IndVal values (> 70 %) show strong habitat fidelity and specificity, so they may be considered as characteristic species of the assemblages (MCGEOCH et al., 2002.).
Ordination diagrams can be used to select a subset of the species as indicators (KREMEN, 1992). In order to
identify the main information axes, ordination was carried out performing CA. Because CA ordination scores repre-sent approximately optima localization of the species in the ordination plan (TER BRAAK & PRENTICE, 1988), the
diagram could be used to find assemblages of characteris-tic species along the gradients (KREMEN, 1992).
Butterflies-habitat relationships
A first approach to interpret the ordination results with the aid of external data was to compute Spearman correla-tion coefficients (rS) between CA ordination scores from the butterfly matrix and altitude (m). Additionally, we computed correlation coefficients between the scores of the CA axes and the diversity of the butterfly
assem-blages. In each site we computed species richness (S), Shannon diversity (H’) and evenness (E). The Simpson’s index (D) was used as a measure of dominance. All of these measures are widely used in ecology literature (KREBS, 1989; MAGURRAN, 1988).
In order to explore the relationships between the butter-fly fauna and the habitat, defined by the edaphic factors and the plant assemblages, we used CO-inertia Analysis (COA). The choice of COA instead of canonical corre-spondence analysis (CCA) was based on the high number of variables compared to the number of sites. When the number of variables equals the number of sites CCA becomes a CA (TER BRAAK & PRENTICE, 1988; JONGMAN
et al., 1995). COA is a symmetric ordination technique well adjusted to analyze data sets with many explaining variables and a relatively low number of sites (DOLÉDEC
& CHESSEL, 1994). It is a symmetric method because it
does not assume that one matrix is constituted by explain-ing variables and the other by explained variables. Indeed its use is well justified in this study because we are not attempting to explain the abundance of the butterfly spe-cies as a function of plant assemblages. We are merely interested in the associations between plants and butter-flies without assuming a causal relationship between them. In a first step, faunal and environmental matrices are analyzed by standard ordination methods as CA or PCA. In a second step, COA maximizes the covariance between the first axes of variation of the two matrices.
We performed two COA’s to link the CA ordination of butterfly data to vegetation and edaphic data. The first analysis (COA1) linked the butterfly ordination to an ordi-nation obtained by CA performed on the vegetation fre-quency data set. Because there was a high number of plant species recorded, and the fact that the great majority among them showed very low frequencies and cover val-ues, we decided to remove rare species from the data set to gain in clarity and computation efficiency, and to reduce noise and redundancy. The vegetation matrix details the distribution of 40 species and shows 53% of zeros. The second analysis (COA2) linked the butterfly ordination to a PCA performed on the correlation matrix of the edaphic data. The edaphic variables were log trans-formed prior to PCA. The signification of the co-inertia values was tested by a permutation procedure (1 000 per-mutations). Additionally, we performed another co-inertia analysis, COA3, to explore the relationships between veg-etation and edaphic factors.
CA was performed with the CANOCO software (TER
BRAAK & SMILAUER, 1998). We used the R package (CAS -GRAIN & LEGENDRE, 1999) to compute correlation and
dis-tance coefficients and to perform cluster analysis. The ver-sion 2.0 of the program IndVal (DUFRÊNE & LEGENDRE,
1997) was used to identify the indicator species. COA was performed with ADE-4 (THIOULOUSE et al., 1997).
RESULTS
We identified a total of 30 butterfly species but only 15 species were retained for most of the analyses (Table 1). The matrix of butterfly abundance used in subsequent analyses is presented in Table 2. Hesperoidea were mostly represented by two species : Thymelicus lineolus and T.
sylvestris. For practical reasons, Thymelicus species were
not retained for the analysis. These are two relatively common species that are not easily distinguishable in thefield.
TABLE 1
Number of individuals, number of occupied sites and butterflies codes (used as labels in the figures).
Code Species No.
individuals No. sites
AGL Aglais urticae (Linnaeus, 1758) 176 27
ANT Anthocaris cardamines (Linnaeus, 1758) 50 21
APH Aphantopus hyperantus (Linnaeus, 1758) 1,036 34
APO Aporia crataegi (Linnaeus, 1758) 56 20
ARA Araschnia levana (Linnaeus, 1758) 39 19
BRE Brenthis ino (Rottemburg, 1775) 799 26
CLO Clossiana selene ([Denis & Schiffermüller], 1775) 194 17
GON Gonepteryx rhamni (Linnaeus, 1758) 39 21
INA Inachis io (Linnaeus, 1758) 41 23
LHE Lycaena helle ([Denis & Schiffermüller], 1775) 243 22
LHY Lycaena hippothoe (Linnaeus, 1761) 102 18
MAN Maniola jurtina (Linnaeus, 1758) 251 32
PNA Pieris napi (Linnaeus, 1758) 120 29
PRA Pieris rapae (Linnaeus, 1758) 29 20
PRO Proclossiana eunomia (Esper, 1799) 221 22
Argynnis aglaja (Linnaeus, 1758) 2 2
Boloria aquilonaris (Stichel, 1908) 20 1
Callophrys rubi (Linnaeus, 1758) 15 10
Coenonympha arcania (Linnaeus, 1761) 5 4
Coenonympha pamphilus (Linnaeus, 1758) 10 4
Cynthia cardui (Linnaeus, 1758) 24 16
Erebia medusa ([Denis & Schiffermüller], 1775) 4 4
Lasiommata megera (Linnaeus, 1767) 2 2
Melitaea diamina (Lang, 1789) 32 12
Mellicta athalia (Rottenburg, 1775) 6 5
Papilio machaon (Linnaeus, 1758) 2 2
Pieris brassicae (Linnaeus, 1758) 15 11
Polygonia c-album (Linnaeus, 1758) 3 1
Polyommatus icarus (Rottenburg, 1775) 6 6
Vanessa atalanta (Linnaeus, 1758) 14 12
TABLE 2
Matrix of butterfly abundance, recorded as the maximum number of individuals observed in each site.
AGL ANT APH APO ARA BRE CLO GON INA LHE LHI MAN PNA PRA PRO
6 0 15 5 2 28 0 3 1 9 2 6 5 1 3 4 0 17 0 2 28 0 1 0 0 0 3 2 0 0 6 1 42 2 0 54 0 1 1 15 0 13 3 1 6 0 0 53 1 1 84 0 0 1 7 0 14 2 2 15 3 0 14 0 1 42 0 1 1 6 0 7 1 1 2 20 1 32 10 0 13 0 0 3 25 2 24 0 0 12 0 2 20 2 3 30 0 0 2 25 0 4 4 1 8 19 2 40 1 2 58 0 1 2 3 0 23 2 1 18 2 5 40 2 4 75 0 0 2 0 0 20 7 2 0 0 0 15 0 1 10 0 2 3 7 0 0 3 1 8 5 0 25 3 0 6 3 1 0 1 1 10 2 0 2 4 1 25 7 3 19 1 5 2 8 4 12 3 0 2 2 1 20 3 2 2 4 3 2 25 2 5 2 1 17 5 0 30 0 0 0 21 1 1 0 7 3 13 2 0 13 0 36 2 0 37 0 0 1 4 0 7 2 0 0 15 5 35 3 6 10 0 2 7 16 0 6 7 1 10 2 4 29 1 1 5 1 2 0 0 0 5 5 1 0 3 2 30 4 1 0 20 5 2 1 0 4 5 0 5 0 1 30 1 0 20 0 0 0 2 0 5 1 2 3 1 0 40 1 0 0 9 1 0 0 0 8 0 0 0 15 5 30 3 0 17 5 2 1 5 8 10 7 2 10 15 5 20 2 1 8 10 0 0 2 7 6 7 1 8 5 1 50 0 0 30 4 0 0 0 10 5 1 0 0 1 2 46 0 2 2 2 1 2 9 6 5 3 1 7 0 3 33 0 2 0 6 0 1 29 4 1 4 1 35 3 2 32 0 0 0 27 0 0 0 13 6 7 0 0 1 0 15 0 0 0 53 1 1 0 10 0 1 3 0 2 0 25 1 0 10 0 1 2 38 0 2 2 0 12 11 0 64 2 1 92 0 3 1 0 1 12 0 0 0 7 0 43 0 0 0 1 0 0 0 2 8 0 0 5 0 1 30 0 2 25 0 1 1 5 3 4 4 0 17 1 2 20 0 2 74 0 0 0 0 0 4 10 0 0 0 1 10 0 0 0 17 0 0 0 5 2 0 1 0 5 3 30 0 0 20 10 1 1 1 15 7 5 3 16
We recorded a total of 138 plant species, but the great majority of them were only present in low abundance and frequency species. The 25 species considered for multi-variate analysis are listed in Table 3.
The site typology obtained by UPGMA (Fig. 2) was very similar to that obtained using a k-means non-hierar-chical partition method (SAWCHIK, 1999) so we concluded
that the hierarchical pattern of the groups was robust (DUFRÊNE & LEGENDRE, 1997). First, the whole set of
sites was split in two main groups separating lowland meadow sites from high altitude, acid and poor (oligo-trophic) sites. At this step, IndVal identified only B. ino (IV = 89.7), A. levana (IV = 69.0) and A. crataegi (IV = 65.5) as having significant IndVal values for the group constituted by all the lowland meadow sites. The oligo-trophic sites, represented by peat-bogs (rich in Carex sp. and Sphagnum sp.) and wet rush (Juncus sp.) meadows,
were characterized by C. selene (IV = 90.2) and L.
hippot-hoe (IV = 76.8). The next level subdivided lowland
mead-ows in one cluster of eutrophic sites and another cluster of mesotrophic meadows dominated by the association
Des-champsio cespitosae-Polygonetum bistortae. The wet
meadowsweet (Filipendula ulmaria) grasslands are dis-tributed between these two clusters. Two butterfly species showed statistically significant IndVal values : L. helle (IV = 85.8) and P. eunomia (IV = 82.5). Only B. ino showed a significant, although not maximal, indicator value (IV = 71.0) for the cluster of eutrophic sites. Finally, the classification divides the cluster of bistort meadows in one group characterized by L. helle (53.4) and another group characterized by P. eunomia (48.4). These IV values were significant but not maximal, so the division at this level is less defined. This suggests subtle differences in the gradient of humid bistort grasslands from rush meadows to meadowsweet grasslands. After this division level the sum of IndVal values decreased, suggesting that the next divisions of the typology are not informative.
The total variance explained by the first two CA axes was 64% (40.4% and 23.6% respectively). The two-dimension diagram obtained from CA ordination (Fig. 3) revealed the same species assemblage structure suggested by the clustering results. The species that mainly contrib-ute to the species assemblage originality were B. ino, C.
selene, Inachis io, L. helle, L. hippothoe, and P. eunomia.
The first axis opposes C. selene to B. ino. Clossiana
selene was present in high altitude, oligotrophic sites
while B. ino was associated with lowland meadows. The second axis showed a rather slight arch effect, suggesting the prevalence of the main gradient. However, it is unlikely that this axis was simply an artifact and probably reflects a secondary gradient. This was confirmed by detrended correspondence analysis and principal coordi-nate analysis two-dimension ordinations (not shown),
TABLE 3
Number of occupied sites and plant codes (used as labels in the figures).
Code Species No. Sites
ACN Agrostis canina 21
ACP Agrostis capillaris 4
ANG Angelica sylvestris 27
CNI Carex nigra 10
CRO Carex rostrata 5
CIR Cirsium palustre 32
DES Deschampsia caespitosa 21
FES Festuca rubra 14
FIL Filipendula ulmaria 24
GPA Galium palustris 24
GTE Galeopsis tetrahit 17
HLA Holcus lanatus 25
HMO Holcus mollis 6
JAC Juncus acutiflorus 25
JEF Juncus effusus 20
LOT Lotus pedunculatus 25
LYS Lysimachia vulgaris 13
POL Polygonum bistorta 29
POA Poa trivialis 18
RAN Ranunculus repens 17
RUM Rumex acetosa 24
SCI Scirpus sylvaticus 14
URT Urtica dioica 14
VAL Valeriana repens 17
VIO Viola palustris 18
Fig. 2. – UPGMA clustering results and the indicator species proposed by the IndVal approach (IV). ***. Maximal and sig-nificant (at the 0.05 level), IV > 70%. **. Maximal and signifi-cant (at the 0.05 level), IV < 70%. *. Signifisignifi-cant (at the 0.05 level) but not maximal IV.
Fig. 3. – Ordination plot (2 first axes) of the Correspondence Analysis (CA) of the butterfly species matrix. The symbols cor-respond to the groups identified by the UPGMA algorithm.
which produced essentially the same spatial arrangement of the data revealed by CA.
The second axis opposes bistort meadows character-ized by L. helle and P. eunomia to meadowsweet grass-lands sites strongly associated with B. ino. The eutrophic sites dominated by F. ulmaria and Urtica dioica are located at one extreme of this axis, while the other meadow sites are characterized by the association of
Des-champsia cespitosa and Polygonum bistorta. However,
the slight arch effect suggested by this axis could also be interpreted in another way. The species repelled to the extreme of the parabola (L. helle, P. eunomia) would be typical of the middle of the gradient, whereas the species in the center of the parabola would be more widespread, generalist or ubiquitous species (LEBRETON & YOCCOZ,
1987; DUFRÊNE & LEGENDRE, 1997). No significant
cor-relations were observed between species’ frequencies among sites and species’ CA scores. Therefore, we con-cluded that ordination results did not result from a sam-pling artifact (KREMEN, 1992). The first eigenvalues were
different in magnitude so we concluded that the ordina-tion was stable (OKSANEN & MINCHIN, 1997). The first
CA axis showed a statistically significant correlation with altitude (rS = 0.668). The second axis showed a
signifi-cantly positive correlation with butterfly diversity (rS = 0.589). In spite of the fact that species richness, H’ and E may be affected by sampling effort variations, in our case, however, the differences do not seem strong enough to have a great impact on these measures. This assertion is supported by the very low correlations showed between the diversity measures, the total number of individuals, and the area of the sites (Table 4).
TABLE 4
Rank correlation computed as Spearman coefficients between the site scores on the two first axis of the correspondence analy-sis, the patch area and the total number of individuals (N), and butterfly diversity (S = species richness; H’ = Shannon index; E = evenness; D = Simpson index). *. Correlation is significant at the 0.05 level. **. Correlation is significant at the 0.01 level.
Axis 1 Axis 2 Area N
S -0,117 +0.427 ** -0,103 +0,136 H’ +0,129 +0.589 ** -0,002 -0,053 E +0,382 +0.524 ** +0,087 -0,160 D -0,134 -0.619 ** -0,016 -0,092 TABLE 5
Summary of the co-inertia analyses : inertia and co-inertia values for the butterfly and environ-mental (CO1 : vegetation; CO2 : edaphic) matrices, and correlation values between the butterfly and environmental ordination axes.
Analysis Axis Correlation Inertia butterflies Inertia environmental Co-inertia butterlies Co-inertia environmental CO1 1 0,809 0,396 0,503 0,384 0,416 2 0,818 0,215 0,413 0,204 0,305 CO2 1 0,631 0,396 3,551 0,355 1,944 2 0,496 0,215 2,091 0,193 2,879
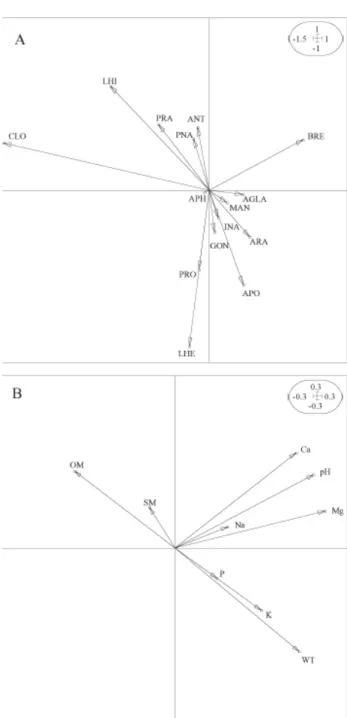
Fig. 4. – Results of the co-inertia analysis performed on the 15 butterfly species and the 25 plant species. (a) Position of butterfly spe-cies on the F1 x F2 co-inertia plane. (b) Position of plant spespe-cies on the F1 x F2 co-inertia plane.
The main two axes of COA explain 55.81% and 22.14% of the common structure shared by the butterfly and the plant matrices. The co-inertia test was highly sig-nificant (p < 0.001). The inertia values for the two first axes of the CA, both for butterfly and plant species, are shown in Table 5. The correlation values between the but-terfly and the plant ordination axes as well as the co-iner-tia values indicate that the structure described separately for butterfly and plant species data are relatively well cap-tured by the first co-inertia plane. The ordination diagram (Fig. 4) shows almost the same pattern than the CA dia-gram, indicating that the structure of co-variation between butterfly and plant species succeeds in explaining the
main pattern of the distribution of the butterfly assem-blages. At one extreme of the first axis we found C.
selene associated with V. palustris, A. sylvestris and J. acutiflorus. Lycaena hippothoe was also located on this
side of the diagram, mainly associated with A. canina, J.
effusus and A. capillaris. Brenthis ino and A. levana were
situated at the other end of this axis, associated to F.
ulmaria, U. dioica, V. repens and L. vulgaris. In the
mid-dle of the axis, L. helle and P. eunomia occupied sites dominated by D. cespitosa, F. rubra and P. bistorta. In this study, COA succeeds in removing a strong arch effect seen on the main plane of the CA performed on the vege-tation matrix (not shown).
The two main axes of the COA2 explain 58.56% and 29.12% of the common structure shared by the butterfly and the edaphic matrices. The inertia values for edaphic factors were 3.551 and 2.091 respectively. The co-inertia test was significant (p = 0.022). The correlation values between the butterfly and the soil ordination axes as well as the co-inertia values are shown in Table 5. In the ordi-nation diagram (Fig. 5), we visualize that C. selene and L.
hippothoe were associated with acid and wet sites with
accumulated OM and low levels of mineral bases. The butterfly species A. crataegi and A. levana were associ-ated with the sites with the highest levels of K and P which are also less humid and with deeper WT than the previous sites cited. The less acidic sites with the highest levels in Ca and Mg were associated to B. ino, while L.
helle and P. eunomia were preferentially situated in
rela-tively dry sites with low levels in bases and OM. The ordination of edaphic factors obtained from COA3 (not shown) showed a spatial configuration very similar to the ordination obtained from COA2.
DISCUSSION
Methodological considerations
Multivariate techniques are highly useful tools for identifying sets of indicator species for different habitats along a gradient. Classical and canonical ordination meth-ods allow the study of the relationships between species distributions and environmental gradients. Classification techniques are helpful for identifying discontinuities and to define the main habitat types. In particular, UPGMA combined with IndVal may provide a better alternative than TWINSPAN for classification and identification of indicator species (DUFRÊNE & LEGENDRE, 1997; LEE &
MCDONALD, 1993). In short, these methods reflect local
patterns of habitat heterogeneity indicating which assem-blage could be considered as an appropriate indicator of these habitat types (KREMEN, 1992).
COA is a useful and robust tool for displaying species-habitat relationships because it allows the simultaneous and symmetric study of two data sets. The symmetric approach allows the connections to be made between tables with different number of environmental variables, taxa and/or sites. As an ordination technique, it also has other potential benefits, for example the removal of the arch effect (DOLÉDEC & CHESSEL, 1994). This approach
may be also useful for defining and comparing biological assemblages indicative of different habitats or to evaluate the effects of disturbances on the habitats.
Fig. 5. – Results of the co-inertia analysis performed on the 15 butterfly species and the 9 edaphic variables. (a) Position of butterfly species on the F1 x F2 co-inertia plane. (b) Position of edaphic variables on the F1 x F2 co-inertia plane.
Vegetation gradients
Complex vegetation gradients partially reflect underly-ing edaphic gradients, i.e., nutrients, acidity and moisture gradients (OOSTERMEIJER & VAN SWAAY, 1998). The main
direction of variation in edaphic factors is probably along the base-richness and acidity gradient. At one extreme of the gradient are located the acid, base-poor sites, at the other those rich in bases and showing neutral pH. This gradient may be very important in structuring the floristic composition of the sites (WHEELER & PROCTOR, 2000;
ØKLAND et al., 2001), and hence in determining the
com-position of the butterfly fauna of these sites.
The analyses of edaphic factors show that two other gradients may be also of great relevance to the composi-tion of the vegetacomposi-tion and fauna. One of these ecoclines is the fertility gradient, determined by the availability of P and K. This gradient seems to be associated with the other gradient determined by the summer water table depth and negatively correlated with the organic matter accumula-tion, soil moisture and altitude. However, this assertion should be treated cautiously because the variable WT usually shows a high spatial and temporal variability (WHEELER & PROCTOR, 2000).
Nevertheless, there is not a complete correspondence between vegetation and edaphic gradients. For example, floristically close associations may be found in habitats with considerable differences in edaphic characteristics. Hence, apart from the soil characteristics there are other factors that determine the vegetation in a place (e.g. topography, land use, history).
The information from the plant assemblages seems to be a better predictor of butterfly composition than edaphic factors (SAWCHIK et al., 2003). Vegetation
inte-grates many ecological factors that may determine the distribution and abundance of butterfly species. Some plants represent essential resources for the survival and reproduction of butterflies. This is notably the case of the host plants, which represent the larval resources. Signifi-cant correlations have been detected between butterfly species and their respective host plants (SAWCHIK et al.,
2003). Other plants may provide nectar sources for the adults as well as the conditions necessary for sun-basking or mating places. On the other hand, the presence of some plants can also correlate with peculiar ecological situa-tions that are favourable to butterfly species, although this does not imply any causal relationship about their simul-taneous presence. In summary, the important associations that exist between butterflies and plant assemblages make the former valuable indicators of habitat types.
Butterfly assemblages and indicator species
The butterfly assemblages are structured among a gra-dient from lowland eutrophic grasslands to high altitude oligotrophic bogs. Three main butterfly assemblages were identified, which showed characteristic sets of indicator species. Five butterfly species were identified as charac-teristic of the different assemblages : B. ino, C. selene, L.
helle, L. hippothoe, and P. eunomia. As a result of the
var-iation in their optima, the relative abundances of these five species changed gradually along the main ecocline.
Therefore, the composition of the assemblages changes principally according to the dominance structure of these species. The other butterfly species are in general more widespread, generalist or ubiquitous.
One assemblage is characterized by the strong abun-dance of C. selene and, in lesser extent by L. hippothoe. This assemblage is typical of oligotrophic sites (bogs and wet rush meadows). A second assemblage, essentially consisting of bistort meadows is characterized by high numbers of L. helle and P. eunomia. These were both the most diverse assemblages and showed a lesser dominant structure in distribution of species abundances. The third group, typified by meadowsweet grasslands is dominated by B. ino. The vegetation of these sites is dominated by tall herbs like Angelica sylvestris, Cirsium palustris,
Lysi-machia vulgaris, and Valeriana repens. These categories
seem to be clearly structured along a vegetation gradient, showing various intermediate habitat types. In summary, one extreme of the gradient is represented by peat bogs, followed successively by oligotrophic rush meadows, bis-tort meadows, meadowsweet grasslands and highly eutrophic wet sites at the other extreme. The latter are represented by species-poor grasslands dominated by the common nettle (U. dioica) and with low biological value (i.e., low butterfly species richness and abundance). All along this gradient, the composition of butterfly assem-blages’ changes gradually from sites dominated by C.
selene to sites dominates by B. ino.
Ecological breadths of the species vary from the more eurytopic ones, typical of high-level structure (e.g., B.
ino), to stenotopic species characteristic of some
well-defined groups (e.g., C. selene, P. eunomia). The presence of B. ino seems to be assured by the presence of the mead-owsweet (F. ulmaria), its larva host-plant. This plant is well represented in different types of semi-natural mead-ows comprising eutrophic grasslands, bistort meadmead-ows, and wet peaty meadowsweet grasslands.
The ecological niches of the five indicator species are probably confined to wet grasslands and they are rarely observed elsewhere. On the other hand, field observations reveal that the butterflies identified as detector species (A.
levana and A. Crataegi) also occupy drier grasslands.
Detector species are defined by moderate levels of fidel-ity and specificfidel-ity. Changes in abundance of these species may provide information on the direction of ecological change (MCGEOCH et al., 2002). In particular A. levana,
which feeds principally on U. dioica, shows a higher tol-erance than the other mentioned species (OOSTERMEIJER
& VAN SWAAY, 1998). Although its indicator value is
lim-ited in this way, it may be an interesting detector species for identifying changes in the level of eutrophication of the habitats. However, detector species are also more prone to important inter-annual or spatial variations in their IndVal values (MCGEOCH et al., 2002). For this
rea-son, future research should consider the validation of the results with independent data sets.
Our results suggest that the set of five species identi-fied as indicators may constitute a useful tool for conser-vation purposes. Focusing the conserconser-vation efforts on the habitat requirements of these species, may be beneficial to protect a significant proportion of wet meadows. These five species are more or less specialized within distinct
sections of the main gradient and are indicators of partic-ular habitats. Therefore, if we preserve and manage ref-uge sites for these species we are likely to be providing protection for other organisms living in the same biotopes. Concentrating management practices on these five butterfly species will also result in cost-effective administration of time and funding resources.
The five indicator species show features that make them ideal candidates for focal species. They form rela-tively large colonies in spite of being more or less threat-ened species (GOFFART et al., 1992). They may be
assessed quickly with cheap and standard methods. More-over, some of these species show narrow tolerances so they may be particularly sensitive to environmental changes (OOSTERMEIJER & VAN SWAAY, 1998). By using a
multi-species approach we are covering a long gradient of environmental conditions. The five indicator species encompass al the range of the studied biotopes. All the sites showed the presence of at least one of these species. The simultaneous presence of many of these species may be an indicator habitat heterogeneity.
Indicator and umbrella species are not equivalent con-cepts, and may be interesting complementary tools for conservation practices (FLEISHMAN et al., 2000).
How-ever, some particular species may constitute indicator as well as umbrella species. For example, the 5 species iden-tified as indicators have some characteristics that suggest they may be candidates to conform a suite of umbrella species. They are easily recognizable, show an intermedi-ate degree of rarity, are moderintermedi-ately sensitive to human disturbance, and encompass a large range of habitats (FLEISHMAN et al., 2000; MAES, 2004). However, to be
considered as umbrella species, they must show a high pattern of co-occurrence with many other typical species and that was not tested in the present study. Proclossiana
eunomia and L. helle are probably the best candidates
because they were associated to the second correspond-ence axis, which was significantly correlated with species richness and diversity. One particular advantage, in the case of P. eunomia, is the considerable knowledge about its life-history and ecology (BAGUETTE & NÈVE, 1994;
BAGUETTE et al., 1998; NÈVE et al., 1996; PETIT et al.,
2001; SCHTICKZELLE et al., 2002).
To conclude, because of the many advantages described above, we propose that B. ino, C. selene, L.
helle, L. hippothoe and P. eunomia may be used as
indica-tors of habitat types, and as surrogate species for conser-vation efforts. These species are habitat specialist of small size so they represent interesting tools at small spatial scales as those involved in the present article. The use of species assemblages as indicators may be considerably improved by extending the approach to organisms that are taxonomically and functionally different (MAES, 2004).
Future research should be oriented to integrate over larger spatial scales by incorporating knowledge from other tax-onomic groups such as birds.
ACKNOWLEDGEMENTS
We thank J.L. Gathoye for the phytosociological works and Ch. Arsenault, Ch. Gilot and L. Wargé for the butterfly sam-pling. We thank C. Thomas, Ph. Goffart and A. Brazeiro for
use-ful comments on the first drafts of the manuscript. Financial support was provided by a Uruguayan subvention from DINA-CYT and by a contract of the “Ministère de la Région Wall-onne” to JS. MD beneficiates of a grant and a two years contract as senior research assistant from the National Fund of Scientific Research (Belgium). This is a contribution from the Biodiver-sity Research Center (UCL).
REFERENCES
BAGUETTE, M. & G. NÈVE (1994). Adult movements between
populations in the specialist butterfly Proclossiana eunomia (Lepidoptera, Nymphalidae). Ecol. Entomol., 19 : 1-5. BAGUETTE, M., I. CONVIÉ, C. VANSTEENWEGEN & G. NÈVE
(1998). Sex-biased density-dependent dispersal in a metap-opulation of the butterfly Proclossiana eunomia. Acta
Oecol., 19 : 17-24.
BECCALONI, G.W. & K.J. GASTON (1995). Predicting the species
richness of neotropical forest butterflies : Ithomiinae (Lepidoptera : Nymphalidae) as indicators. Biol. Conserv., 71 : 77-86.
BLAIR, R.B. (1999). Birds and butterflies along an urban
gradient : surrogate taxa for assessing biodiversity? Ecol.
Appl., 9 : 164-170.
CARO T.M. & G. O’DOHERTY (1999). On the use of surrogate
species in conservation biology. Conserv. Biol., 13 : 805-814.
CASGRAIN, P. & P. LEGENDRE (1999). The R package for multi-variate and spatial analysis (version 4.0) – User’s manual.
Département des Sciences Biologiques, Université de Mon-tréal, Montréal.
DOLÉDEC, S & D. CHESSEL (1994). Co-inertia analysis : an
alter-native method for studying species-environment relation-ships. Freshw. Biol., 31 : 277-294.
DOVER, J.W., T.H. SPARKS & J.N. GREATOREX-DAVIES (1997).
The importance of shelter for butterflies in open landscapes.
J. Insect Conserv., 1 : 89-97.
DUFRÊNE, M. & P. LEGENDRE (1997). Species assemblages and
indicator species : the need for a flexible asymmetrical approach. Ecol. Monogr., 67 : 345-366.
ERHARDT, A. (1985). Diurnal lepidoptera : sensitive indicators
of cultivated and abandoned grasslands. J. Appl. Ecol., 22 : 849-861.
EZCURRA, E. (1987). A comparison of reciprocal averaging and
non-centered principal component analysis. Vegetatio, 71 : 41-47.
FLEISHMAN, E., D.D. MURPHY & P.F. BRUSSARD (2000). A new
method for selection of umbrella species for conservation planning. Ecol. Appl., 10 : 569-579.
FLEISHMAN, E., G.T. AUSTIN, P.F. BRUSSARD & D.D. MURPHY
(1999). A comparison of butterfly communities in native and agricultural riparian habitats in the Great Basin, USA. Biol.
Conserv., 89 : 209-218.
GOFFART, P., M. BAGUETTE & B. DE BAST (1992). La situation
des Lépidoptères Rhopalocères en Wallonie ou Que sont nos papillons devenus? Bull. Soc. R. Belge. Entomol., 128 : 355-392.
GOFFART, P., M. BAGUETTE, M. DUFRÊNE, L. MOUSSON, G. NÈVE,
J. SAWCHIK, A. WEISERBS & P. LEBRUN (2000). Gestion des milieux semi-naturels et restauration de populations men-acées de papillons de jour. Direction Générale des
Res-sources Naturelles et de l’Environnement, Division de la Nature et des Forêts – Direction de la Nature, Jambes. HANSKI, I., A. MOILANEN, T. PAKKALA & M. KUUSSAARI (1995).
The quantitative incidence function model and persistence of an endangered butterfly metapopulation. Conserv. Biol., 10 : 578-590.
JONGMAN, R.H.G., C.J.F. TER BRAAK & O.F.R. VAN TONGEREN
(1995). Data analysis in community and landscape ecology. Cambridge University Press, Cambridge.
KENT, M. & P. COKER (1992). Vegetation description and analy-sis. Belhaven Press, London.
KREBS, C.J. (1989). Ecological methodology. Harper & Row,
New York.
KREMEN, C. (1992). Assessing the indicator properties of
spe-cies assemblages for natural areas monitoring. Ecol. Appl., 2 : 203-217.
LEBRETON, J.D. & N. YOCCOZ (1987). Multivariate analysis of
bird count data. Acta Oecol., 8 : 125-144.
LEE, B. & C. MCDONALD (1993). Comparing three classification
strategies for use in ecology. J. Veg. Sci., 4 : 341-348. LEGENDRE, P. & L. LEGENDRE (1998). Numerical Ecology.
Else-vier, Amsterdam.
MAES, D. (2004). The use of indicator species in nature man-agement and policy making. The case of invertebrates in Flanders (northern Belgium). PhD. Thesis, Universiteit
Gent, Gent.
MAES, D. & H. VAN DYCK (2001). Butterfly diversity loss in
Flanders (north Belgium) : Europe’s worst case scenario?
Biol. Conserv., 99 : 263-276.
MAGURRAN, A.E. (1988). Ecological diversity and its measure-ment. Princeton University Press, New Jersey.
MCGEOCH, M.A. (1998). The selection, testing and application
of terrestrial insects as indicators. Biol. Rev., 73 : 181-201. MCGEOCH, M.A. & S.L. CHOWN (1998). Scaling up the value of
bioindicators. Trends. Ecol. Evol., 13 : 46-47.
MCGEOCH, M.A., B.J. VAN RENSBURG & A. BOTES (2002). The
verification and application of bioindicators : a case study of dung beetles in a savannah ecosystem. J. Appl. Ecol., 39 : 661-672.
NÈVE, G., B. BARASCUD, R. HUGHES, J. AUBERT, H. DESCIMON, P.
LEBRUN & M. BAGUETTE (1996). Dispersal, colonization
power and metapopulation structure in the vulnerable butter-fly Proclossiana eunomia (Lepidoptera : Nymphalidae). J.
Appl. Ecol., 33 : 14-22.
NEW, T.R. (1997). Are Lepidoptera an effective ‘umbrella
group’ for biodiversity conservation? J. Insect Conserv., 1 : 5-12.
NOSS, R.F. (1990). Indicators for monitoring biodiversity : a
hierarchical approach. Conserv. Biol., 4 : 355-364.
ØKLAND, R.H., T. ØKLAND & K. RYDGREN (2001). A
Scandina-vian perspective on ecological gradients in north-west Euro-pean mires : reply to Wheeler and Proctor. J. Ecol., 89 : 481-486.
OKSANEN, J. & P.R. MINCHIN (1997). Instability of ordination
results under changes in input data order : explanations and remedies. J. Veg. Sci., 8 : 447-454.
OOSTERMEIJER, J.G.B. & C.A.M. VAN SWAAY (1998). The
rela-tionship between butterflies and environmental indicator values : a tool for conservation in a changing landscape.
Biol. Conserv., 86 : 271-280.
PETIT, S., A. MOILANEN, I. HANSKI & M. BAGUETTE (2001).
Metapopulation dynamics of the bog fritillary : movements between habitat patches. Oikos, 92 : 491-500.
POLLARD, E. (1977). A method of assessing changes in the
abun-dance of butterflies. Biol. Conserv., 12 : 115-134.
RICKETTS, T.H., G.D. DAILY & P.R. EHRLICH (2002). Does
but-terfly diversity predict moth diversity? Testing a popular indicator taxon at local scales. Biol. Conserv., 103 : 361-370. SAWCHIK, J. (1999). Répartition spatiale et dynamique des pop-ulations de Rhopalocères des prairies humides du Plateau des Tailles. PhD. Thesis, Université catholique de Louvain,
Louvain-la-Neuve.
SAWCHIK, J., M. DUFRÊNE & P. LEBRUN (2003). Estimation of
habitat quality based on plant community and effects of iso-lation in a network of butterfly habitat patches. Acta Oecol., 24 : 25-33.
SCHTICKZELLE, N., E. LE BOULENGÉ & M. BAGUETTE (2002).
Metapopulation dynamics of the bog fritillary : demographic processes in a patchy population. Oikos, 97 : 349-360. SIMBERLOFF, D. (1998). Flagships, umbrellas, and keystones : is
single-species management passé in the landscape era? Biol.
Conserv., 83 : 247-257.
SMALLIDGE, P.J., D.J. LEOPOLD & C.M. ALLEN (1996).
Commu-nity characteristics and vegetation management of karner blue butterfly (Lycaides melissa samuelis) habitats on right-of-way in east-central New York, USA. J. Appl. Ecol., 33 : 1405-1419.
SPITZER, K., J. JAROS, J. HAVELKA & J. LEPS (1997). Effect of
small-scale disturbance on butterfly communities of an indo-chinese montane rainforest. Biol. Conserv., 80 : 9-15. SWENGEL, S.R. & A.B. SWENGEL (1999). Correlations in
abun-dance of grassland songbirds and prairie butterflies. Biol.
Conserv., 90 : 1-11.
TER BRAAK, C.J.F. & I.C. PRENTICE (1988). A theory of gradient
analysis. Adv. Ecol. Res., 18 : 271-317.
TER BRAAK, C.J.F. & P. SMILAUER (1998). CANOCO reference manual and user’s guide to Canoco for Windows : software for canonical community ordination (version 4).
Microcom-puter Power, Ithaca, New York.
THIOULOUSE, J., D. CHESSEL, S. DOLÉDEC & J.M. OLIVIER
(1997). ADE-4 : a multivariate analysis and graphical dis-play software. Stat. Comput., 7 : 75-83.
THOMAS, J.A. (1983). A quick method for estimating butterfly
numbers during surveys. Biol. Conserv., 27 : 195-211. WHEELER, B.D. & M.C.F. PROCTOR (2000). Ecological
gradi-ents, subdivisions and terminology of north-west European mires. J. Ecol., 88 : 187-203.
Received: June 30, 2004 Accepted: January 20, 2005