| | | | -- --- -- --- | | | |
The
Periphery
in the
Knowledge Economy
The Spatial Dynamics of the Canadian Economy
and the Future of Non-Metropolitan Regions in
Quebec and the Atlantic Provinces
REGIONS IN THE KNOWLEDGE ECONOMY
REGIONS ET ECONOMIE DU SAVOIR
Mario
Polèse Richard
Shearmur
in collaboration with Pierre-Marcel Desjardins
Marc Johnson
The
Periphery
in the
Knowledge Economy
The Spatial Dynamics of the
Canadian Economy and the Future
of Non-Metropolitan Regions in
Quebec and the Atlantic Provinces
Institut national de la recherche scientifique/INRS-Urbanisation, Culture et Société
The Canadian Institute for Research on Regional Development
| | | | --- --- --- --- | | | |
All rights reserved © 2002 Printed in Canada
This publication has been realised with the financial contribution of Canada Economic Development for Quebec Regions (CED) and the Atlantic Canada Opportunities Agency (ACOA).
Contents
List of Tables ... viii
List of Figures... ix
List of Maps... xii
Preface ... xiii
Glossary ... xv
EXECUTIVE SUMMARY... xix
PART 1. PERIPHERAL REGIONS IN THE KNOWLEDGE ECONOMY: TRENDS AND CHALLENGES... 1
CHAPTER 1. Defining Peripheral Regions, Basic Trends, and Why We Should Be Concerned ... 1
1.1 The Spark: A Paper Mill Closes in the Gaspé ... 1
1.2 Defining our Universe: Why Speak of “Peripheral” Regions? ... 4
1.3 Why It Is Difficult to Compare Canada’s Peripheral Regions with Regions in Other Nations... 8
1.4 Basic Employment and Population Trends for Peripheral Regions 1971-1996... 9
1.5 Conclusions ... 19
CHAPTER 2. A Brief Journey into the Past: On the Origins of Urbanisation and the Geographic Concentration of Economic Activity ... 23
2.1 The Impact of Rising Productivity on the Composition of Demand and Employment ... 24
2.2 The Impact of Scale and Agglomeration Economies on Industrial Location... 25
2.3 The Impact of Improvements in Transportation and Communications on Market Size and Range... 28
2.4 The Development of Urban Hierarchies and Small and Medium-sized Cities... 29
2.5 The Trends in Canada and Scandinavia Are Very Similar ... 35
2.6 Lessons Learned: The Limited Impact of Public Policy on Fundamental Trends ... 36
CHAPTER 3. The Impact of the Knowledge-based Economy and New Information and Communications Technologies ... 39
3.1 The Spatial Impact of the Knowledge-based Economy... 40
The Location of University Graduates and Knowledge Workers ... 40
The Location of Knowledge-intensive Services ... 44
The Location of High Value Added Manufacturing ... 53
3.2 The Impact of New Information Technologies (IT) ... 54
| | | | --- --- Contents --- --- | | | | vi
2. The Net Centralizing Effects of IT Resulting from Increased
Competition ... 56
3. The Producers of IT Hardware and the Providers of IT Content Are in Large Cities ... 57
4. IT Does not Reduce the Need for Face-to-face Communication... 58
The Positive Effects of IT... 60
Conclusions... 61
CHAPTER 4. Employment De-concentration and the Diversification of Peripheral Economies ... 65
4.1 Location Trends for Medium Value Added Manufacturing ... 65
4.2 Location Trends for Low Value Added Manufacturing ... 68
4.3 The Slow Road to Industrial Diversification ... 70
4.4 Tourist Sheds and Long-distance Tourism ... 72
4.5 The Importance of Proximity... 75
Conclusions... 76
CHAPTER 5. The Coming Crisis: The Impact of New Resource Constraints and the Demographic Transition... 87
5.1 The Employment Effects of Constraints on Natural Resource Exploitation ... 88
Ocean Resource-based Industries ... 90
Forestry-based Activities ... 92
Mining and Smelting ... 94
Other Primary Sector-based Activities ... 96
5.2 The Population Impact of the Demographic Transition... 103
Population Decline... 103
Will Out-migration Continue? ... 104
A Few Words on the Regional Adjustment Model... 106
Conclusions... 107
PART 2. THE CHALLENGES FACING PERIPHERAL REGIONS IN QUEBEC AND ATLANTIC CANADA... 111
CHAPTER 6. Some Regions Are More Peripheral than Others: The Growing Importance of Geography ... 113
6.1 A Brief Overview of Recent Spatial Shifts in Employment ... 114
6.2 The Importance of Geography for Central Place Functions ... 120
6.3 The Importance of Being Located on a Major Transport Axis ... 123
6.4 The Return of Geography: NAFTA, Deregulation, and Globalization ... 125
Contents
vii
CHAPTER 7. Local Entrepreneurship and Location ... 131
7.1 Entrepreneurship and Innovation... 132
7.2 Examples of Entrepreneurship and Innovation in Peripheral Regions ... 132
7.3 Barriers to Entrepreneurship in Peripheral Areas ... 133
Distance from Markets ... 135
Workforce Limitations... 137
Other Barriers to Entrepreneurship... 139
7.4 The Syndrome of the Intrusive Rentier... 140
7.5 Qualified Workers and Peripheral Locations... 142
7.6 Conclusion ... 143
Entrepreneurship in the Eleven Regions... 143
Local Economic Development... 145
CHAPTER 8. Successful Regions: What Can We Learn?... 149
8.1 Tromsø, Norway... 149
8.2 Oulu, Finland ... 151
8.3 Inverness, Scotland ... 153
8.4 Moncton, New Brunswick ... 155
8.5 What Can We Learn from These Successful Regions? ... 157
The Importance of Geography and Agglomeration ... 158
The Marginal Effect of Policy ... 158
Path Dependency and History... 159
8.6 Conclusion ... 161
CHAPTER 9. It Matters What Province You’re in... 163
9.1 Province Matters: A General Perspective ... 164
Employment Growth ... 164
Proportion of Working Age Population with a Work Income ... 165
Work Income per Person with Work Income ... 166
Percentage of the Population with a University Degree ... 166
Conclusion of the General Perspective ... 166
9.2 Detailed Comparison of Gaspésie with Gloucester and Western Newfoundland, and of Lower St. Lawrence with Madawaska ... 167
Employment Growth ... 168
Proportion of Working Age Population with a Work Income ... 177
Work Income per Person with Work Income ... 178
Percentage of the Population with a University Degree ... 179
9.3 The Border Effect ... 180
| | | | --- --- Contents --- --- | | | | viii
CHAPTER 10. The Future of Peripheral Regions in Quebec and Atlantic
Canada ... 185
10.1 Peripheral Regions Will not Die: Towards a New Equilibrium ... 185
10.2 For Some Regions the Transition Will Be More Difficult than for Others: Identifying the Obstacles... 189
Four Obstacles to Regional Economic Development ... 190
Distance and Transport Costs ... 191
Urban Centres and Agglomeration Economies... 192
The Intrusive Rentier (and the Impact of Seasonal Employment) ... 197
The Province and Border Effect ... 199
10.3 Synthesis: Rethinking the Priorities of Regional and Local Economic Development... 201
Looking beyond Traditional Regional and Local Economic Development Initiatives... 202
Facilitating the Transition to the Knowledge-based Economy ... 204
REFERENCES... 211
APPENDIX 1. Employment and Population Statistics, Canada 1971-1996: Data Base and Geographic Classification... 215
APPENDIX 2. Definition of 142 Economic Sectors, 18 Sector Aggre-gation, and Canadian Employment in Each Sector, 1971 to 1996 ... 219
APPENDIX 3. The Research Team ... 225
APPENDIX 4. End Note: The 2001 Census ... 229
APPENDIX 5. Listing of Persons Consulted ... 231
Tables 1.1 Population, as a Percentage of Canadian Total, by City Size and by Central and Peripheral Region, 1971-1996... 6
1.2 Various Characteristics of the Eleven Study Regions, 1996... 7
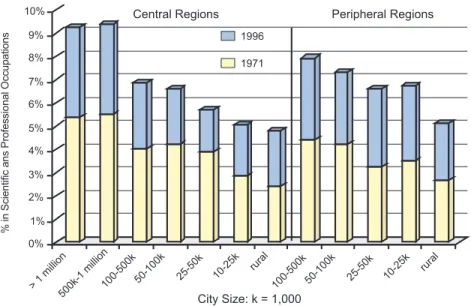
3.1 Percentage of Population (15 years and over) with a University Degree, and of Workforce in Scientific and Professional Occupations by Region and City-size Class, 1971 and 1996... 41
7.1 Examples of Innovative Activity in Eastern Peripheral Regions... 134
7.2 Earned Income by Person with Earned Income (Salary), 1971 to 1996 (Index: Cities over 1 Million = 1.00) ... 141
8.1 Population in Tromsø and Northern Norway, 1970-2000 ... 150
8.2 Total Employment in Oulu, the Oulu Labour Market and the Rest of Oulu’s Province, 1987-1999 (1987 = 100)... 152
8.3 The Population of Inverness and its Hinterland, 1991 and 1998 ... 154
8.4 Employment in Moncton and Immediately Surrounding Rural Areas, 1971-1996 (1971 = 100)... 156
ix
Figures
1.1 Large Metropolitan Areas, Central and Peripheral Locations:
Population, 1971-1996...11 1.2 Large Metropolitan Areas, Central and Peripheral Locations:
Total Employment, 1971-1996 ...12 1.3 Evolution of Income per Capita, 1971-1996: Peripheral
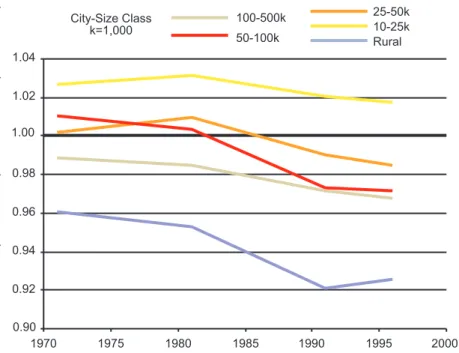
Locations by City-size Class (Canada = 1.00)...12 1.4 Evolution of Earned Income per Worker Compared to Total
Income per Capita, 1971-1996: Peripheral Locations by
City-size Class ...14 1.5 Population Growth since 1971 (in %): Selected Regions in
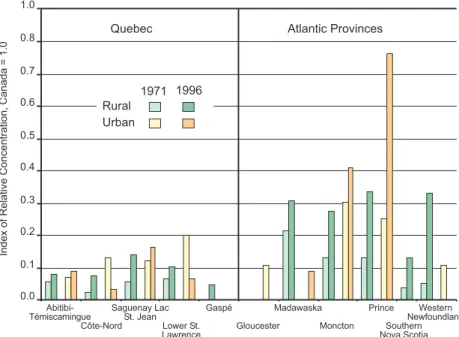
Quebec and Atlantic Canada...14 1.6 Income per Capita (Canada = 100): Selected Regions in
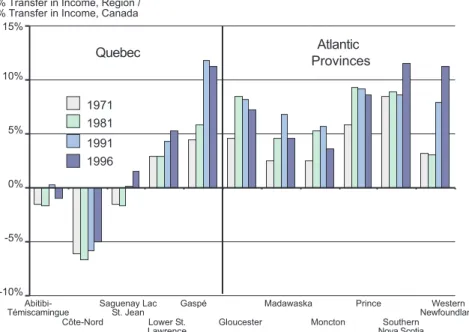
Quebec and Atlantic Canada, 1971-1996 ...15 1.7 Transfer Payments as a Share (%) of Total Income,
1971-1996: Selected Regions in Quebec and Atlantic Canada ...15 1.8 Net Dependence on Transfer Payments as a Percentage of
Total Income, 1971-1996: Selected Regions in Quebec and
Atlantic Canada ...16 1.9 Job Growth and Reductions in Transfer Dependency,
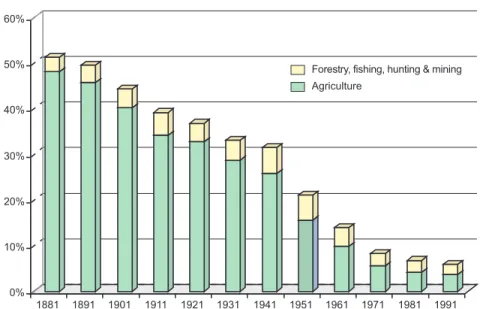
1981-1996: Selected Regions in Quebec and Atlantic Canada ...16 2.1 Urbanization: Canada, 1851-2001 ...31 2.2 Employment in the Primary Sector as a Percentage of Total
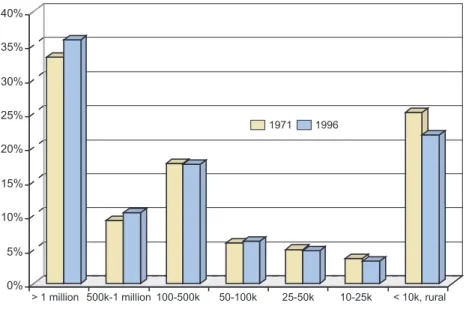
Employment: Canada, 1881-1991 ...31 2.3 Distribution (in %) of Population among City-size Classes:
Canada, 1971 and 1996...32 2.4 Employment in Manufacturing as a Percentage of Total
Employment: Canada’s 8 Largest Metropolitan Areas, 1971
and 1996 ...32 2.5 Population Change (%) by City Size and Location: Norway,
1980-1996...33 2.6 Population Change (%) by City Size and Location: Finland,
1988-1998...33 2.7 Income per Taxpayer by City Size and Location: Norway,
1985-1998 (National Average = 100)...34 2.8 Disposable Income per Capita in Southern, Central, and
Northern Finland compared to Helsinki (Helsinki = 100),
1970-1998...34 3.1 Employment Growth in Information-intensive Services:
Canada, 1987-2001 (1987 = 1.00) ...45 3.2 Population (15 Years and over) with a University Degree
| | | | --- --- Figures --- --- | | | | x
3.3 Workforce in Scientific and Professional Occupations (%) by
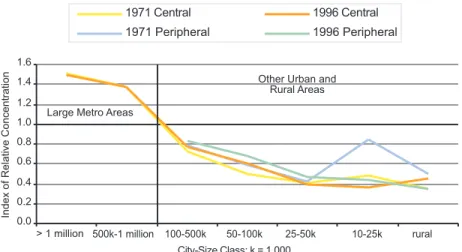
Region and City Size, 1971 and 1996...46 3.4 High-tech and Scientific Services: Relative Concentration of
Employment by Region and City-size Class, 1971 and 1996...47 3.5 Professional Services: Relative Concentration of
Employment, 1971 and 1996...47 3.6 Financial Services: Relative Concentration of Employment
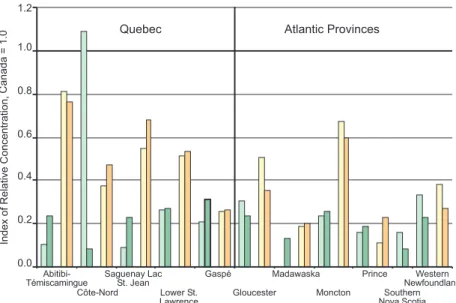
by Region and City-size Class, 1971 and 1996 ...47 3.7 High-tech and Scientific Services: Relative Concentration of
Employment: Selected Regions in Quebec and Atlantic
Canada, 1971 and 1996...48 3.8 Professional and Financial Services: Relative Concentration
of Employment: Selected Regions in Quebec and Atlantic
Canada, 1971 and 1996...48 3.9 High Value-added Manufacturing: Relative Concentration of
Employment by Region and City-size Class, 1971 and 1996...49 3.10 High Value-added Manufacturing: Relative Concentration of
Employment: Selected Regions in Quebec and Atlantic
Canada, 1971 and 1996...49 3.11 IT Content and Service Providers: Relative Concentration of
Employment by Region and City-size Class, 1971 and 1996...50 4.1 Medium Value-added Manufacturing: Relative
Concentration of Employment by Region and City Size,
1971 and 1996 ...81 4.2 Medium Value-added Manufacturing: Relative
Concentration of Employment: Selected Regions in Quebec
and Atlantic Canada, 1971 and 1996 ...81 4.3 Low Value-added Manufacturing: Relative Concentration of
Employment by Region and City Size, 1971 and 1996 ...82 4.4 Low Value-added Manufacturing: Relative Concentration of
Employment: Selected Regions in Quebec and Atlantic
Canada, 1971 and 1996...82 4.5 Proportion of Manufacturing Employment in Traditional
Resource-based Sectors: Selected Regions in Quebec and
Atlantic Canada, 1971 and 1996...83 4.6 Weight of the First Two Industries in Total Manufacturing
Employment: Selected Regions in Quebec and Atlantic
Canada, 1971 and 1996...83 4.7 Hotels, Restaurants, and Camping: Relative Concentration of
Employment by Region and City Size, 1971 and 1996 ...84 4.8 Hotels, Restaurants, and Camping. Relative Concentration of
Employment: Selected Regions in Quebec and Atlantic
Figures
xi
4.9 Growth in Total Employment, 1971-1996: Large
Metropolitan Areas, 1 Hour Radius, Rest of Canada...85 4.10 Population in Rural Communities: Peripheral and Central
Regions, 1971-1996...85 5.1 Employment Growth in the Primary Sector by Region and
City-size Class, 1971-1996...97 5.2 Employment: Canada, 1987-2000: All Industries and
Primary Sector (1987 = 1.0) ...97 5.3 Primary Employment in the Fishing Industry: Fishermen and
Helpers: Eastern Quebec, 1987, 1993, 1998...98 5.4 Secondary and Service Employment in the Fishing Industry:
Eastern Quebec, 1987, 1993, 1999 ...98 5.5 Population of Quebec and Atlantic Canada, 2001-2026.
Projections: Total and as a Share of Canada...99 5.6 Quebec’s Five Peripheral Regions. Projections: Total
Population and Percentage of Quebec, 1996-2041 ...99 5.7 Population Projections: Five Peripheral Regions of Quebec,
1971-2041 (1971 = 1.00) ...100 5.8 Net Migration. Southern Nova Scotia: Total and 0-24 Age
Group, 1991-1995 and 1994-1998...100 5.9 Net Migration Flows (5 Quebec Peripheral Regions) and
Canadian Unemployment Rate, 1987-1999...101 5.10 Unemployment Rates. Quebec and Atlantic Economic
Regions: 1987, 1993, 2000 ...102 5.11 Relative Unemployment Rates (Canada = 1.00): Quebec and
Atlantic Economic Regions, 1987-2000 ...102 6.1 Employment Growth Compared to Canadian Average,
1971-1981, 1981-1991, 1991-1996: Selected Regions in Quebec
and Atlantic Canada...115 6.2 Employment Growth, 1987-2000: Five Quebec Economic
Regions (1987 = 1.00) ...116 6.3 Employment Growth, 1987-2000: Six Atlantic Economic
Regions (1987 = 1.00) ...116 6.4 Employment Growth Compared to Canadian Average,
1987-2000 (Canada = 0): Quebec and Atlantic Economic Regions...117 6.5 Approximate Driving Time from Bangor, Maine (in
Minutes): Selected Cities in Quebec and Atlantic Canada ...117 7.1 Number of University Degree Holders by Type of Region,
Canada ...147 9.1 Average Percentage Difference in Total Employment
| | | | --- --- Figures --- --- | | | | xii
9.2 Average Percentage Difference in Proportion of Working Age
Population with Work Income, Base = Quebec, 1971-1996...169
9.3 Average Percentage Difference in Earned Income by Person with Earned Income, Base = Quebec, 1971-1996...170
9.4 Average Percentage Difference in Proportion of Working Age Population with Degree, Base = Quebec, 1971-1996...170
9.5 Gaspésie/Gloucester/Western Newfoundland and Lower St. Lawrence/Madawaska Comparisons, 1971-2000, Total Employment...171
9.6 Gaspésie/Gloucester/Western Newfoundland and Lower St. Lawrence/Madawaska Comparisons, 1971-2000, Manufacturing Employment, 1971 = 1...171
9.7 Gaspésie/Gloucester/Western Newfoundland and Lower St. Lawrence/Madawaska Comparisons, 1971-1996, Percentage of Manufacturing Employment in Non-traditional Sectors ...171
9.8 Location Quotients for High-tech Sectors, 1996 ...172
9.9 Participation Rate, 1996...172
9.10 Work Income by Worker, Urban and Rural, 1996...173
9.11 Percentage of Population 15 Years and over with Degree, 1996 ...174
10.1 Overall Employment Trend and Its Components: Higher Knowledge Content and Lower Knowledge Content Occupations ...193
10.2 Projected Job Creation Potential: Subjective Rating of Eleven Study Regions on Four Factors...194
10.3 Eleven Study Regions Ranked in Order of Percentage of University Graduates (Population 15 Years and over, 1996) ... 194
Maps 1.1 Regions Studied ... 11
1.2 Centre-periphery Divisions and Urban Centres, Canada ... 13
6.1 Percentage Growth of Total Employment, Eastern Canada, 1981-1996... 115
Preface
This volume is the synthesis of two years’ work, and represents the conclusions of discussions, conferences and reports between and by members of a core research team. The team was put together at the instigation of Economic Development Canada (EDC) which had the prescience to foresee the usefulness of an in-depth analysis of trends and policy options in eastern Canada’s peripheral regions well be-fore the 2001 census results brought these trends to the front pages of our daily papers. The Atlantic Canada Opportunities Agency (ACOA), made aware of this initiative, saw fit to extend the re-search, and the research team, to include Atlantic Canada.
The core research team, co-ordinated by Mario Polèse and Richard Shearmur, of the Institut National de la Recherche Scienti-fique (INRS) in Montreal, consists of four other researchers. Pierre-Marcel Desjardins (Université de Moncton) and Marc Johnson (Ca-nadian Research Institute on Regional Development) co-ordinated the research and participated in the elaboration of this final report from the perspective of Atlantic Canada. Serge Côté (Université du Québec à Rimouski) and Marc-Urbain Proulx (Université du Qué-bec à Chicoutimi) undertook research in the QuéQué-bec peripheral re-gions, authored the background reports on these rere-gions, and were instrumental in organising the authors’ visits there and in shaping their understanding of the complex phenomena observed.
Beyond this core team, a group of European specialists were in-vited to Montreal in October 2001. These specialists from Scotland (John Bryden and Andrew Copus), Norway (Arne Isaksen), Sweden (Lars Olof Persson) and Finland (Aki Kangasharju) were presented with the core team’s preliminary results and, for two days, discussed these and shed light upon them from a northern European perspec-tive. Their background papers, prepared for the October conference, can be found on the web site. We would like to thank these re-searchers for responding to the invitation and for presenting stimu-lating, apposite, and enlightening contributions to and comments on the work being undertaken by the Canadian team.
Contributions to the research effort did not stop at the core team and the five European researchers. Throughout the project, the
| | | | --- --- --- --- | | | | xiv
authors have benefited from conversations with development offi-cers, policy analysts, and, most importantly of all, local business people, community groups and concerned citizens, all of whom have shed invaluable light upon the complex issues hidden behind the sometimes stark trends which our research portrays.
We would like to emphasise that we do not expect to teach anything new to the people who most generously welcomed us to their peripheral communities and shared their anxieties, concerns and hopes with us. At most we hope to have given substance to the analyses and ideas which they expressed, and to have backed these up with some data and theory.
Last but not least, the invaluable support provided by Johanne Archambault and Julie Archambault regarding matters of transla-tion, presentation and printing cannot go unmentioned: without them the report would have remained an interesting (maybe) but unappealing (definitely) word-processor print-out.
All that being said, this final report has two principal authors and two collaborators. The authors accept full responsibility for the report’s contents, and it is they who have made the final decisions concerning the report’s contents.
We therefore wish to extend our thanks to the core research team, to our European colleagues, and to all the participants from the regions visited. We wish to thank EDC and ACOA for initiating this research project and for their full co-operation in its elaboration. In particular we wish to acknowledge the untiring support of Hervé Duff (EDC), Wade AuCoin (ACOA), and of all the development officers and analysts from EDC and ACOA—too many to name here—who provided logistical support and key insights into the economies of outlying regions.
We would, in addition, like to thank our families, friends and colleagues for their patience during this captivating, exciting, but sometimes all-consuming adventure.
Finally, we wish to emphasise that we alone are responsible for this report’s contents.
Mario Polèse and Richard Shearmur INRS-Urbanisation, Culture et Société Montréal, 2nd April 2002
Glossary
CED/DEC Canada Economic Development (for Quebec
Regions)/Développement économique Canada (pour les régions du Québec)
ACOA/APECA Atlantic Canada Opportunities Agency/Agence de
promotion économique du Canada atlantique
CMA/RMR Census Metropolitan Area/Région métropolitaine de
recensement
CA/AR Census Agglomeration/Agglomération de recensement
CFDC/SADC Community Futures Development Corporation/Société
d’aide au développement des collectivités
—/CLD No English abbreviation in use/Centre local de
développement
DREE/MEER Department of Regional Economic Expansion/
Ministère de l’Expansion économique régionale
RMC/MRC Regional Municipal County; in Quebec only/
Municipalité régionale de comté
IT/TI Information Technologies/Technologies de
l’information
Geographical Designations and Definitions
Découpages et autres appellations géographiques
Acadie Generic term: refers to those parts of Atlantic Canada
populated by French-speaking Acadians/Renvoie aux parties des régions de l’Atlantique où habitent les Acadiens (de langue française)
Acadian Peninsula/ The eastern tip of Gloucester County, New Péninsule acadienne Brunswick/Pointe est du comté de Gloucester,
| | | | --- --- Glossary --- --- | | | | xvi
Abitibi- Quebec administrative region and Statistics Canada
Témiscamingue Economic Region. French spelling maintained/Région
administrative du Québec et région économique de Statistique Canada
Lower St. Lawrence/ Quebec administrative region and Statistics Canada Bas-Saint-Laurent Economic Region/Région administrative du Québec et
région économique de Statistique Canada
Chicoutimi Refers to the Chicoutimi-Jonquière census
agglomera-tion/Agglomération de recensement de Chicoutimi-Jonquière
Quebec North Shore/ Quebec administrative region. Statistics Canada
Côte-Nord Economic Region includes Northern Quebec/Région
administrative du Québec. La région économique de Statistique Canada comprend le Nord du Québec The Gaspé/Gaspésie Quebec administrative region and Statistics Canada
Economic Region. Unless specified otherwise, includes the Gaspé Peninsula and the Magdalen Islands/Région administrative du Québec et région économique de Statistique Canada. À moins d’indication contraire, comprend les Îles-de-la-Madeleine
Moncton Region/ Refers to the Moncton census agglomeration. Kent, and
Moncton Westmorland Counties, New Brunswick. The
Statistics Canada Economic Region of Moncton-Richibucto also includes Albert County/ Aggloméra-tion de recensement de Moncton. Comtés de Kent et de Westmorland, Nouveau-Brunswick. La région écono-mique de Statistique Canada, Moncton-Richibucto, comprend aussi le comté d’Albert
Gloucester Gloucester County, New Brunswick. The Statistics
Canada Economic Region of Campbelton-Miramichi also includes Restigouche and Northumberland Counties/Comté de Gloucester, Nouveau-Brunswick. La région économique de Statistique Canada,
Campbelton-Miramichi, comprend aussi les comtés de Restigouche et de Northumberland.
Magdalen Islands/ Islands off the east coast of Quebec. Part of the Gaspé Îles-de-la-Madeleine administrative region/Îles au large du Québec,
Glossary
xvii
Madawaska Madawaska County, New Brunswick. The Statistics
Canada Economic Region of Edmundston-Woodstock also includes Victoria and Carleton Counties/Comté de Madawaska, Nouveau-Brunswick. La région économique de Statistique Canada, Edmunston-Woodstock, comprend aussi les comtés de Victoria et de Carleton
Prince Prince County, Prince Edward Island (P.E.I.). The
Statistics Canada Economic Region covers all of P.E.I./Comté de Prince, Île-du-Prince-Édouard (IPÉ). La région économique de Statistique Canada comprend toute l’île
Saguenay Lac St. Jean/ Quebec administrative region and Statistics Canada
Saguenay-Lac- Economic Region/Région administrative du Québec
Saint-Jean et région économique de Statistique Canada
Southern Nova Scotia/ Digby, Yarmouth, and Shelburne Counties. The Sud de la Nouvelle- Statistics Canada Economic Region of Southwestern
Écosse Nova Scotia also includes Queens and Lunenburg
Counties/Comtés de Digby, Yarmouth et Shelburne. La région économique de Statistique Canada, Southwestern Nova Scotia, comprend aussi les comtés de Queens et de Lunenburg
Western Equivalent to the Statistics Canada Economic Region
Newfoundland/ of West Coast-Northern Peninsula-Labrador, minus
Ouest de Terre- the latter/Équivalent de la région économique de
Neuve Statistique Canada appelée West Coast-Northern
Peninsula-Labrador, moins le Labrador.
Note: unless specified otherwise, all city and town names refer to urban areas or census agglomerations, and not necessarily to municipalities.
Note : à moins d’avis contraire, les noms de villes désignent les régions urbaines et les agglomérations de recensement; ils ne renvoient pas nécessairement aux municipalités.
Executive Summary
Canada’s population is spread out over vast spaces. Geography is everywhere, creating unique challenges for regional economic development. Like all industrialised nations, Canada is affected by current mega-trends: the rise of the knowledge-based economy, aging populations; globalization; and the introduction of new information technologies (IT for short). The arrival of IT has raised hopes that the tyranny of distance will be reduced in the future, opening up new perspectives for regions that have hitherto been handicapped by their peripheral location. How realistic are these hopes? What is the likely impact of current mega-trends and what are the implications for public policy? The study focuses on the prospects of peripheral regions. Other names could apply: non-metropolitan regions; remote regions; resource regions; etc. No entirely satisfactory term exists. The regions that are the focus of this study all share certain attributes: low population densities, the absence of a large urban metropolis, distance from major markets. Taking distance as our benchmark, approximately 28% of all Canadians lived beyond an hour’s drive of a major metropolis (with populations of over 500,000 in 1996). Although the study examines trends for Canada as a whole, the focus is on Quebec and Atlantic Canada. Eleven regions were selected for in-depth analysis.
The study is the result of a broad-based research effort, involving experts in Quebec, Atlantic Canada, and Nordic nations. Seventeen background studies were produced:
— A review of recent literature on regional economic development, with a focus on the knowledge-based economy and Nordic nations
— An in-depth statistical analysis of geographical trends in population and employment for Canada from 1971 to 1996.
— Five country studies, looking at similar trends and regional policy, for Finland, Sweden, Norway and Scotland. These nations were chosen be-cause their geography and development levels most resembled that of Eastern Canada.
— Specific studies for eleven regions of Quebec and Atlantic Canada. These studies entailed statistical analysis and fieldwork, the latter based in large part on consultations with local experts, entrepreneurs, and practitioners. About 200 persons participated in focus groups.
| | | | --- --- Executive Summary --- --- | | | | xx
A two-day workshop was held in Montreal in October 2001 with re-searchers and practitioners. Findings were brought together, discussed, and digested. The study seeks to summarize this mass of information and accu-mulated experience. However, the opinions expressed remain the sole respon-sibility of the authors.
Findings
1. Population and employment continue to concentrate in and around large
urban centres. Trends in Canada and in Nordic nations are similar and
show no signs of reversal. Peripheral regions continue, with minor excep-tions, to be regions of net out-migration. On the whole, this is the con-tinuation of long-term trends whose roots lie in the origins of industrialisation. There is no indication that new technologies will alter this pattern. The evidence suggests that new technologies will continue to fuel the concentration of employment in and around large urban centres. 2. The net effect of technological change has been to facilitate the geographic
concentration of employment. The impact of IT is analogous to that of
earlier inventions such as the telephone and the internal combustion en-gine. Reduced communications costs allow firms to broaden their markets and realize scale economies. A primary obstacle to higher productivity in Canadian peripheral regions is the difficulty in attaining necessary vol-ume. Improvements in communications increase competition between re-gions. They allow firms in large urban centres with an initial scale ad-vantage such as Montreal or Toronto to expand their markets. The con-centration effects are visible for sectors such as wholesaling, distribution, and food processing.
3. Distance is not dead. Information technologies (IT) have lowered the cost of transmitting information, improving the access to information of firms in peripheral regions. However, IT has had little effect on the cost of transporting goods. Merchandise must still be shipped from A to B. For firms in Western Newfoundland or the Saguenay, the additional cost (in money and time) of bringing goods to major markets remains a handicap. When selling to Boston or New York, one is better located in Southern Quebec, which in part explains why regions such as the Beauce and the Eastern Townships have out-performed others.
4. Distance is not dead bis. IT has not significantly reduced the costs of travel or the need for travel. Business people meet for numerous reasons:
Findings, Lessons Learned, Public Policy Implications
xxi
to negotiate; to establish and renew trust; etc. The need for face-to-face meetings is increasing. The knowledge-based economy depends on fre-quent information-rich interactions. IT does not reduce the need to meet, but rather (like the telephone before) creates new demand. The compara-tive advantage of large urban centres for information-rich activities re-mains strong. Firms in outlying regions will continue to bear the addi-tional costs of travel to and from large urban centres.
5. Geography and low population density compound the effects of distance. Transport modes (trucks, air, rail, water) are subject to scale economies. Firms in peripheral regions often face higher unit transport costs. Low density and awkward geography translate into lower volume, resulting in reduced service. IT is also subject to scale economies, resulting in higher access cost to wide-band communications. Without volume, infrastruc-tures cannot be maintained (at competitive prices). Rail lines have been dismantled. Transport services are increasingly determined by market forces as governments reduce subsidies to transporters, liberalize regula-tions, and withdraw from the management of ports and airports. Regions with low population densities, outside main transport routes, remain at a transport cost disadvantage.
6. Knowledge-intensive industries continue to locate in or near the large urban
centres. Location patterns for knowledge-intensive industries have
re-mained remarkably stable in Canada. High-tech services and high-tech manufacturing remain sensitive to city size. Their propensity to locate in (or near) the largest urban centres has changed very little. This is not to say that knowledge-intensive industries are absent from smaller cities or that they cannot succeed there. Numerous success stories exist. However, the relative position of smaller cities and peripheral communities, com-pared to that of large urban centres, is unlikely to change significantly. 7. Low and medium value-added manufacturing is de-concentrating, but within
limits. Low and medium value-added manufacturing industries
increas-ingly locate in small and medium sized cities. The cities that have chiefly benefited from this shift are those located within an hour’s drive of large urban centres Beyond the one-hour threshold, cities have been less suc-cessful in attracting manufacturing employment. This is especially true for medium value-added industries (transport equipment; electronics; etc.). The distance threshold shows little indication of weakening. Periph-eral cities have been more successful in attracting resource-based and low value-added industries: pulp and paper; food processing; refining and smelting of ferrous and non-ferrous metals; textiles and clothing.
| | | | --- --- Executive Summary --- --- | | | | xxii
ever, even for these sectors, relative levels of employment are generally higher in small and medium sized cities located near large urban centres. 8. Small rural communities (below 10,000) can grow, but location matters.
Rural peripheral communities face very different challenges from rural communities located close to large urban centres. Central rural areas, lo-cated within an hour’s drive of a large urban centre, grew by 16% be-tween 1981 and 1996, compared to 2% for peripheral rural areas. Small communities within an hour’s drive of a large urban centre have an ad-vantage for attracting manufacturing and also fall within urban tourist, fresh-produce, and long-distance commuting sheds. Within this radius, horticulture is more profitable, yearlong tourist activities are easier to de-velop, and urban (computer connected) professionals easier to attract. This is a very different reality from that faced by peripheral communities of similar size located on Quebec’s Lower North Shore or the Acadian or Gaspé Peninsulas.
9. Many peripheral communities will enter a phase of sustained population
decline; this is a break with the past. This is not simply the result of
indus-trial location trends. New developments are impacting peripheral commu-nities: growing constraints on (natural) resource exploitation and the ef-fects of the demographic transition. Most peripheral regions have histori-cally been areas of net migration. Until recently, the effects of out-migration on population were hidden because of the countervailing effects of births. This is no longer the case. Low birth rates mean that net out-mi-gration will now automatically trigger population decline. Miout-mi-gration has become a critical variable.
10. Out-migration of the young and the educated makes job creation more
diffi-cult. From the perspective of the individual, out-migration is a natural
re-action to unemployment. Individuals who move are generally better off. However, the cumulative effects on the community left behind can be dra-matic. In the knowledge-based economy, the effects of out-migration will be even more severely felt than in the past. Out-migration of the young and the educated puts the community at an increasing disadvantage com-pared to large urban centres. Time and time again, entrepreneurs told us that the primary obstacle to expansion (besides distance) was the diffi-culty of recruiting skilled workers. The perception of the link between employment growth and workforce quality and diversity is so strong that one entrepreneur reversed the usual (economic) reasoning, stating: “we do not have a big enough labour force to create jobs”. In the knowledge-based economy, this statement is not as unreasonable as it sounds.
Findings, Lessons Learned, Public Policy Implications
xxiii
11. Knowledge-based institutions are sensitive to volume. The density of knowledge workers is linked to the quality and quantity of knowledge in-frastructures: research centres, technical training facilities, laboratories; etc. To state that such institutions are a vital ingredient for local economic development has become a truism. In Canada, as in Nordic countries, pe-ripheral cities with universities (especially with a strong engineering or applied arm) have been more successful. However, the development of a strong university centre requires a population base. The city of Oulu in Northern Finland (the home of Nokia) services a hinterland with a popu-lation of about half a million. Tromsø in Northern Norway services a hinterland of similar size. This is not say that smaller regions cannot house universities or research centres, but rather that the link between population and knowledge institutions cannot be ignored.
12. Constraints on natural resources (coupled with higher productivity) mean
declining employment; this is a break with the past. Employment decline in
resource industries is the result of the meeting of two curves: 1. Declining manpower needs per unit extracted; 2. Constant or declining resources (or demand for resources). Until the early 1990’s, employment in most re-source sectors in Canada was either growing or stable, despite increases in productivity. Since, there has been a generalized downturn, most dramati-cally in the fishing industry. Sharp declines in employment have occurred in the past, especially in mining. The difference today is that the con-straints appear to affect all the traditional resource sectors: fishing and fish processing; mining and smelting; forestry and wood products; elec-tricity-intensive industries (i.e. aluminium). The precise nature of the con-straints varies from one sector to another. Even for renewable resources such as trees, fish, and hydroelectric power, we have by-and-large arrived at the limits of what is economically feasible. In some cases (notably, hy-droelectricity, fishing, and forestry), ecological considerations and na-tive/non-native relations also place new constraints on the use of the re-source. Ecological considerations and natural constraints are pushing in the same direction: a more parsimonious use of resources.
13. We can expect job losses in highly resource-dependent communities. Clo-sures are easiest to forecast for communities that depend on mining and smelting. Among the communities studied, Val-d’Or (Abitibi), Port-Cartier (North Shore Quebec), and Bathurst (New Brunswick) appear vulnerable. Closures (or downsizing) in the pulp and paper sector are more difficult to predict, but will undoubtedly occur, especially if the trend to recycling accelerates. Employment in aluminium smelting does not appear threatened, although the individual plants may downsize as la-bour productivity continues to increase.
| | | | --- --- Executive Summary --- --- | | | | xxiv
14. Entrepreneurs in peripheral communities are dynamic and innovative. We encountered men and women in all regions who sought to start busi-nesses. They were, without exception, highly motivated, well informed, and entirely conscious of the challenges of doing business in their chosen communities. The issue is not the lack of motivation, but the lack of prof-itable business opportunities, compared to those in large urban centres. Notwithstanding, businesses do succeed in small peripheral communities, proof of the dedication and ability of their founders. Successful firms can be found in almost every community, often in novel niches, everything from exotic berry jams (Newfoundland’s Northern Peninsula) to chitosan, a pharmaceutical by-product derived from shrimp residue (Gaspé Penin-sula). However, the jobs created by local success stories rarely compen-sate for job losses in other sectors.
15. “Peripheral” regions can succeed; but again, city size and location matter. Some peripheral communities have grown and will continue to do so. Among the ingredients for success are: location on a major transport axis; a diversified regional metropolis; a competitive wage structure and busi-ness environment. The greater Moncton area is a model case. With a population of over 100,000, Moncton is the service centre for a large mar-ket area, due in part to its central location in the Maritimes, a role further consolidated by the fixed link with P.E.I. Moncton is located: a) in a low-wage province; b) in a region that is not dominated by capital-intensive resource-based industries; c) on a major land transport axis. Added to these location advantages, Moncton has developed into a cultural centre for the French-speaking Acadian community, with a unique blend of in-stitutions and a bilingual labour force. This, plus a vibrant business com-munity (each reinforcing the other), has allowed the region to build a di-versified economic base, compensating for past job losses, as well as contributing to the revitalisation of surrounding rural counties.
16. Differences in performance among regions are often due to unique factors. The eleven peripheral regions studied showed significant differences. The Moncton region and Madawaska County (in New Brunswick) as well Prince County (P.E.1.) generally out-performed the others in job growth and industrial diversification. At the other end of the spectrum, the Gaspé region, Western Newfoundland, and Quebec’s North Shore were among the worst performers. As a group, Quebec’s peripheral regions did less well as those studied in the three Maritime Provinces. The comparative under-performance of the Lower St. Lawrence is unexpected, given its comparatively favourable location on the Halifax-Montreal transport axis and it proximity to Quebec City.
Findings, Lessons Learned, Public Policy Implications
xxv
Various factors contribute to the explanation of differences in regional performance:
a) Some peripheral communities are high wage-cost locations. This is specifically so for small and medium sized towns dominated by capital intensive-industries paying high wages, which set the norms for the com-munity: large pulp and paper mills; mines; aluminium smelters; etc. We have dubbed this the Intrusive Rentier Syndrome. Its impact can be dev-astating on local entrepreneurs seeking to diversify into other (wage sen-sitive) sectors, acting as a major impendent to the creation of a diversified export base. The majority of medium-sized towns on Quebec’s North Shore and in the Saguenay are in this situation, which explains in part why they have found it difficult to diversify and why they remain regions of net out-migration despite high wages. In northern fishing communities with short seasons, the highly seasonal character of local jobs (together with the rules governing employment insurance benefits) can constitute an indirect cost, via their effect on recruitment, for firms in non-traditional sectors.
b) Some communities are more “peripheral” than others. Communities lo-cated on major transports routes and with better access to U.S. markets have an advantage. NAFTA and deregulation have increased the impor-tance of geography. The further a community is from major U.S. markets, and the more obstacles (land or sea) have to be overcome, the greater its disadvantage. The communities of Western Newfoundland’s or Quebec’s North Shore are in a far less advantageous position than Madawaska and South-eastern New Brunswick. The regions of North-eastern Quebec are less well positioned to service U.S. markets than regions further south. Dead-end (transport) or peninsula locations exacerbate the disadvantage. c) Province size and provincial boundaries affect community performance.
The boundary between Quebec and its eastern neighbours makes a differ-ence. Communities on the Quebec side are often at a disadvantage for two reasons: 1) differences in regulations (e.g. decrees in the construction and textile industries; minimum wages) make New Brunswick locations more competitive. This has benefited Madawaska, and helps to explain why it has been more successful in diversifying its economy than the neighbour-ing Lower St. Lawrence; 2) it appears that communities in small prov-inces have a “political” advantage. Their voice carries, proportionately, more weight in the provincial capital. Provincial regulations are more likely to reflect local realities. Small provincial bureaucracies are gener-ally more accessible and responsive. This was advanced as one of the factors explaining Prince County’s (P.E.I.) success, demonstrating the
| | | | --- --- Executive Summary --- --- | | | | xxvi
importance of a flexible administrative environment, which allows the re-gion to maintain competitive business environment.
17. Income maintenance does not stop out-migration. The young leave because of lack of education and career opportunities. Relative income levels have generally improved in peripheral regions. The long-term trend in Canada is towards a lessening of regional income disparities, although the trend appears to have halted recently. Income levels have generally been main-tained in peripheral regions, due to the combined effects of progressive taxation and transfer payments. However, out-migration to large urban centres has continued. Ultimately, regional economic development comes back to job creation and location. Ensuring welfare levels is not sufficient, although it will contribute to the maintenance of local demand, and can thus slow down out-migration and population decline.
18. Economic theory is not always wrong: 1. lower costs translate into more
jobs; 2. labour mobility reduces unemployment. Prince County (P.E.I.) is
an example of the first: low relative wages, high employment ratios, and low migration. Rural Saskatchewan is a case of the second: high out-migration and low unemployment. Most peripheral regions face a trade-off between high wages (or high costs in general) and jobs. High cost re-gions will find it more difficult to create jobs. In the absence of jobs, out-migration (or unemployment) will persist. The comparatively high levels of unemployment in Quebec and Atlantic Canada can in part be explained by low labour mobility. However, lower labour mobility also has its roots in identity and language, which cannot be ignored, giving special urgency to the challenge of job creation in the peripheral communities of Quebec and Atlantic Canada.
19. Peripheral regions will not die. Population decline does not mean that the affected regions will cease to exist or cease to develop, although some isolated villages will face closure. Rising welfare levels and lower popu-lations are not incompatible. At some future point, population levels will settle at a new (lower) equilibrium, founded on a more knowledge-based employment base. We cannot predict what that equilibrium will be or when it will be reached. Public policy should help peripheral regions to successfully make the transition to the knowledge-based economy.
Findings, Lessons Learned, Public Policy Implications
xxvii
Lessons Learned/Public Policy Implications
1. The limited impact of public policy on mega-trends. Despite a tradition of public intervention, out-migration from peripheral regions remains a fact in Scandinavia and in Canada, fuelled by more fundamental factors. New information technologies will not change this. Both Canada and Scandi-navia have been largely successful in maintaining regional welfare levels. However, this does not appear to have significantly altered long-term job location trends. We should not expect public policy to reverse those trends.
2. The growth of large urban centres does not necessarily trickle down to peripheral regions. Peripheral regions are so precisely because they are far from large urban markets. Trickle down effects have limits. Invest-ments in large cities (Montreal, Toronto, etc.) should be justified on their own merits, and not as an indirect means of helping regions. The time has come to bury growth pole strategies and, in a Quebec context, to finally lay the 1970 HMR report to rest (R.I.P. HMR).
3. Population decline will mean a change in mindsets. For many communi-ties, population decline is inevitable. This should not be equated with economic decline. Smaller populations and higher welfare levels can go hand in hand. From a public policy perspective, it means rethinking local economic development, with increasing emphasis on flexible policy tools. It will also mean rethinking infrastructure maintenance and public service delivery.
4. Local economic development (LED) organisations (federally or provin-cially funded) play an invaluable role in promoting entrepreneurship, helping business start-ups, and fostering innovation. They should be maintained and continually improved. However, the challenges faced by many peripheral communities often require initiatives at other levels. Lo-cal development organisations should be explicitly allowed to go beyond business promotion.
5. Policies based on “one-size-fits all” criteria will work against the most peripherally located communities. The continued importance of city size and geography means that strategies need to be adapted to regional char-acteristics. The persistence of distance as an obstacle (which IT will not change) means that differences should be explicitly recognized. More leeway might be allowed to LED organisations in the application of pro-grammes, within the normal constraints of accountability. This might
| | | | --- --- Executive Summary --- --- | | | | xxviii
mean accepting higher levels of financial risk in the most peripheral re-gions.
6. There is a need to better reconcile business promotion and “objective” diagnosis. Some communities face specific challenges, which make them less competitive: the intrusive rentier syndrome; the border effect in East-ern Quebec; etc. Obstacles of this nature cannot be overcome if the com-munity does not first recognize them, and openly discuss them. If the function of LED organisations is only to promote the community, then it is unlikely that these difficult issues will be addressed.
7. The employment insurance (EI) system, which plays an important role in stabilizing peripheral economies, should be such that there always exists an incentive to work. Currently, in a context of seasonal employment, administrative rules governing the EI system can create a disincentive to work. This has the effect of reducing the workforce available to local en-trepreneurs and of slowing down or preventing the growth of SMEs and economic diversification. Further study is needed of this complex and important question.
8. Education and skilled labour recruitment are at the heart of any strategy that aims to facilitate the transition to the knowledge-based economy. Out-migration of the young and the educated will continue in most re-gions. It is unreasonable to expect public policy to reverse the trend. However, it is not unreasonable to imagine a mix of incentives to increase the attractiveness of peripheral communities, such as:
a) Tuition or debt relief for university graduates who settle in targeted regions.
b) Scholarships for graduate or post-graduate internships in targeted re-gions.
c) Tax relief for students in post-secondary institutions in targeted areas. d) Research chairs for institutions in targeted areas.
e) Increased focus on knowledge-transfer centres and applied learning, specifically via community colleges (CEGEPs in Quebec), including access to the incentives above.
Such incentives might equally be part of a more diversified tool-kit of LED organisations, whether provincially or federally funded.
9. Certain transportation and communications policies might be re-exam-ined in light of the realities of the knowledge-based economy. The grow-ing importance of face-to-face contacts makes travel an essential business
Findings, Lessons Learned, Public Policy Implications
xxix
cost. A new look at the regulations governing air travel in Canada might be in order. We are not convinced that current service in peripheral re-gions is a reflection of market forces. Regulations governing IT might equally be re-examined in a similar light.
10. The Federal and Provincial governments might examine the possibility of greater territorial flexibility in the application of policies affecting the relative competitiveness of communities. Provincial governments might allow local governments greater flexibility in certain areas. However, greater flexibility should not become a pretext for a “race to bottom” (i.e. subsidy wars ) between communities.
11. The Federal and Provincial governments might explore the possibility of establishing inter-provincial local development agencies in border areas, or at least, promoting greater inter-provincial harmonization in local eco-nomic development initiatives.
| | | | --- --- --- --- | | | |
Part 1
Peripheral Regions in the Knowledge Economy:
Trends and Challenges
CHAPTER 1
Defining Peripheral Regions, Basic Trends,
and Why We Should Be Concerned
The focus of this study is on the spatial dynamics of industries and jobs with the aim of evaluating the economic prospects of
periph-eral regions, in particular eleven regions in Quebec and Atlantic
Canada1. In future chapters, we shall consider the impact of new
in-formation technologies (IT), the knowledge-based economy, and other recent changes, and what this might mean for the economy of those regions. The purpose of this first chapter is to set the stage for the substantive chapters to follow. We begin by explaining the events that lead up to the study and the concerns that sparked it.
1.1 The Spark: A Paper Mill Closes in the Gaspé
At the end of 1999, the Gaspesia paper mill in the town of Chandler closed its doors, putting approximately 600 persons out of work, striking a severe blow to the economy of this small community on the southern shores of the Gaspé Peninsula. During the same year, the copper mine at Murdochville, located further east on the Gaspé Peninsula, announced its imminent closure, to be followed in time by its smelter. A decade earlier, the fishing communities of the Gaspé Peninsula and the Magdalen Islands were, like many other fishing communities, severely shaken by the collapse of the ground
Chapter 1
2
fish (notably, cod) and its ensuing moratorium, a shock from which most communities have yet to recover. Little wonder that people in the Gaspé feel that their region has somehow been singled out. Why should so many misfortunes befall their region? Why has the Gaspé found it so difficult to diversify its economy and to attract new busi-nesses? Why has its unemployment rate remained systematically above the national average?
The situation is not new. Some forty years ago, the Province of Quebec launched what was probably its most ambitious regional development initiative2, with the aim of bringing the historically
lagging regions of Eastern Quebec, including the Gaspé and Lower St. Lawrence, into the mainstream. The Gaspé is not unique. Most parts of Atlantic Canada have continued to lag behind the rest of the nation on various measures of economic performance (income per capita, employment, etc.). Regional development has remained a preoccupation of all levels of government in Canada. Both the Fed-eral government and the Provinces have, with ups and downs, for-mulated regional development policies over the past forty years. The Department of Regional Economic Expansion (DREE) has come and gone at the federal level, as has the OPDQ in Quebec3.
Canada and the Provinces have over time created an alphabet soup of programs and agencies to promote regional economic develop-ment and to support local business ventures. The aim of this study is not to evaluate those programs; others have undertaken that task4.
However, one can easily understand the sense of frustration of the residents of the Gaspé and other regions, whose relative fortunes do not seem to have greatly improved despite four decades of regional development policies5.
The closing of the Gaspesia mill was, in some respects, the pro-verbial straw that broke the camel’s back. It received important me-dia coverage in the Quebec press, as yet another example of the in-evitable decline (and perhaps political neglect) of Quebec’s outlying regions. It was also the event that sparked this study. Some weeks after the closing of the paper mill, the authors of this study were approached by Economic Development Canada6. The Atlantic
Can-ada Opportunities Agency (ACOA) would later join in the discus-sions. The time was ripe, it was felt, to take a step back and to take stock. A need was expressed for a research programme that would synthesize the current state of knowledge on the dynamics of re-gional economies. The initial question was this: How should we
| |
| |
--- ---
Defining Peripheral Regions, Basic Trends, and Why We Should Be Concerned
--- ---
| |
| |
3
interpret the events in the Gaspé? Were these unique events or should we expect further closures (or job declines), not only in the Gaspé but also in the other regions of Quebec and Atlantic Canada? Should we interpret the problems of the Gaspé and of other periph-eral regions as public policy failures or, rather, as the result of more fundamental forces? As our discussions progressed, it became clear that we could not rigorously answer these question without looking at the bigger picture and the trends elsewhere. What are the long-term trends, both in Canada and in other nations? Will industries continue to concentrate in and around large cities? Are the fun-damental factors that determine the location of industries and jobs changing? How is the rise of the new knowledge-based economy affecting the balance between peripheral and central locations? Will new information technologies (IT) improve the relative attractive-ness of peripheral regions? Is it not reasonable to hope that IT, by reducing the impact of distance, will allow “distant” regions to es-cape from the tyranny of geography? And in the end, how might the answers to such questions cause us to rethink regional development policies?
Thus was born a broad-based research programme, involving experts in Quebec, Atlantic Canada, and Nordic nations (see appen-dix 3 for short biographies of the research team). INRS-Urbanisa-tion, Culture et Société (Montreal), part of the Université du Québec system, was invited to coordinate the programme in collaboration with the Canadian Institute for Research on Regional Development (Moncton). The project formally began in November 2000, struc-tured around the following elements:
— A review of recent literature on regional economic development, with a focus on the knowledge economy and Nordic nations. — An in-depth statistical analysis of geographical trends in
popula-tion and employment for Canada from 1971 to 1996, using a classification system (see section 1.2 below and appendix 1) which identifies “central” and “peripheral” regions, as well as rural zones and cities in different size classes.
— Country studies, looking at similar trends and regional policy, for Finland, Sweden, Norway and Scotland. These nations were chosen because their geography and development levels most resembled that of Eastern Canada (see section 1.3 below).
— Separate studies for eleven regions of Quebec and Atlantic Can-ada (see map 1.1). These studies entailed statistical analysis and
Chapter 1
4
fieldwork, the latter based in large part on consultations with lo-cal experts, entrepreneurs, and practitioners. More than 200 per-sons participated in focus groups, regional workshops, and in-dustrial visits (see appendix 5 for a complete listing).
The documents coming out of the research programme can be found in the reference list. A two-day workshop was held in Mont-real in October 2001, bringing together some twenty researchers and practitioners, where the various findings were presented, discussed, and digested. This study seeks to synthesize this mass of informa-tion and accumulated experience.
1.2 Defining our Universe: Why Speak of “Peripheral” Regions?
One of the first questions we asked ourselves was: how should we define the regions that are the object of this study? We are dealing with regions that lack a large urban centre and are distant from ma-jor markets. Various names might apply: non-metropolitan regions; remote regions; resource regions; peripheral regions; and so on. None is entirely satisfactory. In Quebec, such regions have tradi-tionally been referred to as “resource regions”. We rejected that op-tion: first, because it implies that the fortunes of these regions are irremediably tied to natural resources; second, because this study goes beyond the borders of Quebec to include comparisons with Atlantic Canada and Nordic nations. The adjective peripheral was finally chosen to convey the notion both of distance and of relative positioning.
The question then becomes, peripheral compared to what? A re-gion is necessarily peripheral by comparison to other locations. In the Canadian context, peripheral regions might be defined in two ways: 1) In comparison to what has been traditionally called “Cen-tral Canada” (Ontario and Quebec) and still is by many residents outside those two provinces; 2) in comparison to major urban cen-tres and their surrounding regions. In this study, the second defini-tion is applied. We are targeting regions that are defined as being
located at some distance from large metropolitan areas. In that
re-spect, the term “non-metropolitan region” would equally apply. The term “non-metropolitan region” and “peripheral region” are thus interchangeable, although we shall generally use the latter. The next
| |
| |
--- ---
Defining Peripheral Regions, Basic Trends, and Why We Should Be Concerned
--- ---
| |
| |
5
step is finding an operational definition for “peripheral region”. What do we mean by a large metropolitan area, and what do we mean by some distance?
The operational definition of “peripheral region” used in this study was first applied by Coffey and Polèse in 1988, and has since shown itself to be very robust7. The nation is divided into “central”
and “peripheral” locations on the basis of two criteria, city size and distance (see table 1.1). Central locations include all major metro-politan areas (with populations of 500,000 or over in 1996) as well as other urban and rural areas that fall into approximately one hour’s driving time. All locations that are more than one hour’s drive from a major metropolis are thus classified as peripheral. It should be noted that the 500,000 cut-off point is an analytical device, and not a value judgement on the nature of Canadian urban areas. Thus, large CMA’s with populations under 500,000 will often fulfill met-ropolitan functions within their regional context; urban areas such as Saskatoon and Halifax immediately spring to mind. As we shall see, “peripheral” urban areas in the 100,000 to 500,000 class often be-have like larger metropolitan areas. However, in purely quantitative terms a clear break exists between the two classes8.
The one-hour threshold in principle represents the immediate market areas of large “central” metropolitan areas for professional and other business services. It measures the radius within which interaction with the metropolis remains fairly easy. Using this benchmark, approximately 28% of all Canadians lived beyond an hour’s drive of a major metropolis (with populations of 500,000 or more) in 1996, and are thus classified as living in peripheral areas (table 1.1). Our analysis of the spatial dynamics of the Canadian economy is based on the classification system in table 1.1. The da-tabase and data transformations are explained in appendix 1.
Within the universe of peripheral regions, eleven regions in Quebec and Atlantic Canada were singled out for special attention (see map 1.1). Since our original focus was on the five “resource regions” of Quebec, the initial intention was to choose regions in neighbouring New Brunswick that would provide a basis for com-parison. Thus, Madawaska County was chosen, which is a geo-graphic extension of the Lower St. Lawrence region in Quebec, and also overwhelmingly French speaking. By the same token, we chose Gloucester County in New Brunswick, which includes the Acadian
Chapter 1
6
Peninsula, which in terms both of its geography, industrial base, and settlement is close to the Gaspé. Again, both regions are very largely French speaking9. The greater Moncton urban area and its
two surrounding Counties of Kent and Westmorland were chosen as a point of comparison with the greater Chicoutimi urban area10 and
the surrounding Saguenay Lac St. Jean region. Chicoutimi and Moncton are the only two urban areas in our sample with popula-tions over 100,000. Both house regional universities. On the latter criteria, comparisons with Rimouski, and to a lesser extent with Rouyn-Noranda, are also valid.
As the research programme was extended to the rest of Atlantic Canada, the aim was to choose one clearly “peripheral” region in each of the remaining three provinces11, with, where possible,
char-acteristics comparable to those of the regions already chosen. Thus, Prince County was chosen in Prince Edward Island (P.E.I.), both because of its relative distance from Charlottetown, the provincial
Table 1.1. Population, as a Percentage of Canadian Total, by City Size and by Central and Peripheral Region, 1971-1996
1971 1981 1991 1996
Cities over 1 Million 33.3 32.9 35.0 35.8 Cities 500 K-1 M 9.3 10.4 10.6 10.5
All Metropolitan Areas 42.6 43.3 45.6 46.3
Central Cities, 100-500 K 9.9 9.8 10.0 10.0 Central Cities, 50-100 K 3.2 3.3 3.4 3.4 Central Cities, 25-50 K 1.8 1.7 1.6 1.6 Central Cities, 10-25 K 1.3 1.2 1.2 1.2 Central Rural Areas 9.4 9.3 9.0 9.1
All Central Areas 25.5 25.3 25.3 25.3
Peripheral Cities, 100-500 K 7.7 7.7 7.6 7.5 Peripheral Cities, 50-100 K 2.7 2.9 2.8 2.8 Peripheral Cities, 25-50 K 3.3 3.5 3.3 3.3 Peripheral Cities, 10-25 K 2.5 2.4 2.2 2.1 Peripheral Rural Areas 15.7 14.9 13.2 12.8
All Peripheral Areas 31.9 31.4 29.1 28.4
Note: Cities refer to Census Metropolitan Areas or Census Agglomerations as defined by Statistics Canada (see appendix 1 for details).
| |
| |
--- ---
Defining Peripheral Regions, Basic Trends, and Why We Should Be Concerned
--- ---
| |
| |
7
capital, and its proximity to New Brunswick. The three southern counties (Digby, Yarmouth, and Shelburne) of Nova Scotia were chosen because of similarities with the Acadian and Gaspé Penin-sulas in terms of settlement, geography, and industrial base, and because of their distance from Halifax. All three Atlantic regions are still very much oriented to the sea and to the fishing industry. Cape Breton (in Nova Scotia) was not chosen in part due to of its very particular history, which in some ways makes it special12. In
New-foundland, we chose the Western Shore, including the Northern Peninsula, partly because of its proximity to Quebec’s North Shore, both in terms of geography and settlement, but also because of its distance from St. John’s, the provincial capital. In sum, even within the peripheral universe of Atlantic Canada, these are truly “periph-eral” regions. However, as we shall see all throughout this study, some regions are more peripheral than others. Table 1.2 summarizes certain characteristics for our eleven study regions.
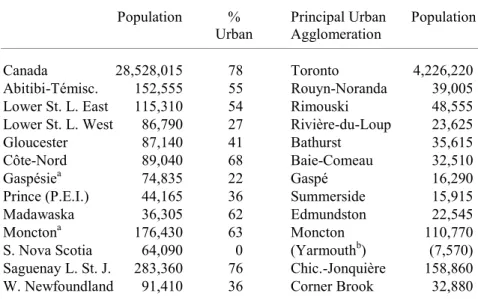
Table 1.2. Various Characteristics of the Eleven Study Regions, 1996
Population % Principal Urban Population
Urban Agglomeration
Canada 28,528,015 78 Toronto 4,226,220
Abitibi-Témisc. 152,555 55 Rouyn-Noranda 39,005
Lower St. L. East 115,310 54 Rimouski 48,555
Lower St. L. West 86,790 27 Rivière-du-Loup 23,625
Gloucester 87,140 41 Bathurst 35,615
Côte-Nord 89,040 68 Baie-Comeau 32,510
Gaspésiea 74,835 22 Gaspé 16,290
Prince (P.E.I.) 44,165 36 Summerside 15,915
Madawaska 36,305 62 Edmundston 22,545
Monctona 176,430 63 Moncton 110,770
S. Nova Scotia 64,090 0 (Yarmouthb) (7,570)
Saguenay L. St. J. 283,360 76 Chic.-Jonquière 158,860
W. Newfoundland 91,410 36 Corner Brook 32,880
a. Part of the Gaspésie (urban and rural areas around Campbelton) is not in-cluded since from our data it is not possible to assign Campbelton’s popula-tion to New Brunswick or Quebec. Moncton comprises Kent and Westmor-land Counties.
b. Yarmouth is not an urban agglomeration according to our definition (munici-pality or agglomeration which had over 10,000 inhabitants in 1991). It is in-cluded in this table for information only.