Phenotypic and biomarker evaluation of
zebrafish larvae as an alternative model to
predict mammalian hepatotoxicity
Sandra Verstraelen
a*, Bernard Peers
b, Walid Maho
c, Karen Hollanders
a,
Sylvie Remy
a,d, Pascale Berckmans
a, Adrian Covaci
cand Hilda Witters
aABSTRACT: Zebrafish phenotypic assays have shown promise to assess human hepatotoxicity, though scoring of liver morphol-ogy remains subjective and difficult to standardize. Liver toxicity in zebrafish larvae at 5 days was assessed using gene expression as the biomarker approach, complementary to phenotypic analysis and analytical data on compound uptake. This approach aimed to contribute to improved hepatotoxicity prediction, with the goal of identifying biomarker(s) as a step towards the devel-opment of transgenic models for prioritization. Morphological effects of hepatotoxic compounds (acetaminophen, amiodarone, coumarin, methapyrilene and myclobutanil) and saccharin as the negative control were assessed after exposure in zebrafish larvae. The hepatotoxic compounds induced the expected zebrafish liver degeneration or changes in size, whereas saccharin did not have any phenotypic adverse effect. Analytical methods based on liquid chromatography–mass spectrometry were optimized to measure stability of selected compounds in exposure medium and internal concentration in larvae. All compounds were stable, except amiodarone for which precipitation was observed. There was a wide variation between the levels of com-pound in the zebrafish larvae with a higher uptake of amiodarone, methapyrilene and myclobutanil. Detection of hepatocyte markers (CP, CYP3A65, GC and TF) was accomplished by in situ hybridization of larvae to coumarin and myclobutanil and confirmed by real-time reverse transcription–quantitative polymerase chain reaction. Experiments showed decreased expression of all markers. Next, other liver-specific biomarkers (i.e.FABP10a and NR1H4) and apoptosis (i.e. CASP-3 A and TP53) or cyto-chrome P450-related (CYP2K19) and oxidoreductase activity-related (ZGC163022) genes, were screened. Links between basic mechanisms of liver injury and results of biomarker responses are described. Copyright © 2016 John Wiley & Sons, Ltd.
Additional supporting information may be found in the online version of this article at the publisher’s web-site. Keywords: Non-animal alternative assay; hepatotoxicity; zebrafish larva; gene expression markers; compound uptake
Introduction
The liver is recognized as a critical target organ for xenobiotic chemicals and drugs. Owing to its functional position between the gastrointestinal tract and the systemic circulation, high con-centrations of xenobiotics may end up in the liver after intestinal absorption. Seven basic mechanisms for xenobiotic-induced liver injury are known, i.e.: (1) disruption of calcium homeostasis and cell membrane injury; (2) canalicular and cholestatic injury; (3) metabolic bioactivation by cytochrome P450 enzymes; (4) mito-chondrial injury, leading to interruption of lipid oxidation and steatosis; (5) stimulation of autoimmunity; (6) stimulation of apo-ptosis; and (7) (in)-direct activation of neutrophils and Kupffer cells. Many of these mechanisms can be triggered at the same time in an affected liver ( Jaeschke et al., 2002; Lee, 2003).
Hepatotoxicity evaluation is of high importance, but no single in vitro/in vivo assay or battery of screens currently being per-formed is able to predict reliably the biological effects of poten-tially toxic compounds (Hill et al., 2012; Mennecozzi et al., 2012; O’Brien et al., 2006; Xu et al., 2008). In vivo assessment of liver tox-icity frequently involves histopathology requiring a large number of rodents (Ekor et al., 2013). Rodent experiments are very labori-ous, costly and time-consuming, with often poorly consistent re-sults, while the EU-animal directive 2010/63/EU recommends the reduction of scientific experiments on animals. Several alternative in vitro methods to evaluate liver injury have been developed,
including rat liver slices (Boess et al., 2003; Elferink et al., 2008), rat or human primary hepatocytes (Boess et al., 2003; Kienhuis et al., 2009), and hepatic cell lines, e.g., HepG2 and HepaRG (Guillouzo et al., 2007; Lecluyse et al., 2012), each having their lim-itations related to simplification of a cellular system compared to the in vivo situation. Therefore, non-mammalian whole-organism approaches are currently explored for their suitability to screen for prediction of human toxicity and anticipate from the fore-mentioned limitations.
Zebrafish embryos/larvae are often considered as alternative systems, as these developmental stages are likely to experience less or no pain, suffering, distress or lasting harm; therefore,
*Correspondence to: Sandra Verstraelen, Flemish Institute for Technological Research (VITO NV), Applied Bio & molecular Systems (team ABS), Boeretang 200, 2400 Mol, Belgium.
E-mail: sandra.verstraelen@vito.be
aVITO NV, Applied Bio & Molecular Systems, Boeretang 200, B-2400 Mol, Belgium bGIGA-R, University of Liège, Avenue de l’Hopital 1, B34, B-4000 Liège, Belgium cToxicological Center, University of Antwerp, Universiteitsplein 1, B-2610 Wilrijk,
Belgium
d
Epidemiology and Social Medicine, University of Antwerp, Universiteitsplein 1, B-2610 Wilrijk, Belgium
Received: 21 April 2015, Revised: 15 December 2015, Accepted: 15 December 2015 Published online in Wiley Online Library
developing zebrafish larvae are regarded as protected animals only from 120 h postfertilization (hpf ) onwards (EU, 2012). Further-more, fish embryos provide the complexity and interaction of an intact organism, enabling the evaluation of compound-induced effects on multiple target organs. The transparent nature of the embryo/larva, ability to screen the whole organism in a microwell plate format with small amounts of compounds, potential to utilize medium to high-throughput screening platforms (Pardo-Martin et al., 2010), high degree of genetic conservation (Howe et al., 2013) and their similar morphological and molecular basis of tissue and organ development (e.g., growth factor and gene expression during liver budding, processing of lipids, vitamins, proteins and carbohydrates in the tri-lobed liver) shared with other vertebrates, including humans, makes zebrafish an excellent model organism for studying complex biological processes (Chu & Sadler, 2009; Howe et al., 2013; Vliegenthart et al., 2014).
Zebrafish larvae have been used as a convenient model for assessing hepatotoxicity (Driessen et al., 2013; He et al., 2013; Hill et al., 2012), as they complete primary liver morphogenesis by 48 hpf and the liver is fully formed and functioning by 72 hpf (Alderton et al., 2010; Isogai et al., 2001; Pack et al., 1996). In addi-tion, zebrafish homologs of mammalian lipid metabolizing enzymes are present in the zebrafish liver (Chng et al., 2012; Goldstone et al., 2010; Wiegand et al., 2000). A transcriptomic-based comparison of hepatotoxicity for three compounds (amio-darone [AMI], acetaminophen [ACE] and cyclosporine A) between the zebrafish embryo and traditional models (i.e. in vivo mouse and rat liver, in vitro mouse and rat hepatocytes, and primary human hepatocytes) showed concordance at the pathway level (metabo-lism) and confirmed its potential as a model to screen for the hepatotoxic potential of compounds (Driessen et al., 2015).
The objective of our research project was to explore zebrafish larvae as an alternative whole-organism approach to evaluate the potential of compounds to induce hepatotoxicity and compare with rodent studies and human health effects. Liver toxicity in zebrafish larvae was assessed using gene expression (in situ hy-bridization [ISH] and real-time reverse transcription–quantitative polymerase chain reaction [RT-qPCR]) as the biomarker approach, complementary to phenotypic analysis. A measure of compound uptake via bioanalysis (i.e. a liquid chromatography [LC]/mass spectrometry [MS] based approach) is rather unique and impor-tant to interpret appropriately the relevance of any observed toxicity outcome of the bioassay in relation to stability and bio-availability of the test compound, and allows explanation of the eventual false negative results. For that reason, analytical methods were optimized to analyze the stability, as well as the medium and internal concentration of selected hepatotoxic compounds. This multifaceted approach is of added value to existing studies with zebrafish larvae, which mainly study either gene expression (Driessen et al., 2014, 2015), bioactivation of test compounds and metabolite profiling (Chng et al., 2012), morphology and histopa-thology (He et al., 2013; Hill et al., 2012), or a combination of these approaches (Driessen et al., 2013; Mesens et al., 2015), but they all lack the extensive analytical study on the fate of the test compounds. In this study, morphometric evaluation of the zebrafish liver, complemented with gene expression studies and analytical results are presented for one non-hepatotoxic compound, saccharin (SAC) and five hepatotoxic compounds, i.e. ACE, AMI, coumarin (COU), methapyrilene (MET) and myclobutanil (MYC). The expected positive and negative compounds were selected from mammalian studies, representing different mechanisms (cfr. Table 1 and discus-sion) and were evaluated in the zebrafish model with the purpose
of assessing the predictive value of zebrafish in relation to the basic mechanisms for xenobiotic-induced liver injury. In summary, the novelty at the level of experimental approach is combining liver morphology, biomarker assessment (ISH and RT-qPCR) and fate of compound. The selection of appropriate biomarker(s) offers new per-spectives for the development of a transgenic model as a screening tool to prioritize unknown substances for hepatotoxicity.
Materials and methods
Zebrafish
Adult, wild-type zebrafish (Danio rerio) were obtained from a commercial dealer, and were kept in the laboratory as breeding fish for this study and reared under standard conditions (tem-perature range 25–27°C) at a 14: 10 light/dark cycle. The fish were acclimated to laboratory conditions, and kept in quaran-tine for at least 2 weeks before use in experiments. Next, healthy male and female fish were used to generate zebrafish embryos by group breeding in breeding tanks. Eggs were rinsed in 0.0002% methylene blue (CAS no. 122965–43-9; Sigma-Aldrich, Diegem, Belgium), diluted in fish water (reverse osmosis water supplemented with CaCl2.2H2O [0.294 g l–1], MgSO4.7H2O
[0.123 g l–1], KCl [0.006 g l–1], and NaHCO3 [0.065 g l–1];
pH 7.0–8.5; conductivity 600–700 μS cm–1; hardness 10–300 mg l–1 CaCO3; oxygen level> 80% [OECD TG 203, 1992]) and placed
into large Petri dishes filled with fish water. At 6 hpf, unfertilized eggs were removed and the embryos were transferred to six-well plates (five embryos per six-well per 4 ml fish water) and placed in an incubator at a 14: 10 light/dark cycle at 28.5 ± 0.5°C until 72 hpf. The procedures described in this study were approved by the local ethics committee.
Chemical treatment
A hepatotoxic compound database containing 89 compounds was created based on mammalian data from peer-review articles (e.g., PubMed) and other databases (e.g., TOXNET-HSDB). For the selec-tion of target hepatotoxic compounds, toxicological and analytical selection criteria were used, such as“different chemical classes, dif-ferent mode-of-action, difdif-ferent physico-chemical characteristics, availability of compound in pure form.” Five hepatotoxic com-pounds (i.e. ACE, AMI, COU, MET and MYC) and one non-hepatotoxic compound (SAC) were finally selected for assessing hepatotoxicity in larval zebrafish (see Table 1). All the compounds were purchased from Sigma-Aldrich. Stock solutions were prepared in either 100% dimethyl sulfoxide (DMSO, CAS no. 67–68-5; Lab-Scan, Gliwice, Poland) (AMI, COU, MET and MYC) or fish water (ACE and SAC) and dilutions were made in fish water with 0.1% DMSO or fish water. An optimal experimental set-up was derived from our own pre-liminary experiments. At 72 hpf, the six-well plates with larval zebrafish were checked for normal development and the minority of abnormal larvae (e.g., non-hatched, edema<10%) was replaced before the start exposure to test compounds. For all experiments, 2× six-well plates with five zebrafish larvae each were statically exposed to the negative control (fresh fish water), if a solvent was used, to the solvent control (0.1% DMSO in fish water), or to three sublethal concentrations of test compounds for a treatment period of 48 h (from 72 to 120 hpf ) in an incubator on a 14: 10 light/dark cycle at 28.5 ± 0.5°C. For real-time RT-qPCR, three techni-cal repeats, each with 2× six-well plates containing five larvae, were set up for the same conditions as described above. The
Table 1 . Info rm ation o n test compounds u sed fo r a ssessing zebrafis h h epatotoxicity Te st com p ound s Use P otential me chanism o f liver in jury CAS n o . P u ri ty T e st conce n trati o ns (μ M )L o g Kow (E pi Suite; KOWWIN v 1.6 8 ) Acetaminophen (ACE), pa ra cet a mol Analgesic a nd an tipyretic dr ug, saf e a t the rap e u ti c dos e s (Bl ie de n et al. , 2014 ) Me tab o lic b ioacti v ation b y cytochr o me P450 enzymes; mitoc h ondrial injury; stimulation o f a poptosis 103 –90-2 ≥ 99 % 2 000 –4000 –500 0 0 .27 Amioda rone hydrochlo ride (AMI) Lipophilic a nt ia rrhythm ic drug Mit o chondr ial inj ury (st ea tosis) 1977 4– 82 -4 ≥ 98 % 0 .2 –1 –57 .2 9 Coum arin (CO U ) N atur al flavor ing pr oduc t u sed as fr agra nc e ingr e d ient a nd as therapeu ti c a gent for the tr ea tment o f var ious ca ncer s Me tab o lic b ioacti v ation b y cytochr o me P450 enzymes; mitoc h ondrial injury 91 –64-5 ≥ 99 % 2 50 –50 0– 1000 1.51 Me thap yr ilene hydrochlo ride (MET) Antihistaminic compound D isru p tion o f calciu m homeosta sis and cel l m em brane injury ; mitoc h ondrial injury; metabolic bioactiv ation b y cytochrome P45 0 enzym e s; canalicular and cholesta tic inj ury; stimula tion of apoptosis 135 –23-9 100 % 2 .5 –5 –10 2.74 Myclobutanil (MYC) T riazo le fungi ci de Me tab o lic b ioacti v ation b y cytochr o me P450 enzymes 8867 1– 8 9 -0 100 % 1 2.5 –25 –50 3.50 Saccharin (SAC) A rtif icial sw e e te n er – 81 –07-2 ≥ 99 % 3 400 –6800 –13 70 0 0 .45
sublethal concentrations of the test compounds ranged from no or small effect on the liver to clear the toxic effect on the liver, while causing no larvae mortality, as these were derived in range-finding experiments using the optimal experimental set-up (Table 1).
Phenotypic evaluation of hepatotoxicity
After 48 h treatment, zebrafish larvae at 120 hpf were subject to visual observation of liver morphology under a stereomicro-scope (Olympus IX2-UCB, Berchem, Belgium) at magnification 100×. Larvae were first immobilized in 2% methylcellulose (CAS no. 9004–67-5; Sigma-Aldrich). When viewed dorsolaterally, the liver is situated posterior to the pericardium and predominantly anterior to the gut. The liver is globular in structure, has a clearly recognizable periphery against the neighboring tissues and is perfused with circulating blood cells. Normal zebrafish liver is clear, whereas after treatment with hepatotoxic compounds, it became darker with gray coloration and the texture of liver tissue became amorphous, indicating degeneration and/or necrosis. Two specific phenotypic end-points, respectively changes in liver size and liver degeneration, were visually assessed for hepatotoxicity. Other non-liver specific characteristics were noted, e.g., edema, non-inflated swim blad-der, protruding mouth (not shown). At least two to five indepen-dent biological experiments using different batches of zebrafish larvae and freshly made test solutions were performed. For each experiment and each test concentration, the number of fish showing effect for each of the two endpoints was scored, as well as those showing a normal liver, and expressed in Table 3 as the percentage effect. In this way, percentage values in Table 3 show for each condition the range of effects across experiments, being more informative than the calculation of a mean value for the percentage effect, masking the variability between experiments.
Biomarker evaluation of hepatotoxicity
Potential gene markers for liver injury were studied by whole-mount ISH and real-time RT-qPCR to complement the phenotypic hepatotoxicity assessment.
Biomarker selection. Six liver-specific biomarkers with a clear orthologous gene in zebrafish and four non-liver specific bio-markers were selected from mammalian and zebrafish studies (occurrence in liver mammals, evidence for changes due to hepa-totoxicity in general) and are shown in Table 2.
Whole-mount in situ hybridization. Whole-mount ISH for the markers CP, CYP3A65, GC and TF was performed following an adapted protocol (Mavropoulos et al., 2005). At 24 hpf, pigmenta-tion was blocked by adding 0.0003% phenylthiocarbamide (CAS no. 103–85-5; Sigma-Aldrich) to improve visual observation. ISH experiments were performed using fixed larvae at 120 hpf after 48 h exposure to COU (250 and 500μM), MYC (12.5 and 25μM) or the solvent control (0.1% DMSO in fish water). Details on the protocol can be found in Supplementary Information.
Real-time reverse transcription–quantitative polymerase chain reac-tion. Biomarkers (CP, CYP3A65, GC and TF) with a clear difference in expression in treated larvae compared to control larvae in the ISH experiments were quantitatively confirmed using real-time RT-qPCR. In addition, other liver-specific biomarkers (i.e. FABP10a and NR1H4), apoptosis as well as additional metabolism/oxidoreductase-related markers i.e. CASP3A, TP53, CYP2K19 and ZGC163022 were
selected to verify whether these genes were influenced by expo-sure to hepatotoxicants. After 48 h expoexpo-sure, the two wells with five larvae each for each condition were pooled in a single tube (n = 10 larvae), snap-frozen in liquid nitrogen and homogenized in TRIzol (TRI reagent; Ambion, ThermoFisher Scientific, Gent, Belgium) using the SilentCrusher S (Heidolph Instruments, Schwabach, Germany). Three technical repeats were performed for each exposure condition within the same experiment, and for each compound at least three independent biological experiments were set up. Details on the protocol and statistical analysis can be found in Supplementary Information.
Chemical analysis
For chemical analysis, two replicate wells of five zebrafish larvae were statically exposed to the negative control, eventually to the solvent control, and to three sublethal concentrations of test com-pounds (Table 1). The identification and quantitation of the selected compounds were executed using a LC (1200 series; Agilent Technologies, Diegem, Belgium), equipped with a binary pump and coupled to a triple quadrupole MS (Agilent Technolo-gies 6410) equipped with an electrospray ionization source. The LC parameters for each chemical are given in Supplementary Infor-mation Table S2. For SAC, an Agilent Zorbax SB-C18 column (2.1 × 50 mm, 3.5μm) was used, while all other compounds were analyzed using a Phenomenex Kinetex C18 column (2.1 × 100 mm, 2.6μm). The mobile phase was composed from eluent Ag (MilliQ water with 0.1% formic acid; Merck, Overijse, Belgium) and elu-ent B (methanol or acetonitrile, Merck with 0.1% formic acid). Supplementary Information Table S3 gives an overview of the MS parameters for each compound and its internal standard, the latter being chosen from the same chemical class as the analyte.
The stability of each chemical was determined during the expo-sure period of 48 h at 28.5 ± 0.5°C in a plastic well plate at 14: 10 light/dark cycle, storage at 4°C in a glass vial, and transport at room temperature in a glass vial. The highest exposure concentration was used to determine the stability at 28.5°C in a plastic well plate, except for MET which was twice as high (Supplementary Informa-tion Table S4, 21.3μM).
Test compound concentration measurement in medium. At the start of exposure (72 hpf; n = 1 technical repeat/condition) and at the end of exposure after 48 h treatment (120 hpf; n = 2 technical repeat/condition), the exposure medium was collected and the concentration of test compound was measured. The media of blank wells were also collected to demonstrate compound avail-ability in the absence of larvae (i.e. how much compound may have degraded or adsorbed to the plastic during the assay). The average of measured concentrations of two independent experi-ments and standard deviation were calculated. The medium samples were diluted in fish water and the calibration for each compound was made in fish water or in 0.1% DMSO in fish water. Supplementary Information Table S4 gives for each compound the limit of detection, limit of quantification, range of linearity range, accuracy at low and high reference level and precision at low and high reference level in fish water.
Determination of compound concentration in zebrafish larvae. Af-ter exposure (120 hpf ), two replicates of five larvae each (n = 2/ condition) were washed three times in 1% DMSO, if 0.1% DMSO as solvent was used for exposure, or fish water to eliminate compound adsorbing to the outside of the larvae and collected to measure actual systemic compound uptake. Compound
concentration in larvae was calculated according to Berghmans et al. (2008 where the volume of a larva was equated to 1.67μl. The concentration in larvae was calculated (μM) and relative
up-take of compound into larvae was presented as percentage of the start concentration in the medium measured at the beginning of the experiment, except for AMI where nominal concentration was used. The average compound concentration in larvae of two independent experiments was calculated with the corre-sponding standard deviation. For the analysis of exposed larvae, we have used matrix-matched calibration using non-exposed lar-vae to account for the matrix effect during the analysis. The cali-bration was first made in 100% methanol, the standards were then evaporated and reconstituted in 100μl of blank larvae in methanol/water (1: 1). A volume of methanol/water 1: 1 was added to the larvae samples, the larvae were ultrasonicated until they were dissolved (typically 10 min), then vortexed for 1 min. The entire sample was centrifuged for 1 min at 10 000 rpm and the supernatant was injected into the LC–MS/MS.
The quality control reference samples were prepared by spiking the analytes to exposed larvae. The solvent ratio in the
non-exposed larvae was methanol/water (1: 1). More details are given in Supplementary Information Table S4.
Results
Phenotypic evaluation of hepatotoxicity
Zebrafish treated with the negative (fish water) and solvent control solution (0.1% DMSO in fish water) exhibited clear liver tissue (Fig. 1a). After treatment with certain tested concentrations of a hepatotoxic compound, e.g., MET, zebrafish liver lost transparency and became dark (Fig. 1c,d) or changes in liver size were observed (Fig. 1d), while the lowest concentration of MET (2.5μM) did not
show phenotypic effects on the liver (Fig. 1b) compared to the control. The non-hepatotoxic compound SAC did not exhibit any of these phenotypic effects on larval zebrafish liver for all tested concentrations. The effect percentages of evaluated phenotypic endpoints after 48 h exposure of zebrafish larvae to hepatotoxic compounds and a non-hepatotoxic compound SAC, compared Table 2. Overview biomarkers. The relation of the liver markers to the basic mechanisms of xenobiotic-induced liver injury is men-tioned between brackets in the column“relevance in mammals:” (1) disruption of calcium homeostasis and cell membrane injury; (2) canalicular and cholestatic injury; (3) metabolic bioactivation by cytochrome P450 enzymes; (4) mitochondrial injury; (5) stimulation of autoimmunity; (6) stimulation of apoptosis; (7) (in)direct activation of neutrophils and Kupffer cells
Gene name Gene symbol Relevance in mammals Occurrence in zebrafish
Albumin-like GC Liver marker (1)
(Lee et al., 1987)
(Noel et al., 2010) Ceruloplasmin CP Liver marker (2, 7)
(Koruk et al., 2003)
(Noel et al., 2010) Cytochrome P450,
family 3, subfamily A, polypeptide 65
CYP3A65 Synteny with human CYP3A-se1, se2; 54% identical to human CYP3A4 (3)
Liver and gut marker (Tseng et al., 2005)
Liver fatty acid binding protein
FABP10a Liver marker (*), reflective of liver health and homeostasis (Chu and Sadler, 2009; Monbaliu et al., 2005) (Noel et al., 2010) Nuclear receptor subfamily 1 group H member 4 NR1H4 Liver marker (2,3,4) (Heni et al., 2013) Personal communication Hill A. (2010)
Transferrin TF Liver marker (*) (Amacher, 2002)
(Mudumana et al., 2004; Noel et al., 2010) Caspase 3a CASP3A Non-liver specific
apoptosis marker (Porter and Jänicke, 1999)
(Shi et al., 2011)
Cytochrome P450, family 2, subfamily K, polypeptide 19
CYP2K19 Shares synteny with human CYP2W1, a tumor-specific CYP that oxidizes indole and chlorzoxazone, but not fatty acids (Goldstone et al., 2010)
Cytochrome P450 metabolism-related
marker (Driessen et al., 2014)
Tumor suppressor protein p53 TP53 Non-liver specific apoptosis marker (Amaral et al., 2010) Lam et al., 2013 Ferric chelate reductase 1 ZGC163022 – Oxidoreductase metabolism (Driessen et al., 2013) *
to the corresponding negative/solvent control are shown in Table 3. For each of the experiments, percentage effect values are presented that point to rather a high variability at the highest concentrations, e.g., for liver degeneration, 1000μMCOU resulted
in a percentage effect range of 11–100% across five experiments.
Biomarker evaluation of hepatotoxicity
Whole-mount in situ hybridization. In Fig. 2, ISH results are shown for the marker TF as example. An overview of all ISH results is
presented in Supplementary Information Table S5. Exposure to both concentrations, COU affects all hepatocyte markers and a strongly decreased expression in the liver was observed compared to the solvent-treated larvae. MYC causes a slightly reduced ex-pression of hepatocyte markers for both concentrations compared to the solvent control. Only exposure to 12.5μMMYC showed no
change in expression for the marker GC compared to the solvent control.
Real-time reverse transcription–quantitative polymerase chain reac-tion. Results are shown in Fig. 3(a–c). Below, we describe the ex-posure conditions that induced a significant change in expression (P< 0.05) relative to solvent control by mixed-effect model analy-ses followed by Tukey’s post-hoc testing in R and exceeding the threshold of effect size (abs(log2(FC)) above log2(1.5)). The
expo-sure conditions not inducing significant changes and/or for which the threshold of effect size was not met, are not described in detail in the text but can be derived from the figures. Significance of pairwise comparisons between different treatments (concentration) is given by Supplementary Information Table S7 and enables infor-mation to be derived on concentration–response relationships. Hepatotoxicity-associated gene expression in 120 hpf zebrafish larvae exposed for 48 h (Fig. 3a). The ISH results (see“Whole-mount in situ hybridization”) were confirmed for COU. Exposure to COU re-duced the expression of CP, CYP3A65, GC, FABP10a and TF. Next, the hepatotoxicity-associated markers were also screened for ACE, AMI, MET and SAC. Strong effects on gene expression were in-duced by ACE and AMI. ACE inin-duced downregulation of TF, CP, FABP10a and GC. A similar response could be observed after expo-sure to AMI. The highest concentration of AMI also upregulated the expression of CYP3A65. MET and MYC were the least potent chemicals based on gene expression changes of the selected markers. Overall, SAC showed no change in expression, except for the highest concentration that induced little effect on CP and GC. The marker NR1H4 is expressed in zebrafish, but no change in expression above the threshold of effect was observed for this marker for any compound.
Statistical evidence of concentration–response relationships can be derived from Supplementary Information Table S7 in which pairwise differences between chemical concentrations were analyzed. The results support that there is indication for concentration–response (systematic increase or decrease) for the following liver-specific markers: CP after exposure to AMI; CYP3A65 after exposure to AMI and COU; FABP10a after expo-sure to ACE, AMI and COU; GC after expoexpo-sure to ACE, AMI and COU; TF after exposure to ACE and AMI.
Apoptosis and/or metabolism-related/oxidoreductase activity in ex-posed 120 hpf zebrafish larvae. Two apoptosis-related markers (CASP3A and TP53; Fig. 3b) and metabolism/oxidoreductase-related markers (CYP2K19 and ZGC163022; Fig. 3c) were tested to check if these genes are influenced by exposure to the test com-pounds. In larvae, exposed to ACE and AMI, transcription of CASP3A was stimulated for the two highest concentrations. The same was true for the marker TP53 after ACE exposure. The marker ZGC163022 was increased in expression by ACE (5000μM) and COU
exposure (all concentrations). On the other hand, for AMI, down-regulation of ZGC163022 was observed after exposure to 1μM.
CYP2K19 was increased in expression for 5μMAMI. On the contrary,
for ACE and COU (all concentrations), CYP2K19 was downregulated. Potential gene markers to predict human hepatotoxicity. The com-pounds ACE, AMI and COU show a decreased expression of most
Figure 1. Phenotypic identification of hepatotoxicity at 120 hpf treated for 48 h, the liver region is indicated by an arrow (magnification × 100). Control larva (a) and larva treated with 2.5μMmethapyrilene (b) exhibit a clear,
healthy liver. Larvae treated with higher concentrations of the hepatotoxicant methapyrilene exhibit tissue degeneration (c,d) and changes in liver size (d), with more toxic responses as was observed by pericard edema, protruding mouth and an uninflated swim bladder at the highest concentration (d).
hepatotoxic markers. On the other hand, MET and MYC show a minor response for differential gene expression of only a few markers indicating that these compounds are less potent in the zebrafish model compared to ACE, AMI and COU, despite pheno-typic effects at the highest test concentration.
Chemical analysis
Test compound concentration measurement in medium. An over-view of the compound concentration measurements in the medium as a function of the nominal concentration at the beginning and end of exposure, and in blank wells at the end is presented in Fig. 4(a–e). These results show a good agree-ment between the measured concentration of the test
compounds in the medium compared to the nominal concentra-tion and between the measured concentraconcentra-tions at the begin-ning of an experiment versus the concentration at the end for all compounds.
Determination of compound uptake by zebrafish larvae. The whole body concentration of compound uptake in zebrafish lar-vae as a function of the nominal concentration in the medium is shown in Fig. 5(a–f ). For exposure to ACE, AMI, MET and MYC an increase in compound uptake in the larvae is shown with in-creasing concentration in the exposure medium. For AMI, MET and MYC (highest nominal concentration), the uptake concentra-tion in the larvae was higher than the nominal concentraconcentra-tion, in-dicating a bioconcentration of test compound in the larvae. Larvae exposed to 250 and 500μMCOU showed the same low
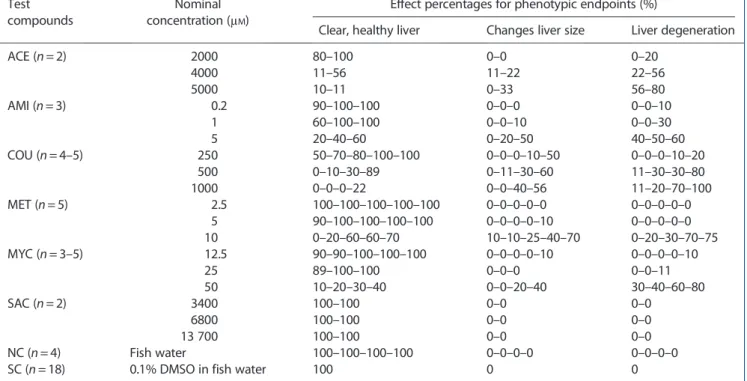
Table 3. Effect percentages of evaluated phenotypic endpoints after 48 h exposure of zebrafish larvae to hepatotoxic compounds and a non-hepatotoxic compound SAC, compared to corresponding NC/SC. Effect percentages were calculated only for the living lar-vae, and are given for each of separate experiments, except for condition SC with for all experiments (n = 18) 100% clear and healthy liver
Test compounds
Nominal concentration (μM)
Effect percentages for phenotypic endpoints (%)
Clear, healthy liver Changes liver size Liver degeneration
ACE (n = 2) 2000 80–100 0–0 0–20 4000 11–56 11–22 22–56 5000 10–11 0–33 56–80 AMI (n = 3) 0.2 90–100–100 0–0–0 0–0–10 1 60–100–100 0–0–10 0–0–30 5 20–40–60 0–20–50 40–50–60 COU (n = 4–5) 250 50–70–80–100–100 0–0–0–10–50 0–0–0–10–20 500 0–10–30–89 0–11–30–60 11–30–30–80 1000 0–0–0–22 0–0–40–56 11–20–70–100 MET (n = 5) 2.5 100–100–100–100–100 0–0–0–0–0 0–0–0–0–0 5 90–100–100–100–100 0–0–0–0–10 0–0–0–0–0 10 0–20–60–60–70 10–10–25–40–70 0–20–30–70–75 MYC (n = 3–5) 12.5 90–90–100–100–100 0–0–0–0–10 0–0–0–0–10 25 89–100–100 0–0–0 0–0–11 50 10–20–30–40 0–0–20–40 30–40–60–80 SAC (n = 2) 3400 100–100 0–0 0–0 6800 100–100 0–0 0–0 13 700 100–100 0–0 0–0 NC (n = 4) Fish water 100–100–100–100 0–0–0–0 0–0–0–0
SC (n = 18) 0.1% DMSO in fish water 100 0 0
a
ACE, acetaminophen; AMI, amiodarone; COU, coumarin; DMSO, dimethyl sulfoxide; FC, fold change; MET, methapyrilene; MYC, myclobutanil; n, number of independent biological experiments; NC, negative control; SAC, saccharin; SC, solvent control.
Figure 2. In situ hybridization images of 120 hpf zebrafish larvae after 48 h exposure to the SC (0.1% dimethyl sulfoxide in fish water), 250 and 500μM cou-marin (a), and 12.5 and 25μMmyclobutanil (b) for the marker transferrin. The liver region is indicated by an arrow. SC, solvent control.
Figure 3. (a–c) Real-time reverse transcription–quantitative polymerase chain reaction results of (a) liver-specific markers (CP, CYP3A65, FABP10a, GC, NR1H4, TF), (b) apoptosis-related markers (CASP3a and TP53) and (c) metabolism /oxidoreductase-related markers (CYP2K19 and ZGC163022) after 48 h exposure of zebrafish larvae to three sublethal concentrations of hepatotoxic compounds (shown on x-axis) ACE, AMI, COU, MET and MYC and the non-hepatotoxic com-pound SAC. The average log2 FC and 95% confidence interval (error bars) of three independent biological experiments are shown. The threshold FC of log2 (1.5) is shown by a dotted line. Treatments for which the effect crosses the threshold of effect and for which the effect is statistically significant compared to the solvent control group (P< 0.05 Tukey’s test) are presented by “*”. ACE, acetaminophen; AMI, amiodarone; COU, coumarin; FC, fold change; MET, methapyrilene; MYC, myclobutanil; SAC, saccharin.
level (~3μM) of compound uptake, which doubled when exposed
to the highest concentration (1000μM). Low whole body
concen-trations compared to medium were also seen for exposure to SAC, but actual concentrations reached 80–120 μM, which is of
same order of magnitude as for some hepatotoxic compounds (ACE, MYC, MET).
On the second y-axis of Fig. 5(a–f ), the relative compound up-take is shown, which is the percentage of the measured concentra-tion in the medium at start in funcconcentra-tion of the nominal concentration. Results on relative uptake can be expressed as high (> 100%), medium (5–100%) or low (< 5%) uptake relative to the test solution concentration as proposed by Gustafson et al. (2011). A low relative uptake compared to the nominal concentration was observed for the compounds COU and SAC. ACE exposure resulted in a medium uptake (from 5 to 12%) in zebrafish larvae. High rela-tive compound uptake (range 100–1000%, or up to 10-fold bioconcentration for MET) in zebrafish larvae was observed after exposure to AMI (nominal concentration: 1 and 5μM), MET and
MYC (nominal concentration 50μM).
Discussion
Phenotypic evaluation
In the current model, 72 hpf zebrafish was found to be an optimal developmental stage with a fully functional liver (Isogai et al., 2001) and 48 h exposure was sufficient to see the compound effects un-der the microscope (Hill et al., 2012). Visualizing zebrafish liver requires manual manipulation and proper orientation of the ani-mals in 2% methylcellulose. Here, phenotypic assessment of gross morphological changes was used to screen for liver toxicity and to define sublethal concentrations for gene expression experiments. Despite some variation between the independent experiments (cfr. Table 3), we found that all the assessed mammalian hepato-toxic compounds induced the expected liver degeneration or changes in liver size for certain tested concentrations, whereas the non-hepatotoxic compound SAC did not have any phenotypic adverse effect on zebrafish liver. This method to assess liver toxicity in zebrafish larvae, supplemented with observations on decreased yolk sac retention upon hepatotoxicity was also suc-cessfully applied by others (He et al., 2013; Hill et al., 2012), though scoring of liver morphology remains subjective and difficult to standardize unless automated imaging systems are developed (Pardo-Martin et al., 2010). Phenotypic evaluations in zebrafish larvae were extended with histopathological studies of the liver (Driessen et al., 2013, 2014) for nine hepatotoxicants, categorized according to their known phenotypes in humans: cholestasis, steatosis and necrosis. Distinct histopathological changes (lipid vacuoles, chromatin condensation, eosinophilic vacuolization) were observed in some zebrafish larvae depending on the treat-ment. Frequency and type of effects did not allow to distinguish nominal mammalian phenotypes and the incomplete maturation of liver in the zebrafish larvae (Driessen et al., 2013, 2014). Two of the nine compounds, ACE and AMI, were in common with our study with, respectively, a lower concentration range (up to 660μM) and
higher range (up to 10μM) compared to our range-finding
experi-ments (up to 5000μMfor ACE and 5μMfor AMI). The concentrations
were differently defined in both studies. In the studies of Driessen et al., the highest concentration had no observable general morpho-logical or teratomorpho-logical effects and no mortality. In our study, the highest concentrations were sublethal and specifically defined as those having a clear toxic effect on the liver.
Biomarker evaluation
Driessen et al. (2013 extended the fore-mentioned histopatholog-ical evaluation with gene expression analysis in whole zebrafish embryos (120 hpf ) compared to the liver of adult zebrafish for a set of reference hepatotoxic compounds, including ACE and AMI. Some hepatotoxicity-associated genes were only present in whole zebrafish embryo, e.g., FABP10a. Mesens et al. (2015 showed prom-ising predictivity for the hepatotoxic effects in zebrafish larvae by studying the expression of FABP10a as an appropriate endpoint. This marker was also studied in our experimental set-up. To study hepatic gene expression, it was decided to use whole zebrafish lar-vae RNA extracts as the most practical way in this study. Hepatotoxicity-associated gene expression responses remain de-tectable in the noise of other tissues and were not hampered by the developmental stage of the whole zebrafish larvae.
The most common drug causing drug-induced liver injury is ACE. When an accidental or deliberate overdose occurs, the reac-tive metabolite N-acetyl-p-benzoquinone imine is produced by CYP450 enzymes (Nelson, 1990). Excess of this reactive metabolite causes oxidative stress in humans and mice by depleting glutathi-one and results in mitochondrial damage and necrotic cell death (McGill et al., 2012). Compounds that damage mitochondrial struc-ture, enzymes or DNA synthesis can disruptβ-oxidation of lipids and oxidative energy production within the hepatocytes. Prolonged interruption ofβ-oxidation leads to micro/macrovesicular steatosis (Cullen, 2005). In this zebrafish study, high concentrations (mMrange)
of ACE were used to observe any phenotypic effects on the liver, which is in analogy with other zebrafish reports (He et al., 2013). CYP3A65 gene expression was not altered after ACE exposure, which is possible as not all CYPs are regulated at the mRNA level by their substrates. All other hepatotoxicity-associated genes, ex-cept NR1H4, were decreased in expression after ACE exposure. In patients with ACE overdose, total and free GC-globulin serum levels were decreased as a sign of hepatotoxicity (Amacher et al., 2005; Lee et al., 1987; Schiodt et al., 2001). As a cellular de-fense response against oxidative stress induced by ACE (McGill et al., 2012), genes involved in oxidoreductase metabolism were increased in the expression as also observed in the zebrafish model in this study for ZGC163022 (5 mMACE) and in the study
of Driessen et al. (2014 it was 660μM.
In this gene expression study of zebrafish, all hepatotoxic markers, except NR1H4, were decreased in expression for at least one tested concentration of AMI. The apoptotic marker CASP3A and metabolism-related gene CYP2K19 were increased in expres-sion. The other marker ZGC163022 was decreased in expression, whereas in the study of Driessen et al. (2014 this marker was in-creased after exposure to 10μMAMI, which is a twofold higher
concentration than in our study.
COU exhibits marked species differences in both metabolism and hepatotoxicity. In zebrafish larvae, all liver-associated gene markers, except NR1H4, were decreased in expression, as also ob-served for the other known model hepatotoxic compounds ACE and AMI. As also observed in rat studies (Lake et al., 2002; Uehara et al., 2008), increased expression of ZGC163022 points to in-creased oxido-reductase activity.
MET is a known hepatotoxin in rats. It was found that enterohepatic recirculation of metabolites was important for its hepatotoxicity (Ratra et al., 2000). MET was also indicated as a severely hepatotoxic compound in humans (O’Brien et al., 2006). In this experimental set-up, only TF was statistically
significantly decreased in expression after 5μM MET exposure,
which is not really convincing for a good model for hepatotoxic compounds.
MYC induces hepatotoxicity in mouse and rat by CYP450 meta-bolic bioactivation leading to perturbation of fatty acid, steroid and xenobiotic metabolism pathways through an adrostane
Figure 4. (a–e) Test compound concentration measurement in medium. The average measured concentration (μM, y-axis) with standard deviation of two
independent experiments was plotted against the nominal concentration (μM, x-axis) for exposure to three sublethal concentrations of four hepatotoxicants.
Only one experiment was performed for SAC. For MET, concentration in blank wells was measured for only one experiment. ACE, acetaminophen; COU, cou-marin; MET, methapyrilene; MYC, myclobutanil; SAC, saccharin.
Figure 5. (a–f ) Compound uptake by zebrafish larvae. The average and standard deviation of measured compound concentration in larvae (μM, left y-axis,
column) and the relative uptake of the compound in larvae as a percentage of the nominal concentration in the medium at the start (%, right y-axis, line) is plotted against the nominal concentration in the medium for exposure to three sublethal concentrations of hepatotoxicants (μM, x-axis). Results of two
in-dependent experiments, except for SAC only one experiment was performed. ACE, acetaminophen; AMI, amiodarone; COU, coumarin; MET, methapyrilene; MYC, myclobutanil; SAC, saccharin.
receptor and pregnane X receptor signaling pathways (Goetz and Dix, 2009; Goetz et al., 2006). The hepatic gene markers and metabolism/oxidoreductase or apoptosis-related genes were not statistically significantly affected after MYC exposure in zebrafish.
Exposure to MET and MYC resulted in no statistically significant response of any hepatotoxic marker, except for 5μMMET for the
marker TF, and none of the apoptosis- or stress-related markers compared to the strong gene responses induced by ACE, AMI and COU exposure.
A good marker to predict hepatotoxicity should give a response after exposing zebrafish larvae to hepatotoxic compounds and not non-hepatotoxic compounds. Our gene expression studies dem-onstrated that four of six tested hepatotoxic markers, more specif-ically CP, FABP10a, GC and TF are promising markers as a step towards the development of transgenic models for screening (Fig. 3a), which is the final goal of this project. These four genes showed a decreased expression after ACE, AMI and COU exposure, which was often concentration dependent. This was clearly differ-ent from the negative compound SAC, which only induced a small effect at the highest concentration on CP and GC. At first, a TF transgenic zebrafish will be developed and with successful con-struction, its complementarity will be checked to the existing FAPB10a transgenic line (Mesens et al., 2015). TF is highly expressed in the adult mammalian liver and is secreted by hepato-cytes into the serum where it functions as an iron transport protein and growth factor for a variety of cells (de Jong et al., 1990; Zakin, 1992). For that reason, transferrin enzyme among others is used in preclinical animal studies to predict adverse liver effects in humans (Amacher, 2002), and is seen in our zebrafish study as a marker for hepatotoxicity of three tested compounds. The decreased expres-sion of TF gene, resulting into disruption of normal iron metabo-lism by affecting transferrin as a major protein involved in this process (Hertz et al., 1996) might thus be one of the mechanisms inducing liver damage after xenobiotic exposure.
Chemical analysis
Zebrafish are often exposed by dissolving the compound in the water, which enables easy and fast administration. This is an ad-vantage of the model that allows for high-throughput screening. As part of this study, the concentration of test compound in the surrounding aqueous medium and within zebrafish larvae were measured to assess uptake and to interpret appropriately the rel-evance of any observed toxicity outcome. The protocol described herein was successful at determining the amount of compound present in tissue samples as small as five pooled larvae (120 hpf stage). All compounds were stable within the setup of these experiments, except AMI for which precipitation was observed al-ready after 24 h of exposure. A good agreement was observed between the measured concentrations in the medium and the nominal concentrations at the start of the experiments at 72 hpf and after 48 h exposure for all compounds. There was a wide variation between the actual concentrations of compound in the zebrafish larvae with a higher compound uptake of AMI, MET and MYC being concentrated in the larvae up to 527, 920 and 180% respectively of the concentration in the medium at the start in function of the nominal concentration (for the highest concentra-tion) after a 48 h exposure period. Conversely, levels of COU and SAC were<5% of the external concentration at 120 hpf, indicat-ing a low compound uptake, whereas ACE exposure resulted in a medium uptake (from 5 to 12%). Despite low relative uptake, it is
clear that the actual body concentration of the non-hepatotoxic compound SAC is of the same order of magnitude as some hep-atotoxic compounds (COU, AMI, MYC) while there is no pheno-typic effect on liver (true negative). We also need to remark that only parent compounds were measured in the larvae, and levels of low to medium uptake might rather be the result of slow to fast biotransformation and clearance of the parent com-pounds, while metabolites could not be quantified in our analyt-ical approach. There was an indication that compounds with low log Kow(< 1.5) (or less lipophilic character) (Table 1) resulted in
low relative uptake. However, more compounds should be evalu-ated and other physical–chemical properties should be included to confirm this hypothesis.
A relationship between log Kow and compound uptake was
shown in a study using zebrafish-based assays for the assessment of cardiac, visual and gut function (Berghmans et al., 2008), while no correlation of compound uptake with log Kow values was
observed in another study using zebrafish as a screening tool for developmental toxicity (Van den Bulck et al., 2011). On the other hand, an association could be made between the amount of compound uptake and the strength of gene expression responses, e.g., high uptake of AMI was observed in larvae and exposure resulted in a strong decreased expression of all hepatotoxicity markers. No conclusion can be made for the other compounds (ACE, COU), as they could have been metabolized, and no metab-olites were measured in this study. Nonetheless, this could be the subject of further studies. Measurement of the internal concentra-tion of a parent compound or corresponding metabolites, consid-ering uptake and clearance should be further investigated for their value as a“threshold” for gene expression changes and hepato-toxic effects.
Conclusions
Our data support the use of zebrafish larvae as a predictive animal model for assessing compound-induced hepatotoxicity. This con-venient, predictive animal model can serve as an intermediate step between cell-based evaluation and mammalian animal testing. Mammalian evidence is available to confirm the hepatotoxic na-ture of the five selected liver toxic compounds. Both ISH and real-time RT-qPCR support the phenotypic observations on liver toxicity in zebrafish. The results of the current study are part of the ongoing development and validation of a test strategy using a transgenic zebrafish line for a quick screening to prioritize un-known compounds. Our goal is to develop a TF transgenic zebrafish. With successful construction, the latter should first be tested for its complementarity to the existing FABP10a transgenic line for an extended panel of chemicals covering all the seven mechanisms of human hepatotoxicity.
Acknowledgments
The ZETOX project is sponsored by Federal Public Service, Health, Belgium (RF 10/6232). For technical assistance, the authors are grateful to Francis Boonen (VITO), Virginie Von Berg (ULg) and Marianne Voz (ULg).
Informed consent
Conflict of interest
The authors did not report any conflict of interest.
References
Alderton W, Berghmans S, Butler P, Chassaing H, Fleming A, Golder Z, Richards F, Gardner I. 2010. Accumulation and metabolism of drugs and CYP probe substrates in zebrafish larvae. Xenobiotica 40: 547–557. Amacher DE. 2002. A toxicologist’s guide to biomarkers of hepatic
re-sponse. Hum. Exp. Toxicol. 21: 253–262.
Amacher DE, Adler R, Herath A, Townsend RR. 2005. Use of proteomic methods to identify serum biomarkers associated with rat liver toxicity or hypertrophy. Clin. Chem. 51: 1796–1803.
Amaral JD, Xavier JM, Steer CJ, Rodrigues CM. 2010. The role of p53 in apo-ptosis. Discov. Med. 9: 145–152.
Berghmans S, Butler P, Goldsmith P, Waldron G, Gardner I, Golder Z, Richards FM, Kimber G, Roach A, Alderton W, Fleming A. 2008. Zebrafish based assays for the assessment of cardiac, visual and gut function– po-tential safety screens for early drug discovery. J. Pharmacol. Toxicol. Methods 58: 59–68.
Blieden M, Paramore LC, Shah D, Ben-Joseph R. 2014. A perspective on the epidemiology of acetaminophen exposure and toxicity in the United States. Expert. Rev. Clin. Pharmacol. 7: 341–348.
Boess F, Kamber M, Romer S, Gasser R, Muller D, Albertini S, Suter L. 2003. Gene expression in two hepatic cell lines, cultured primary hepatocytes, and liver slices compared to the in vivo liver gene expression in rats: possible implications for toxicogenomics use of in vitro systems. Toxicol. Sci. 73: 386–402.
Chng HT, Ho HK, Yap CW, Lam SH, Chan EC. 2012. An investigation of the bioactivation potential and metabolism profile of zebrafish versus hu-man. J. Biomol. Screen. 17: 974–986.
Chu J, Sadler KC. 2009. New school in liver development: lessons from zebrafish. Hepatology 50: 1656–1663.
Cullen JM. 2005. Mechanistic classification of liver injury. Toxicol. Pathol. 33: 6–8.
de Jong G, van Dijk JP, van Eijk HG. 1990. The biology of transferrin. Clin. Chim. Acta 190: 1–46.
Driessen M, Kienhuis AS, Pennings JL, Pronk TE, van de Brandhof EJ, Roodbergen M, Spaink HP, van de Water B, van der Ven LT. 2013. Explor-ing the zebrafish embryo as an alternative model for the evaluation of liver toxicity by histopathology and expression profiling. Arch. Toxicol. 87: 807–823.
Driessen M, Kienhuis AS, Vitins AP, Pennings JL, Pronk TE, van den Brandhof EJ, Roodbergen M, van de Water B, van der Ven LT. 2014. Gene expres-sion markers in the zebrafish embryo reflect a hepatotoxic response in animal models and humans 2. Toxicol. Lett. 230: 48–56.
Driessen M, Vitins AP, Pennings JL, Kienhuis AS, Water BV, van der Ven LT. 2015. A transcriptomics-based hepatotoxicity comparison between the zebrafish embryo and established human and rodent in vitro and in vivo models using cyclosporine A, amiodarone and acetaminophen 1. Toxicol. Lett. 232: 403–412.
Ekor M, Odewabi AO, Kale OE, Bamidele TO, Adesanoye OA, Farombi EO. 2013. Modulation of paracetamol-induced hepatotoxicity by phospho-diesterase isozyme inhibition in rats: a preliminary study. J. Basic Clin. Physiol. Pharmacol. 24: 73–79.
Elferink MG, Olinga P, Draaisma AL, Merema MT, Bauerschmidt S, Polman J, Schoonen WG, Groothuis GM. 2008. Microarray analysis in rat liver slices correctly predicts in vivo hepatotoxicity. Toxicol. Appl. Pharmacol. 229: 300–309.
EU. Commission implementing decision of 14 November 2012 establishing a common format for the submission of the information pursuant to Di-rective 2010/63/EU of the European Parliament and of the Council on the protection of animals used for scientific purposes.
Goetz AK, Dix DJ. 2009. Mode of action for reproductive and hepatic toxic-ity inferred from a genomic study of triazole antifungals. Toxicol. Sci. 110: 449–462.
Goetz AK, Bao W, Ren H, Schmid JE, Tully DB, Wood C, Rockett JC, Narotsky MG, Sun G, Lambert GR, Thai SF, Wolf DC, Nesnow S, Dix DJ. 2006. Gene expression profiling in the liver of CD-1 mice to characterize the hepa-totoxicity of triazole fungicides. Toxicol. Appl. Pharmacol. 215: 274–284. Goldstone JV, McArthur AG, Kubota A, Zanette J, Parente T, Jonsson ME, Nelson DR, Stegeman JJ. 2010. Identification and developmental
expression of the full complement of Cytochrome P450 genes in Zebrafish. BMC Genomics 11: 643.
Guillouzo A, Corlu A, Aninat C, Glaise D, Morel F, Guguen-Guillouzo C. 2007. The human hepatoma HepaRG cells: a highly differentiated model for studies of liver metabolism and toxicity of xenobiotics. Chem. Biol. Inter-act. 168: 66–73.
Gustafson AL, Stedman DB, Ball J, Hillegass JM, Flood A, Zhang CX, Panzica-Kelly J, Cao J, Coburn A, Enright BP, Tornesi MB, Hetheridge M, Augus-tine-Rauch KA. 2011. Inter-laboratory assessment of a harmonized zebrafish developmental toxicology assay– Progress report on phase I. Reprod. Toxicol. 33: 155–164.
He JH, Guo SY, Zhu F, Zhu JJ, Chen YX, Huang CJ, Gao JM, Dong QX, Xuan YX, Li CQ. 2013. A zebrafish phenotypic assay for assessing drug-induced hepatotoxicity. J. Pharmacol. Toxicol. Methods 67: 25–32. Heni M, Wagner R, Ketterer C, Bohm A, Linder K, Machicao F, Machann J,
Schick F, Hennige AM, Stefan N, Haring HU, Fritsche A, Staiger H. 2013. Genetic variation in NR1H4 encoding the bile acid receptor FXR determines fasting glucose and free fatty acid levels in humans. J. Clin. Endocrinol. Metab. 98: E1224–E1229.
Hertz R, Seckbach M, Zakin MM, Bar-Tana J. 1996. Transcriptional suppres-sion of the transferrin gene by hypolipidemic peroxisome proliferators. J. Biol. Chem. 271: 218–224.
Hill A, Mesens N, Steemans M, Xu JJ, Aleo MD. 2012. Comparisons between in vitro whole cell imaging and in vivo zebrafish-based approaches for identifying potential human hepatotoxicants earlier in pharmaceutical development. Drug Metab. Rev. 44: 127–140.
Howe K, Clark MD, Torroja CF, et al. 2013. The zebrafish reference genome se-quence and its relationship to the human genome. Nature 496: 498–503. Isogai S, Horiguchi M, Weinstein BM. 2001. The vascular anatomy of the de-veloping zebrafish: an atlas of embryonic and early larval development. Dev. Biol. 230: 278–301.
Jaeschke H, Gores GJ, Cederbaum AI, Hinson JA, Pessayre D, Lemasters JJ. 2002. Mechanisms of hepatotoxicity. Toxicol. Sci. 65: 166–176. Kienhuis AS, van de Poll MC, Wortelboer H, van Herwijnen M, Gottschalk R,
Dejong CH, Boorsma A, Paules RS, Kleinjans JC, Stierum RH, van Delft JH. 2009. Parallelogram approach using rat-human in vitro and rat in vivo toxicogenomics predicts acetaminophen-induced hepatotoxicity in humans. Toxicol. Sci. 107: 544–552.
Koruk M, Taysi S, Savas MC, Yilmaz O, Akcay F, Karakok M. 2003. Serum levels of acute phase proteins in patients with nonalcoholic steatohepatitis. Turk. J. Gastroenterol. 14: 12–17.
Lake BG, Evans JG, Chapuis F, Walters DG, Price RJ. 2002. Studies on the dis-position, metabolism and hepatotoxicity of coumarin in the rat and Syr-ian hamster. Food Chem. Toxicol. 40: 809–823.
Lam SH, Ung CY, Hlaing MM, Hu J, Li ZH, Mathavan S, Gong Z. 2013. Molec-ular insights into 4-nitrophenol-induced hepatotoxicity in zebrafish: Transcriptomic, histological and targeted gene expression analyses. Biochim. Biophys. Acta 1830: 4778–4789.
Lecluyse EL, Witek RP, Andersen ME, Powers MJ. 2012. Organotypic liver cul-ture models: meeting current challenges in toxicity testing. Crit. Rev. Toxicol. 42: 501–548.
Lee WM. 2003. Drug-induced hepatotoxicity. N. Engl. J. Med. 349: 474–485. Lee WM, Emerson DL, Young WO, Goldschmidt-Clermont PJ, Jollow DJ, Gal-braith RM. 1987. Diminished serum Gc (vitamin D-binding protein) levels and increased Gc:G-actin complexes in a hamster model of fulmi-nant hepatic necrosis. Hepatology 7: 825–830.
Mavropoulos A, Devos N, Biemar F, Zecchin E, Argenton F, Edlund H, Motte P, Martial JA, Peers B. 2005. sox4b is a key player of pancreatic alpha cell differentiation in zebrafish. Dev. Biol. 285: 211–223.
McGill MR, Sharpe MR, Williams CD, Taha M, Curry SC, Jaeschke H. 2012. The mechanism underlying acetaminophen-induced hepatotoxicity in humans and mice involves mitochondrial damage and nuclear DNA fragmentation. J. Clin. Invest. 122: 1574–1583.
Mennecozzi M, Landesmann B, Harris GA, Liska R, Whelan M. 2012. Hepato-toxicity screening taking a mode-of-action approach using HepaRG cells and HCA. ALTEX Proc. 1: 193–204.
Mesens N, Crawford AD, Menke A, Hung PD, Van Goethem F, Nuyts R, Hansen E, Wolterbeek A, Van Gompel GJ, De Witte P, Esguerra CV. 2015. Are zebrafish larvae suitable for assessing the hepatotoxicity po-tential of drug candidates? J. Appl. Toxicol. 35: 1017–1029.
Monbaliu D, de Vries B, Crabbe T, van Heurn E, Verwaest C, Roskams T, Fevery J, Pirenne J, Buurman WA. 2005. Liver fatty acid-binding protein: an early and sensitive plasma marker of hepatocellular damage and a reliable predictor of graft viability after liver transplantation from non-heart-beating donors. Transplant. Proc. 37: 413–416.
Mudumana SP, Wan H, Singh M, Korzh V, Gong Z. 2004. Expression analyses of zebrafish transferrin, ifabp, and elastaseB mRNAs as differentiation markers for the three major endodermal organs: liver, intestine, and exocrine pancreas. Dev. Dyn. 230: 165–173.
Nelson SD. 1990. Molecular mechanisms of the hepatotoxicity caused by acetaminophen. Semin. Liver Dis. 10: 267–278.
Noel ES, Reis MD, Arain Z, Ober EA. 2010. Analysis of the Albumin/alpha-Fetoprotein/Afamin/Group specific component gene family in the context of zebrafish liver differentiation. Gene Expr. Patterns 10: 237–243.
O’Brien PJ, Irwin W, Diaz D, Howard-Cofield E, Krejsa CM, Slaughter MR, Gao B, Kaludercic N, Angeline A, Bernardi P, Brain P, Hougham C. 2006. High concordance of drug-induced human hepatotoxicity with in vitro cyto-toxicity measured in a novel cell-based model using high content screening. Arch. Toxicol. 80: 580–604.
OECD TG 203. 1992. Test Guideline No. 203: Fish, Acute Toxicity Test. Pack M, Solnica-Krezel L, Malicki J, Neuhauss SC, Schier AF, Stemple DL,
Driever W, Fishman MC. 1996. Mutations affecting development of zebrafish digestive organs. Development 123: 321–328.
Pardo-Martin C, Chang TY, Koo BK, Gilleland CL, Wasserman SC, Yanik MF. 2010. High-throughput in vivo vertebrate screening. Nat. Methods 7: 634–636.
Porter AG, Jänicke RU. 1999. Emerging roles of caspase-3 in apoptosis. Cell Death Differ. 6: 99–104.
Ratra GS, Powell CJ, Park BK, Maggs JL, Cottrell S. 2000. Methapyrilene hep-atotoxicity is associated with increased hepatic glutathione, the forma-tion of glucuronide conjugates, and enterohepatic recirculaforma-tion. Chem. Biol. Interact. 129: 279–295.
Schiodt FV, Ott P, Tygstrup N, Dahl B, Bondesen S. 2001. Temporal profile of total, bound, and free Gc-globulin after acetaminophen overdose. Liver Transpl. 7: 732–738.
Shi X, Gu A, Ji G, Li Y, Di J, Jin J, Hu F, Long Y, Xia Y, Lu C, Song L, Wang S, Wang X. 2011. Developmental toxicity of cypermethrin in embryo-larval stages of zebrafish. Chemosphere 85: 1010–1016.
Tseng HP, Hseu TH, Buhler DR, Wang WD, Hu CH. 2005. Constitutive and xenobiotics-induced expression of a novel CYP3A gene from zebrafish larva. Toxicol. Appl. Pharmacol. 205: 247–258.
Uehara T, Kiyosawa N, Shimizu T, Omura K, Hirode M, Imazawa T, Mizukawa Y, Ono A, Miyagishima T, Nagao T, Urushidani T. 2008. Species-specific differences in coumarin-induced hepatotoxicity as an example toxicogenomics-based approach to assessing risk of toxicity to humans. Hum. Exp. Toxicol. 27: 23–35.
van den Bulck K, Hill A, Mesens N, Diekman H, De SL, Lammens L. 2011. Zebrafish developmental toxicity assay: A fishy solution to reproductive toxicity screening, or just a red herring? Reprod. Toxicol. 32: 213–219. Vliegenthart AD, Tucker CS, Del PJ, Dear JW. 2014. Zebrafish as model
or-ganisms for studying drug-induced liver injury 1. Br. J. Clin. Pharmacol. 78: 1217–1227.
Wiegand C, Pflugmacher S, Giese M, Frank H, Steinberg C. 2000. Uptake, tox-icity, and effects on detoxication enzymes of atrazine and trifluoroacetate in embryos of zebrafish. Ecotoxicol. Environ. Saf. 45: 122–131. Xu JJ, Henstock PV, Dunn MC, Smith AR, Chabot JR, de Graaf D. 2008.
Cellu-lar imaging predictions of clinical drug-induced liver injury. Toxicol. Sci. 105: 97–105.
Zakin MM. 1992. Regulation of transferrin gene expression. FASEB J. 6: 3253–3258.
Supporting information
Additional supporting information may be found in the online version of this article at the publisher’s web-site.