Developpement of a genetic traceability test in pig based on single nucleotide polymorphism detection
F. Goffaux*, B. China, L. Dams, A. Clinquart, G. Daube
Department of Food Sciences, Faculty of Veterinary Medicine, University of Liège, Belgium.
Corresponding author: Dr. Frédéric Goffaux Fax: + 32 4 366 40 44 Tel.: +32 4 366 40 14 e-mail: fgoffaux@ulg.ac.be
Abstract
In order to assure traceability along the meat transformation chain, a powerful system is required. The administrative traceability shows limits that the use of genetic markers could overcome. The individual genome contains sequence differences, basis of the genetic polymorphism of which the genetic markers are the witnesses. Among them, two classes seem to dominate on the traceability field: the microsatellites and the single nucleotide polymorphisms (SNP). The aim of this work was to develop a genetic traceability test in pig based on SNPs mainly located in 5’ and 3’ untranslated regions. We selected a set of 21 SNP markers including new SNPs identified in this study and SNPs previously described. A genotyping assay was performed on 96 individuals from the major crossbred pig population in Belgium. Results showed that all individuals tested presented a different genotype. We concluded that such a genetic treaceability
approach might help the administrative system.
1. Introduction
During the last years in Belgium, the food industry was affected by several scandals and crisis such as the hormones, the polychlorinated biphenyl (PCB) (unjustly called "dioxin crisis") and the bovine spongiform encephalopathy (ESB), resulting in a mistrust of the consumer for the Belgian meat and a lost of export dealings [4]. In order to restore the brand image of Belgian meat products, it is important to assure a traceability along the meat transformation chain. In Belgium, several administrative
traceability system exist, the principal is the SANITEL system including an automatic treatment of data related to animal identification and registration [4]. The main disadvantage of this system is that the traceability stopped at the slaughterhouse. It is therefore almost impossible to link a piece of meat with an animal. Moreover, the administrative traceability is not unfailing, the lost of documents and the risk of cheating are always possible. So, the administrative traceability presents limits that the use of genetic markers could overcome.
Indeed, the genome of individual animals differs from each other (with the exception of monozygotic twins). In other words, it is possible to distinguish all individuals of the same species since they possess differences in their DNA sequence. Today, the genetic markers used for the individual identification and parentage control are almost exclusively microsatellite
markers, which occur once every 30-46 kb in pigs [16]. Single nucleotide polymorphism (SNP) markers are more abundant with an occurrence of about one SNP per kb in human [14] and about one SNP per 500 bp in mice [12] and cattle [8]. SNPs present following advantages over microsatelllite markers: 1) relatively stable from generation to generation [10], 2) more easily in laboratory handling and interpretation [10], 3) usable for standardized representation of genotyping results as a digital DNA
signatures [6], and 4) compatible with automation [11]. One disadvantage is that SNP is generally a biallelic marker as a result a lower information content compared with a highly polymorphic microsatellite. But, this disadvantage can be compensated by a higher number (at least 20) of markers [15].
The first step of this study was to find new SNPs present in the 5' and 3' untranslated region (UTR) of pig genes. Next, we selected the more informative SNPs to integrate a set of SNP markers. After all, we estimated the potential utility of these markers in animal identification. The final aim of this work was to develop a powerful genetic traceability test for use in the major crossbred pig population found in Belgium in order to improve the administrative system used now.
2. Materials and methods
2.1. Animals and DNA samples
The panel of pigs consisted of 96 crossbred (Large White, Piétrain, Landrace) originated from 5 different channels of pig production in Belgium. DNA was extracted from pieces of cheek collected at the slaughterhouse, using the Wizard SV Genomic DNA Purification System (Promega) following the recommendation of the manufacturer.
2.2. PCR Primer design
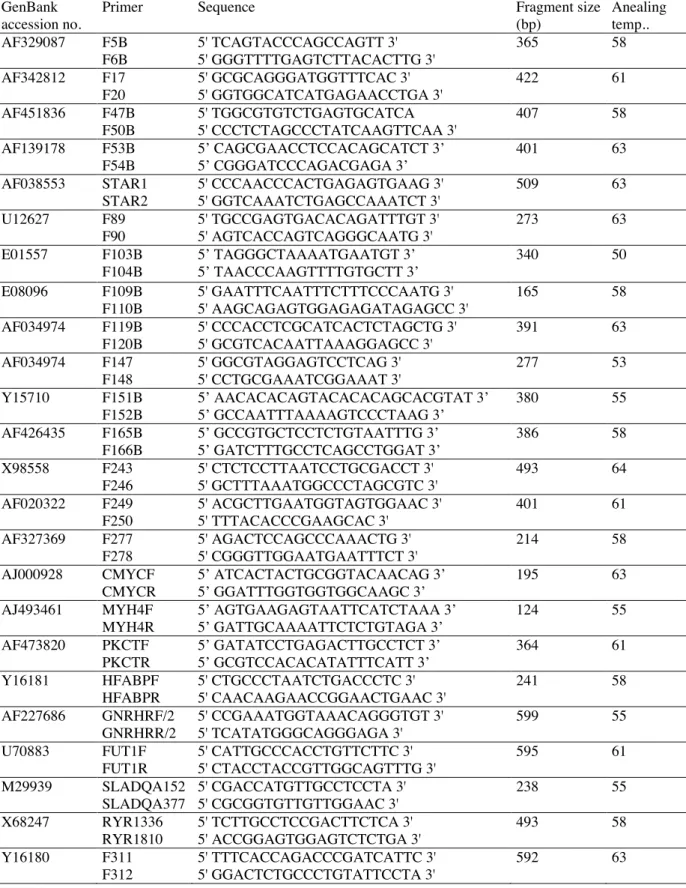
One hundred and forty primer pairs were used for amplification and SSCP analysis (not shown). Primers used for sequencing and polymorphism identification are listed in Table I.
All primers were designed with Oligo 6.6 software (Medprobe). For SSCP analysis, PCR products length was comprised between 100 and 300 base pairs.
The PCR reactions contained 5 µl of purified DNA, 1 U of Taq DNA polymerase (Amersham Biosciences), 5 µl of 20mM dNTP mix
(Eurogentec), 5 µl of 10X PCR buffer and 0,5 µl of each primer (40 µM) in a total volume of 50 µl. Reactions were performed in a Flexigene thermal
cycler (Techne) with the following conditions: initial denaturation at 94°C for 5 min., followed by 35 cycles at 94°C for 30 sec., annealing temperature (see Tab. I) for 30 sec. and 72°C for 1 min, and a final extension at 72°C for 5 min. PCR products were analyzed by 2% agarose gel electrophoresis in 1X TAE buffer.
2.4. Single strand conformation polymorphism (SSCP) analysis
For SSCP, 5 µl of the PCR product was mixed 1:1 with denaturating buffer
(95% formamide, 0,025% xylene cyanol and 0,025% bromophenol blue), heat-denaturated at 95°C for 5 min., and then chilled on ice. Electrophoresis was carried out at 12°C constant temperature on a GeneGel SSCP gel (Amersham Biosciences) in a GenePhor Electrophoresis Unit (Amersham Biosciences). The following conditions were used: 6mA 90V for 25 min. and 14 mA 500V for 50 min. Bands were visualized with the DNA Silver Staining Kit (Amersham Biosciences).
Amplification products were purified on a KingFisher Magnetic Particle Processor (Thermo LifeSciences) using the Wizard MagneSil PCR Clean-Up System (Promega). Sequencing reactions were performed in 20 µl containing 5 µl of purified PCR product, 8 µl of DYEnamic ET Terminator sequencing premix (Amersham Biosciences) and 1 µl of primer (4 mM).
Upper and/or lower PCR primers were used as sequencing primer. The cycling conditions were: 25 cycles at 95°C for 20 sec., 50°C for 15 sec., and 60°C for 1 min. Sequencing reactions were purified with AutoSeq96
(Amersham Biosciences) and automatic reading was performed using a MegaBACE 500 sequencer (Amersham Biosciences). The sequence data were analyzed with the Sequence Analyzer 3.0 software (Amersham Biosciences) and the sequence comparisons were performed with ClustalW (http://www.ebi.ac.uk/clustalw/).
2.6. Single nucleotide primer extension (SNuPe)
Amplification products were purified as described in DNA sequencing. For the primer extension reaction the following mix was used: 5 µl of purified PCR product, 1 µl of primer (2 pmol) and 4 µl of SNuPe premix
(Amersham Biosciences) in a total volume of 10 µl. Following conditions
were applied: 25 cycles at 96°c for 10 sec., 50°C for 5 sec. and 60°C for 10 sec. Reaction products were purified as decribed in DNA sequencing. Five
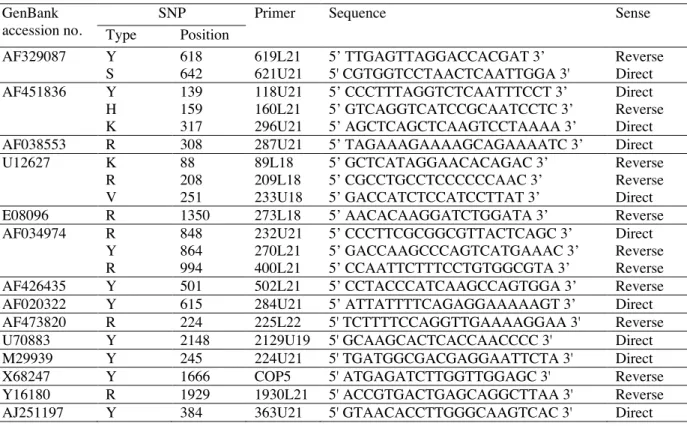
µl of the reaction products were finally combined 1:1 with a multi-injection marker for separation and detection on the MegaBACE 500. Data were analyzed with SNP Profiler 1.0 software (Amersham Biosciences). Extension primers are presented in the Table II.
3. Results
3.1. PCR amplification and SSCP analysis
In order to find new SNPs, a first screening by the SSCP method was
realized on 20 5'UTR and 42 3'UTR. Thirty-nine primer pairs of 140 did not give the expected result by PCR (no amplification or non specific
from 96 for amplification and subsequent SSCP analysis of the PCR product. A polymorphism in the migration profile was observed with 38 primer pairs. Presence of SNP(s) was confirmed or invalidated in these PCR products by DNA sequencing.
3.2. Polymorphism identification
In order to determine the type and the position of the SNP(s), PCR products presenting a SSCP polymorphism were submitted to sequencing on both strands. Presence of SNP was confirmed with 18 primer pairs. In total, 39 new SNPs were discovered (Tab. III), and 1 SNP in the H-FABP gene (GenBank X98558) was already described. So, over 23382 base pairs amplified, 40 SNPs were identified, representing an average of 1 SNP per 585 bp. A 509 bp fragment of the 5'UTR of the steroidogenic acute
regulatory (StAR) protein gene (GenBank AF038553) contained 11 SNPs, and a new SNP was identified in the 5‘UTR of the heart fatty acid-binding protein (H-FABP) gene (GenBank X98558). Thirty SNPs of 40 were transitions and 8 were transversions, and 2 polymorphisms showed more than 2 alleles.
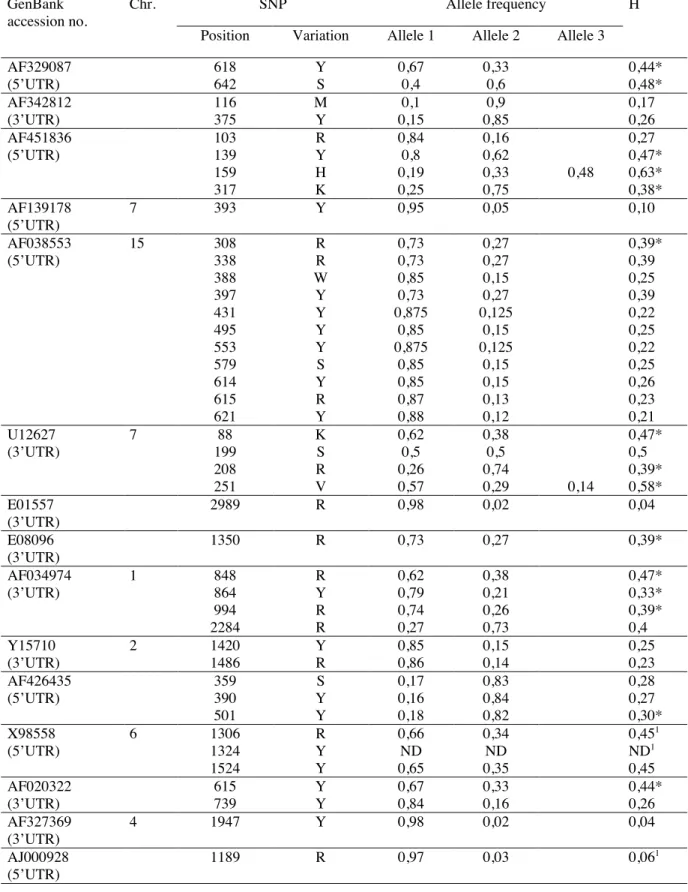
For this step, new PCR primers were designed. Forty-eight DNA samples out from 96 were submitted to PCR and sequencing. For each SNP, allele frequency was estimated and the polymorphism rate (heterozygosity) was
calculated as follow: . Results are presented in Table III. We
considered that a SNP is highly informative when the H value is comprised between 0,3 and 0,5. Only 21 SNPs out of 40 presented this criterion. But, SNPs in the same sequence were sometimes highly associated, and in this case we selected only one of them. Therefore, to obtain a minimum of 20 highly informative SNPs usable in a genotyping test, we completed our panel with SNPs already described in 5'UTR and 3'UTR and others various SNPs in porcine genes. Polymorphism rate for these SNPs was also
determined (Tab. III). For 4 SNPs, no polymorphism was observed in the DNA sequence of the samples tested. After this first discrimination based on the H value, 22 SNPs remained available.
3.4. Probability of identity in crossbred pig population and genotyping assay
The SNP genotyping method was based on primer extension reaction and multiple injection system. The design of the SNP primers was done according to the recommended guidelines by Amersham Biosciences with
the consequence that for some SNPs no SNP primer could be selected (i.e. in X98558 sequence). Finally, 21 SNPs were included for the genotyping test (Tab. III). The utility of the set of these 21 SNPs to identify all animals in a population was evaluated. The average for the H value for these 21 SNPs was 0,44. The probability that an individual A selected randomly in a population is identical to an individual B selected randomly in the same population was calculated as follow [13]:
This probability is approximately 7 x 10⁻⁹
for the 21 SNPs selected. To test our SNP set in a real case, we performed a genotyping assay on 96 individuals representing the major crossbred pig population in Belgium and originated from 5 different pig production channels. Results showed that not any pigs tested possessed the same genotype (data not shown).
4. Discussion
Following the recent crisis in the animal production area, the public has emphasised the need for the improved identification of animals and animal products that can guaranty the traceability from the producer to the consumer. A beef carcass has a unique identity, linked to the identity of the live animal. However after processing from the slaughterhouse to the retail point, the carcass may be disassembled into a lot of separate pieces. To maintain identity through this processing and distribution chain using conventional labelling system is difficult [3]. Only DNA could help the administrative traceability as DNA sequence in each nucleic cell of an individual is identical and this sequence is specific to the individual (excepted for monozygotic twins).
To develop a traceability test in pig based on single nucleotide polymorphism, two choices presented to us: working with SNPs already present in GenBank or searching new SNPs in the major crossbred pig population in Begium. We chose the second solution. We studied 5' and 3'UTR of pig genes by PCR amplification and SSCP analysis. Seventy-two percent of the primer pairs designed gave the expected PCR product. For the others, either PCR conditions used were not optimal, or primers annealed in regions where DNA forms secondary structures, or primers were not
for only 38% of the primer pairs tested. Presence of SNPs was confirmed from PCR products obtained with only 18% of the primer pairs.
In total, we identified 40 SNPs, representing an average of 1 SNP per 585 bp. This value is low compared with a similar study [9]. By directly sequencing PCR amplification products from genes on the porcine
chromosome 2, these authors found 1 SNP per 108 bp. This strong
difference could be explained by the fact that we have missed SNPs when performing a first sreening by SSCP analysis. Interestingly, the first third of the 5'UTR of the StAR protein gene contained 11 SNPs representing an average of 1 SNP per 46 bp. Such regions with a high concentration of SNPs were already described in others porcine genes [1, 7]. These high polymorphic regions were used to develop a genotyping test by sequencing [2]. Composition of the 39 new SNPs identified in this study was: 74% C/T or A/G, 21% A/T or G/C or A/C or G/T, and 5% others. This observation is comparable with previous studies [5, 9].
The heterozygosity value for each new SNP and for SNPs previously described was calculated. The H value varied from 0 to 0,63. The H values > 0,5 are explained by the fact that two polymorphisms showed more than 2 alleles. Furthermore, some SNPs previously described were not observed in the pig population used in this study. This observation underlined the fact that SNP could be population specific. Twenty-one informative SNP markers (H>0,3) were selected for the genotyping test.
The probability that 2 individuals selected in the same population are identical was approximately 7 x 10⁻⁹. Since the Belgian pig population is 7
106
, the test was considered as sufficiently discriminant. A real case scenario was realized by genotyping 96 individuals originated from 5 different pig production channels in Belgium. All individuals possessed a unique "DNA fingerprinting". Therefore, it seems that our genotyping test might be usable for a genetic traceability system. The main SNP detection techniques used for a high throughpout are DNA microarrays, mass spectrometry or OLA (oligonucleotide ligation assay). In the next future, we will change or improve our genotyping method to minimize the laboratory handling and to reduce the cost of the test.
Acknowledgements
This work was financed by the Direction Générale des Technologies, de la Recherche et de l’Energie (DGTRE) of the Ministère de la Région Wallonne (Convention n° 114880).
References
[1] Ando A., Kawata H., Murakami T., Shigenari A., Shiina T., Sada M., Tsuji T., Toriu A., Nakanishi Y., Mitsuhashi T., Sekikawa K., Inoko H., cDNA cloning and genetic polymorphism of the swine major histocompatibility complex (SLA) class II DMA gene, Anim. Genet. 32 (2001) 73-77.
[2] China B., Clinquart A., Daube G., Développement d’un système de traçabilité génétique chez le porc basé sur le séquençage de régions riches en SNP, Journées Recherche Porcine 36 (2004) 289-292.
[3] Cunningham E.P., Meghen C.M., Biological identification systems: genetic markers, Rev. Sci. Tech. Off. Int. Epiz. 20 (2001) 491-499.
[4] Evrard V., China B., Noirfalise R., Daube G., Clinquart A., La traçabilité dans la filière viande : I. La traçabilité administrative, Ann. Méd. Vét. 145 (2001) 05-12.
[5] Fahrenkrug S.C., Freking B.A., Smith T.P.L., Rohrer G.A., Keele J.W., Single nucleotide polymorphism (SNP) discovery in porcine expressed genes, Anim. Genet. 33 (2002) 186-195.
[6] Fries R., Durstewitz G., Digital DNA signatures for animal tagging, Nat. Biotechnol. 19 (2001) 508.
[7] Gong Y., Eleven single nucleotide polymorphisms (SNPs) at a hypervariable locus on pig chromosome 6, Anim. Genet. 33 (2002) 72-84.
[8] Heaton M.P., Grosse W.M., Kappes S.M., Keele J.W., Chitko-McKown C.G., Cundiff L.V., Braun A., Little D.P., Laegreid W.W., Estimation of DNA sequence diversity in bovine cytokine genes, Mamm. Genome 12 (2001) 32-37.
[9] Jungerius B.J., Rattink A.P., Crooijmans R.P.M.A., van der Poel J.J., van Oost B.A., te Pas M.F.W., Groenen M.A.M., Development of a
single nucleotide polymorphism map of porcine chromosome 2, Anim. Genet. 34 (2003) 429-437.
[10] Krawczak M., Informativity assessment for biallelic single nucleotide polymorphisms, Electrophoresis 20 (1999) 1676-1681.
[11] Landegren U., Nilsson M., Kwok P.Y., Reading bits of genetic information: methods for single-nucleotide polymorphism analysis, Genome Res. 8 (1998) 769-776.
[12] Lindblad-Toh K., Winchester E., Daly M.J., Wang D.G., Hirschhorn J.N., Laviolette J.P., Ardlie K., Reich D.E., Robinson E., Sklar P., Shah N., Thomas D., Fan J.B., Gingeras T., Warrington J., Patil N., Hudson T.J., Lander E.S., Large-scale discovery and genotyping of single-nucleotide polymorphisms in the mouse, Nat. Genet. 24 (2000) 381-386.
[13] Peelman L.J., Mortiaux F., Van Zeveren A., Dansercoer A., Mommens G., Coopman F., Bouquet Y., Burny A., Renaville R., Portetelle D., Evaluation of the genetic variability of 23 bovine microsatellite markers in four Belgian cattle breeds, Anim. Genet. 29 (1998) 161-167.
[14] Wang D.G., Fan J.B., Siao C.J. Berno A., Young P., Sapolsky R., Ghandour G., Perkins N., Winchester E., Spencer J., Kruglyak L., Stein L., Hsie L., Topaloglou T., Hubell E., Robinson E., Mittmann M., Morris M.S., Shen N., Kilburn D., Rioux J., Nusbaum C., Rozen S., Hudson T.J., Lipshutz R., Chee M., Lander E.S., Large-scale identification, mapping, and genotyping of single-nucleotide polymorphisms in the human genome, Science 280 (1998) 1077-1082.
[15] Werner F.A.O., Durstewitz G., Habermann F.A., Thaller G., Krämer W., Kollers S., Buitkamp J., Georges M., Brem G., Mosner J., Fries R., Detection and characterization of SNPs useful for identity control and parentage testing in major European dairy breeds, Anim. Genet. 35 (2004) 44-49.
[16] Winterø A.K., Fredholm M., Thomsen P.D., Variable (dG-dT)n.(dC-dA)n sequences in the procine genome, Genomics 12 (1992) 281-288.
Table I : PCR primers used in this study. GenBank
accession no.
Primer Sequence Fragment size
(bp) Anealing temp.. AF329087 F5B F6B 5' TCAGTACCCAGCCAGTT 3' 5' GGGTTTTGAGTCTTACACTTG 3' 365 58 AF342812 F17 F20 5' GCGCAGGGATGGTTTCAC 3' 5' GGTGGCATCATGAGAACCTGA 3' 422 61 AF451836 F47B F50B 5' TGGCGTGTCTGAGTGCATCA 5' CCCTCTAGCCCTATCAAGTTCAA 3' 407 58 AF139178 F53B F54B 5’ CAGCGAACCTCCACAGCATCT 3’ 5’ CGGGATCCCAGACGAGA 3’ 401 63 AF038553 STAR1 STAR2 5' CCCAACCCACTGAGAGTGAAG 3' 5' GGTCAAATCTGAGCCAAATCT 3' 509 63 U12627 F89 F90 5' TGCCGAGTGACACAGATTTGT 3' 5' AGTCACCAGTCAGGGCAATG 3' 273 63 E01557 F103B F104B 5’ TAGGGCTAAAATGAATGT 3’ 5’ TAACCCAAGTTTTGTGCTT 3’ 340 50 E08096 F109B F110B 5' GAATTTCAATTTCTTTCCCAATG 3' 5' AAGCAGAGTGGAGAGATAGAGCC 3' 165 58 AF034974 F119B F120B 5' CCCACCTCGCATCACTCTAGCTG 3' 5' GCGTCACAATTAAAGGAGCC 3' 391 63 AF034974 F147 F148 5' GGCGTAGGAGTCCTCAG 3' 5' CCTGCGAAATCGGAAAT 3' 277 53 Y15710 F151B F152B 5’ AACACACAGTACACACAGCACGTAT 3’ 5’ GCCAATTTAAAAGTCCCTAAG 3’ 380 55 AF426435 F165B F166B 5’ GCCGTGCTCCTCTGTAATTTG 3’ 5’ GATCTTTGCCTCAGCCTGGAT 3’ 386 58 X98558 F243 F246 5' CTCTCCTTAATCCTGCGACCT 3' 5' GCTTTAAATGGCCCTAGCGTC 3' 493 64 AF020322 F249 F250 5' ACGCTTGAATGGTAGTGGAAC 3' 5' TTTACACCCGAAGCAC 3' 401 61 AF327369 F277 F278 5' AGACTCCAGCCCAAACTG 3' 5' CGGGTTGGAATGAATTTCT 3' 214 58 AJ000928 CMYCF CMYCR 5’ ATCACTACTGCGGTACAACAG 3’ 5’ GGATTTGGTGGTGGCAAGC 3’ 195 63 AJ493461 MYH4F MYH4R 5’ AGTGAAGAGTAATTCATCTAAA 3’ 5’ GATTGCAAAATTCTCTGTAGA 3’ 124 55 AF473820 PKCTF PKCTR 5’ GATATCCTGAGACTTGCCTCT 3’ 5’ GCGTCCACACATATTTCATT 3’ 364 61 Y16181 HFABPF HFABPR 5' CTGCCCTAATCTGACCCTC 3' 5' CAACAAGAACCGGAACTGAAC 3' 241 58 AF227686 GNRHRF/2 GNRHRR/2 5' CCGAAATGGTAAACAGGGTGT 3' 5' TCATATGGGCAGGGAGA 3' 599 55 U70883 FUT1F FUT1R 5' CATTGCCCACCTGTTCTTC 3' 5' CTACCTACCGTTGGCAGTTTG 3' 595 61 M29939 SLADQA152 SLADQA377 5' CGACCATGTTGCCTCCTA 3' 5' CGCGGTGTTGTTGGAAC 3' 238 55 X68247 RYR1336 RYR1810 5' TCTTGCCTCCGACTTCTCA 3' 5' ACCGGAGTGGAGTCTCTGA 3' 493 58 Y16180 F311 F312 5' TTTCACCAGACCCGATCATTC 3' 5' GGACTCTGCCCTGTATTCCTA 3' 592 63
AJ251197 M19 M20
5' GTGAGGGGGACATTGGAAAC 3' 5' GGGCAGAGCGGGTGA 3'
Table II : extension primers used for the SNuPe reaction. SNP
GenBank
accession no. Type Position
Primer Sequence Sense
AF329087 Y S 618 642 619L21 621U21 5’ TTGAGTTAGGACCACGAT 3’ 5' CGTGGTCCTAACTCAATTGGA 3' Reverse Direct AF451836 Y H K 139 159 317 118U21 160L21 296U21 5’ CCCTTTAGGTCTCAATTTCCT 3’ 5’ GTCAGGTCATCCGCAATCCTC 3’ 5’ AGCTCAGCTCAAGTCCTAAAA 3’ Direct Reverse Direct
AF038553 R 308 287U21 5’ TAGAAAGAAAAGCAGAAAATC 3’ Direct
U12627 K R V 88 208 251 89L18 209L18 233U18 5’ GCTCATAGGAACACAGAC 3’ 5’ CGCCTGCCTCCCCCCAAC 3’ 5’ GACCATCTCCATCCTTAT 3’ Reverse Reverse Direct
E08096 R 1350 273L18 5’ AACACAAGGATCTGGATA 3’ Reverse
AF034974 R Y R 848 864 994 232U21 270L21 400L21 5’ CCCTTCGCGGCGTTACTCAGC 3’ 5’ GACCAAGCCCAGTCATGAAAC 3’ 5’ CCAATTCTTTCCTGTGGCGTA 3’ Direct Reverse Reverse
AF426435 Y 501 502L21 5’ CCTACCCATCAAGCCAGTGGA 3’ Reverse
AF020322 Y 615 284U21 5’ ATTATTTTCAGAGGAAAAAGT 3’ Direct
AF473820 R 224 225L22 5' TCTTTTCCAGGTTGAAAAGGAA 3' Reverse
U70883 Y 2148 2129U19 5' GCAAGCACTCACCAACCCC 3' Direct
M29939 Y 245 224U21 5' TGATGGCGACGAGGAATTCTA 3' Direct
X68247 Y 1666 COP5 5' ATGAGATCTTGGTTGGAGC 3' Reverse
Y16180 R 1929 1930L21 5' ACCGTGACTGAGCAGGCTTAA 3' Reverse
Table III : type and position of SNPs
SNP Allele frequency
GenBank accession no.
Chr.
Position Variation Allele 1 Allele 2 Allele 3
H AF329087 (5’UTR) 618 642 Y S 0,67 0,4 0,33 0,6 0,44* 0,48* AF342812 (3’UTR) 116 375 M Y 0,1 0,15 0,9 0,85 0,17 0,26 AF451836 (5’UTR) 103 139 159 317 R Y H K 0,84 0,8 0,19 0,25 0,16 0,62 0,33 0,75 0,48 0,27 0,47* 0,63* 0,38* AF139178 (5’UTR) 7 393 Y 0,95 0,05 0,10 AF038553 (5’UTR) 15 308 338 388 397 431 495 553 579 614 615 621 R R W Y Y Y Y S Y R Y 0,73 0,73 0,85 0,73 0,875 0,85 0,875 0,85 0,85 0,87 0,88 0,27 0,27 0,15 0,27 0,125 0,15 0,125 0,15 0,15 0,13 0,12 0,39* 0,39 0,25 0,39 0,22 0,25 0,22 0,25 0,26 0,23 0,21 U12627 (3’UTR) 7 88 199 208 251 K S R V 0,62 0,5 0,26 0,57 0,38 0,5 0,74 0,29 0,14 0,47* 0,5 0,39* 0,58* E01557 (3’UTR) 2989 R 0,98 0,02 0,04 E08096 (3’UTR) 1350 R 0,73 0,27 0,39* AF034974 (3’UTR) 1 848 864 994 2284 R Y R R 0,62 0,79 0,74 0,27 0,38 0,21 0,26 0,73 0,47* 0,33* 0,39* 0,4 Y15710 (3’UTR) 2 1420 1486 Y R 0,85 0,86 0,15 0,14 0,25 0,23 AF426435 (5’UTR) 359 390 501 S Y Y 0,17 0,16 0,18 0,83 0,84 0,82 0,28 0,27 0,30* X98558 (5’UTR) 6 1306 1324 1524 R Y Y 0,66 ND 0,65 0,34 ND 0,35 0,451 ND1 0,45 AF020322 (3’UTR) 615 739 Y Y 0,67 0,84 0,33 0,16 0,44* 0,26 AF327369 (3’UTR) 4 1947 Y 0,98 0,02 0,04 AJ000928 (5’UTR) 1189 R 0,97 0,03 0,061
AJ493461 (3’UTR) 12 26 W 1 0 01 AF473820 (3’UTR) 10 171 222 224 339 Y K R Y 0 0,67 0,67 0,04 1 0,33 0,33 0,96 01 0,441 0,441* 0,081 Y16181 (3’UTR) 6 310 R 1 0 01 AF227686 (3’UTR) 8 661 755 1632 1721 Y K W S ND ND 1 0,07 ND ND 0 0,93 ND1 ND1 01 0,131 U70883 (3’UTR) 6 915 1465 2148 R R Y ND ND 0,64 ND ND 0,36 ND1 ND1 0,461* M29939 245 254 278 279 293 294 296 301 308 314 332 339 342 352 353 363 364 368 Y R M R Y R W S W R Y R K M Y Y S Y 0,75 0,94 0,93 0,5 0,64 0,38 0,98 0,98 0,96 0,96 0,62 0,9 0,78 0,89 0,92 0,88 0,81 0,87 0,25 0,06 0,07 0,5 0,36 0,62 0,02 0,02 0,04 0,04 0,38 0,1 0,22 0,11 0,08 0,12 0,19 0,13 0,381* 0,111 0,131 0,51 0,461 0,471 0,031 0,031 0,071 0,071 0,481 0,11 0,341 0,191 0,151 0,221 0,321 0,221 X68247 6 1666 Y 0,45 0,55 0,441* Y16180 6 647 737 861 1489 1776 1811 1929 1970 2767 Y Y M Y K S R Y Y ND ND ND 0,07 0,6 0,58 0,61 0,61 ND ND ND ND 0,93 0,4 0,42 0,39 0,39 ND ND1 ND1 ND1 0,121 0,481 0,491 0,471* 0,471 ND1 AJ251197 4 202 254 384 438 R R Y R 0,47 0,44 0,48 0,47 0,53 0,56 0,52 0,53 0,51 0,491 0,51* 0,51 Legend : M = A or C, R = A or G, W = A or T, S = C or G, Y = C or T, K = G or T, V = A or C or T, V = A or C or G * : SNPs selected 1 : SNP present in GenBank ND: not determined