HAL Id: hal-01471477
https://hal.archives-ouvertes.fr/hal-01471477
Submitted on 13 Feb 2020
HAL is a multi-disciplinary open access
archive for the deposit and dissemination of
sci-entific research documents, whether they are
pub-lished or not. The documents may come from
teaching and research institutions in France or
abroad, or from public or private research centers.
L’archive ouverte pluridisciplinaire HAL, est
destinée au dépôt et à la diffusion de documents
scientifiques de niveau recherche, publiés ou non,
émanant des établissements d’enseignement et de
recherche français ou étrangers, des laboratoires
publics ou privés.
Marie Delaunay, Vincent Godard, Mélina Le Barbier, Annabelle Gilg Soit Ilg,
Cédric Aubert, Anne Maitre, Damien Barbeau, Vincent Bonneterre
To cite this version:
Marie Delaunay, Vincent Godard, Mélina Le Barbier, Annabelle Gilg Soit Ilg, Cédric Aubert, et al..
Geographic Dimensions of a Health Network Dedicated to Occupational and Work Related Diseases.
International Journal of Health Geographics, BioMed Central, 2016, 15, pp.34.
�10.1186/s12942-016-0063-7�. �hal-01471477�
RESEARCH
Geographic dimensions of a health
network dedicated to occupational and work
related diseases
Marie Delaunay
1,2,3, Vincent Godard
2,3, Mélina Le Barbier
4, Annabelle Gilg Soit Ilg
5, Cédric Aubert
1,6,
Anne Maître
1,7, Damien Barbeau
1,7and Vincent Bonneterre
1,6*Abstract
Background: Although introduced nearly 40 years ago, Geographic Information Systems (GISs) have never been used to study Occupational Health information regarding the different types, scale or sources of data. The geographic distribution of occupational diseases and underlying work activities were always analyzed independently. Our aim was to consider the French Network of Occupational Disease (OD) clinics, namely the “French National OD Surveil‑ lance and Prevention Network” (rnv3p) as a spatial object in order to describe its catchment.
Methods: We mapped rnv3p observations at the workplace level. We initially analyzed rnv3p capture with reference to its own data, then to the underlying workforce (INSEE “Employment Areas”), and finally compared its capture of one emblematic occupational disease (mesothelioma) to an external dataset provided by a surveillance system thought to be exhaustive (PNSM).
Results: While the whole country is covered by the network, the density of observations decreases with increase in the distance from the 31 OD clinics (located within the main French cities). Taking into account the underlying work‑ force, we show that the probability to capture and investigation of OD (assessed by rates of OD per 10,000 workers) also presents large discrepancies between OD clinics. This capture rate might also show differences according to the disease, as exemplified by mesothelioma.
Conclusion: The geographic approach to this network, enhanced by the possibilities provided by the GIS tool, allow a better understanding of the coverage of this network at a national level, as well as the visualization of capture rates for all OD clinics. Highlighting geographic and thematic shading zones bring new perspectives to the analysis of occupational health data, and should improve occupational health vigilance and surveillance.
Keywords: Occupational health, Occupational diseases, Surveillance network, Stakeholders, Geographic Information System, Spatial analysis, France
© 2016 The Author(s). This article is distributed under the terms of the Creative Commons Attribution 4.0 International License (http://creativecommons.org/licenses/by/4.0/), which permits unrestricted use, distribution, and reproduction in any medium, provided you give appropriate credit to the original author(s) and the source, provide a link to the Creative Commons license, and indicate if changes were made. The Creative Commons Public Domain Dedication waiver (http://creativecommons.org/ publicdomain/zero/1.0/) applies to the data made available in this article, unless otherwise stated.
Background
The Occupational Health (OH) field is complex because it combines many different types of data (activity sector, occupations, risk exposures, diseases), available at dif-ferent levels (municipalities, activity territories, employ-ment areas, regions, etc.) and from different partners
(insurers, stakeholders, monitoring systems). These mul-tiple sources of data, formalized or not, have always been analysed independently, ignoring in particular the associ-ated geographic dimension (zones of activity).
Even though OH is spatially determined, linked to the location of particular sectors of activity, only a few papers have addressed it. Although the use of the Geo-graphic Information System (GIS) was discussed in stud-ies describing the spatial distribution of some activity sectors and work related problems [1–4], very few papers have followed [5].
Open Access
*Correspondence: VBonneterre@chu‑grenoble.fr
6 Occupational Health Department, CHU Grenoble‑Alpes
(Grenoble Teaching Hospital), 38043 Grenoble, France Full list of author information is available at the end of the article
Very recently a “proof of concept” paper [6] showed that the use of GIS was a useful way to integrate, ana-lyse and present OH data, from a national to a local level (macro approach), but also within a single workplace (micro approach). This article discussed how these meth-ods and the maps derived from them could be useful for clinicians, epidemiologists, prevention stakeholders, and surveillance authorities. For a better assessment of the importance of occupational diseases within a specific territory, it is necessary to take into account the under-lying active worker population (“denominator”) and its distribution according to activity sectors. As an example the authors started to map the active population in one specific sector of activity of concern (workplaces and the number of salaried workers in each). To give perspective, further steps identified were to generalize this approach to the whole active population, and to use denominator figures to calculate and map complementary information such as the expected number of occupational diseases, and indicators comparing observed cases and expected number of cases. When a data source is not expected to be exhaustive in its capture (preventing the calculation of incidence rates) such indicators could still be very use-ful to: (1) describe the catchment area of health provid-ers specializing in the diagnosis and care of occupational diseases, (2) highlight preferential referral zones and surrounding zones, (3) compare the capture rate from several data sources. For this purpose, the denomina-tor information needed to be refined. The units previ-ously used were most often administrative divisions, but these were not the most accurate ones for this new pur-pose. In France, data regarding economic activities are given using a specific entity known as the employment area (EA). This entity was created in 1983 by the French National Institute of Statistics and Economic Studies (INSEE), and last updated in 2010 [7]. This subdivision had to be considered when comparing data regarding workers (“denominator”) and their health (“numerator” of occupational diseases).
In France, all 31 Occupational Disease Clinics (OD Clinics) are located in university hospitals and are part of the French National Occupational Diseases Surveillance and Prevention Network (rnv3p) [8] whose main objec-tives are to describe work situations at risk for specific occupational diseases (OD) and work-related diseases (WRD) (which are not embedded in a list entitling rights for compensation), and to seek new and emerging risks [9]. For more simplicity, WRD and OD are summarised in the “OD” concept in this paper. Analyses of rnv3p net-work data have been mostly done either on cumulated studies (looking for new rare diseases) [10], or taking the time dimension into account [11]. Apart from the map of the OD Clinics (Fig. 1), and the recent previously cited
article [6], no analysis has been done to represent and understand the spatial aspect of rnv3p observations and of the related variables (patients addresses, workplace addresses, and the referring physician’s address).
The aim of the present study was to consider the French National Occupational Diseases Surveillance and Preven-tion Network as a spatial object and to describe its catch-ment (preferential catchcatch-ment areas, surrounding zones). To achieve this, we defined three stages. The first was to describe the rnv3p network and the data it collected. The second was to analyse the rnv3p data with reference to the underlying workforce (denominator) in the employment areas. The third stage was to analyse rnv3p catchment of a well-known occupational disease (mesothelioma), in ref-erence a data source thought to be exhaustive.
Methods
The whole study process is described in Fig. 2, detailing the three data sources, the periods, geographic scales and subsets considered, and the methods used to answer the 3 objectives.
In order to meet our first objective (an approximate description of rnv3p catchment), we studied the rnv3p observations for the 2001–2012 period at the level of each workplace considered as “responsible” for at least one case of an occupational disease, and then local-ized it according to municipality. OD Clinics collect four main categories of data, presented in four differ-ent tables: “Patidiffer-ent” (anonymized iddiffer-entification codes, age, sex, and address), “Workplace” (anonymized iden-tification code, activity sector, and address), “Consul-tation” (date of consultation, referring physician and their address, etc.) and “Problem” (disease, exposures and their degree of imputability with respect to the dis-ease, occupation, work station, etc.). For information, the workplace is rated as “responsible” of the disease, if the level of attributability assessed by the OD specialist physician is high, taking into account the type of disease, partient’s past medical history, patient’s history of occu-pational exposures (nature, duration), estimated levels of exposures, the chronology of the appearance of the dis-ease, and previous medical knowledge. These tables are summarized in a single table of “Observations”, available nationally, without any possibility of direct identification of the patient or their workplace. Nevertheless, this table, which is usually used for data analysis, includes patient and workplace codes. We choose to localize the observa-tions at the address of the workplace rather than to the patient’s address, as this was of greater interest in terms of surveillance and subsequent prevention. To match the address of the workplace to the observation, we had to consecutively link the different tables. Firstly, “Observa-tions” and “Patients” were merged in order to extract the
workplace identity codes. Secondly, “Observations” and “Workplace” were merged to find the addresses of the workplaces (postal code and city). When the observation
was enriched with location information, we used a corre-sponding table [12] that matched the postal code and city with the name of the municipality.
Databases Period
D
A
T
A
P
R
O
C
E
S
S
A
N
A
L
Y
S
I
S
Objec ves Methods Type Sources Merging and spa al joining 1. rnv3p raw catchment • Thiessen polygons • Standard Devia on Ellipses • DensityWork-Related Diseases
“rnv3p”: French network for occupa onal diseases preven on and vigilance network
- Workplaces address - Pa ents address
All Rnv3p observa ons located at the workplace level (n=100,597)
3. rnv3p catchment regarding mesothelioma Epidemiological collec on (Mesothelioma disease) “PNSM”: French Na onal Mesothelioma Surveillance Program 22 Pa ents’ coun es of residence 2. rnv3p catchment regarding the underlying workforce • Expected cases are
calculated, for each EA, according to the underlying ac ve popula on, and its distribu on by ac vity sector
• Observed cases are then compared to expected ones and ra os are mapped
French ac ve popula on
« Employment Area (EA) 1998-2012 »
304 French Employment Areas (EA)
Rnv3p data was merged with INSEE data by Employment Area (EA) and Na onal ac vity codes (NAF), thanks to 2 corresponding tables (communes <-> EA, and NAF 2003 <-> NAF 2008)
ANSES(French agency for health safety
in food, environnement and work) INSEEsta s cs and economic studies)(French ins tute of Santé Publique France (French agency for Public Health)
Mesothelioma cases (rnv3p and PNSM) were merged at county level, and according to their rela on with occupa onal asbestos exposure.
Subset 1
All Mesothelioma cases inves gated by rnv3p network (2001-2012), and located at pa ent address (n=1178)
Subset 2.1
*Coun es for which the PNSM program was not effec ve during all the 2008-12 period were dropped
Merging and spa al joining
Mean total of French workers:
n=26,010,960 Mesothelioma cases:n=1718
Subset 2.2 rnv3p mesothelioma cases
2008-2012 specified by pa ent address and sex (n=285)
PNSM mesothelioma cases 2008-2012 specified by pa ent address and sex (n=1718). Considered as a gold-standard.
Geographic scale
2001-2012 2001-2012 2008-2012*
Size Total number of observa ons: n=162,526
• Calcula on of the ra os of rnv3p mesothelioma cases over PNSM cases, by coun es, occupa onal asbestos exposure, and sex
Spa al representa on
Fig. 2 Summarized methodology for the highlightment of French OD clinics preferential recruitment zones. rnv3p French National Occupational Diseases Surveillance and Prevention Network, INSEE French National Institute of Statistics and Economic Studies
Three main tools were used to describe the rnv3p data: density, standard deviation ellipse and Thiessen polygons [13]. Rather than simply mapping cases with points, the density is a raster which depicts the concentration of cases, and allows a better visualization of their distribu-tion. Our chosen representation corresponds to a raster with 500 × 500 grid size which ignores administrative boundaries. Since data were located by municipality, a core density tool was applied, the weighting being the number of superposed observations in the same location. From each observation point, the density tool applied a concentric search for other observations within a 10 km radius. Standard deviation ellipses (SDE) were used to summarize the central tendency, dispersion and direc-tional trends of observations made by each OD Clinic. They identify an area comprising 68 % of their tion. For this reason, ellipses only give relative informa-tion, without any information on the actual number of total observations seen by each clinic. Ellipses might have a larger radius for OD Clinics that have a low number of observations if some of these are located far away from the clinic. In order to include quantitative information useful for interpretation on some of the maps we have added circles proportional to the number of observations recorded by each OD Clinic. Thiessen polygons are a way of representing a purely theoretical preferential recruit-ment area around clinics. They are totally independent of the real spatial distribution of the observations. They are generated from a set of points (here all OD Clinics) so that any location inside the polygon is closer to that point than any of the other sample points [13].
To achieve our second objective (description of rnv3p data in terms of the underlying workforce), we used data from INSEE on the distribution of five main activity sec-tors (agriculture, construction, industry, commerce and non-commercial services) at the employment area level (Metropolitan France being partitioned in 304 “employ-ment areas”). The first step was to update the national activity codes in the rnv3p observation tables in order to be comparable to the denominator of the data source. As the INSEE data used the 2008 national activity codes (NAF code) whereas the rnv3p data used the 2003 NAF codes for the period (2001–2012), a merged table [14] between NAF 2003 and 2008 codes was used. The distri-bution of communes within the 304 employment areas was then used [7]. The second step was to combine data belonging to the same employment areas, in order first to represent the rate of OD per 10,000 workers. Finally, a rate based on the ratio between numbers of rnv3p observed OD and expected OD was calculated for each employment area. The expected number of observations is an estimate taking into account the number of employ-ees by employment area for each activity sector and the
average rate of diseases attributed to this sector by the rnv3p nationally. Assuming a homogeneous distribu-tion of disease within the same activity sector, for each of the five sectors considered this indicator gave a rate of OD by employment area. To calculate a national OD rate for each sector, we took into account: the total num-ber of OD per sector, the average numnum-ber of employees in this sector for the period concerned (12 years, from 2001 to 2012). This national OD rate was then applied to each geographic unit. Depending on the number of employees, the rate calculated the number of expected OD, which enabled us to identify areas with “over” and “under” detection of OD in the rnv3p network. To express this rate, a classification according to standard deviation was chosen. Indeed, this allows one to show the difference between the rate found for each employment area and the average of the rate, by expressing this differ-ence in terms of fractions of the standard deviation of the mean value. Class interruptions were taken with equal ranges and proportional to standard deviation.
Our third objective was to compare the rnv3p data with that from another data source for a given occupa-tional disease. As an example, we chose mesothelioma for the following reasons: the French National Mesothe-lioma Surveillance Program (PNSM) is a large scale epi-demiological surveillance system based on some French counties (“départements”) [15, 16] and this disease is mostly due to occupational exposure to asbestos [17]. PNSM data were only available for the patients’ loca-tion and were merged by county. We consider the coun-ties for which the PNSM was still active in 2012 (n = 22), and made the comparison with rnv3p for a period of 5 consecutive years (2008–2012). Under the hypothesis that the PNSM identification of mesothelioma cases is exhaustive on these departments, we estimated the rnv3p catchment rate of this disease by counties. Cases related to either para-occupational exposure or environmental exposures were excluded. While PNSM only identifies pleural mesothelioma, it was not possible to automati-cally differentiate pleural from peritoneal mesothelioma in the rnv3p data as they are indexed using the same ICD10 code. For this reason, all rnv3p mesothelioma cases were considered. Nevertheless, as the proportion of peritoneal cases is low (8 %, [18]), it was assumed this would not significantly alter the comparison of capture rates between the different OD Clinics.
Two analyses were conducted successively. The first one compared the catchment of all mesothelioma (at patients’ addresses) by the two sources rnv3p and PNSM (subset 2.2 mentioned in Fig. 2). Secondly, only cases for which occupational asbestos exposure was considered as the probable cause of the disease were analysed for both rnv3p and PNSM. Regarding PNSM, only 75 % of the
men and 76 % of the women could undergo an enquiry to determine asbestos exposure (with differences across départements). It was assumed that, at the department level, the proportion of occupationally related mesothe-lioma was equivalent in the patients that could be inter-viewed, and in the remaining ones. This was modelled as follows. For instance, for the Manche Département, 48 mesothelioma cases were identified by PNSM among males, 21 of them (44 %) undergo an enquiry regarding asbestos exposure, of which 18 (86 %) were considered as related to occupational asbestos exposure; 27 could not be interviewed. The total expected number of mesothe-lioma cases related to occupational asbestos exposure according to PNSM in the Manche département was cal-culated as the sum of the ones with a positive result of the enquiry (n = 18), and of the number of mesothelioma expected to be related to occupation in the 27 remain-ing subjects (n = 27 × 0.86 = 23), which means a total of n = 41.
Results
Regarding the geocoding process for the Observation table, information has been lost at two successive levels. Firstly when merging the “Observation” and “Patient” tables: only 110,578 of the 162,526 observations could be linked to a workplace. This is partly due to the fact that for retired people who came for the investigation of chronic diseases (such as cancers), it was not possible to record previous company where they were exposed. The second one was in matching the municipality (commune, the smallest French administrative division) address: only 100,597 out of 110,578 observations could be matched. Table 1 summarizes the information lost in the three tables of interest (Patient, Workplace and Observations) and indicates the rate of concordance for each of them.
Since the geocoding process was based on match-ing tables in which geographic information was already listed, 98.7 % of our data (n = 100,597) linked to a work-place and having an address were successfully geolocated.
This means they had a score of 100 indicating a perfect match, an A match (automatically matched) and an M status (the address is matched). Nevertheless, there are important differences in the percentage of geolocated observations between the different OD clinics (from 11 to 93 %) (Table 2). This information should be borne in mind when interpreting the maps.
The 100,597 observations successfully geocoded to the workplace address, mapped by the three following methods (density method, standard deviations ellipses, and Thiessen Polygons) are presented together on Fig. 3. At a first glance, this figure shows an almost complete coverage of the country. Ellipses also show a satisfying distribution of the catchment areas throughout the coun-try. These ellipses are quite similar to the theoretically expected catchment areas shown by the Thiessen poly-gons (“ideal” geometric catchment). When two OD Clin-ics are close (e.g. Dijon and Besançon in eastern France), ellipses are not centered on the clinic, but shifted away from the nearby OD clinic, which also corresponds to the region it belongs to. Regarding Paris region, which has five OD Clinics (Paris Cochin, Hôtel-Dieu, Fernand-Widal, Garches and Créteil), there is superposition of the catchment areas. Secondly, the map clearly highlights that observations are mainly located in cities with OD Clinics and their surrounding areas: ellipses are centred on the OD Clinics, with the highest density of observa-tions at their centre. The zones of few observaobserva-tions are those in between ellipses, which mostly correspond to the peripheral zones of the Thiessen polygons.
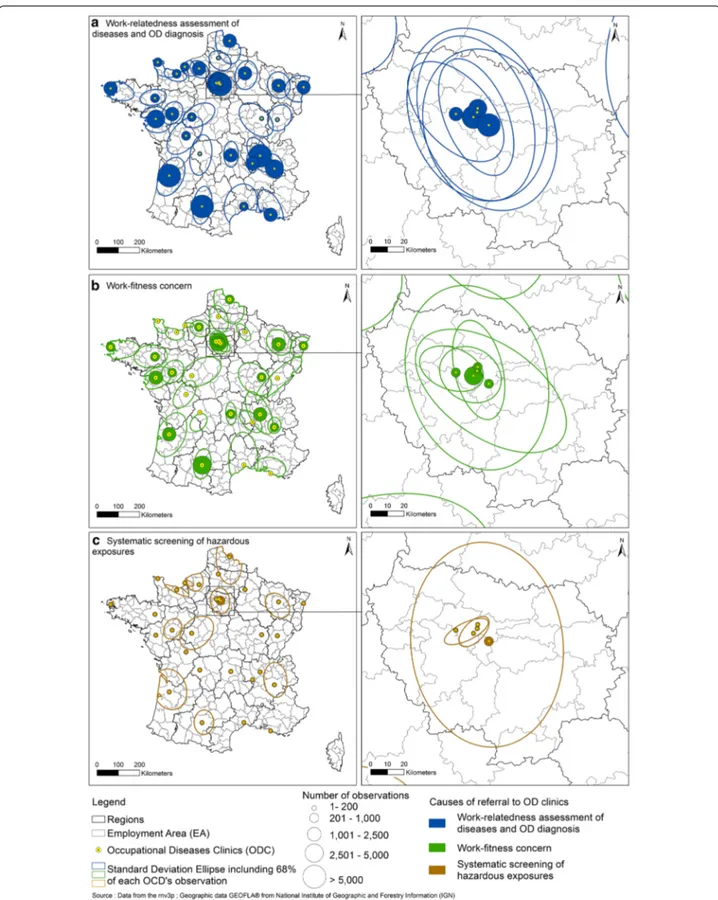
The SDE representation was then used to distinguish spatial observation areas according to the three main causes of referral to OD Clinics (Fig. 4): work-related assessment of disease and OD diagnosis, work-fitness concerns, systematic screening of exposure to hazard-ous substances for a limited number of diseases in hos-pitalized patients (usually lung cancers, but the type of disease screened might vary according to OD Clinic and time period). The assessment of a disease as being
Table 1 Number of geolocated addresses for rnv3p “Observations”, “Patient” and “Entreprises” tables (rnv3p 2001–2012)
a Match rate refers to the percentage of addresses successfully geolocated with reference to the only entries that have one address informed
rnv3p main tables (number of observations) Observations
n = 162,526 Patientsn = 192,281 Workplacesn = 70,916
No link with the workplace (n=) 51,948
Link with workplace (n=) 110,578
Address not recorded (n=) 8667 24,002 4980
Address not found during the geolocalisation process (n=) 1314 16,032 2262
Match ratea (%) 98.7 90.5 96.6
Total number of rnv3p observations located with reference to the primary rnv3p tables (n=) 100,597 152,247 63,674
work-related or a clear OD diagnosis were the main rea-sons for referring patients to OD Clinics. At the single OD clinic level, we can see some highly specific situa-tions, such as that of Limoges (west centre France), based on a relatively small number of geolocated observations (n = 179/total = 291). The ellipse for work-fitness prob-lems is shifted to the south of the city as the probprob-lems were mostly referred to the OD Clinics by occupational physicians employed by companies located south of Limoges (Fig. 4b). A completely different example is that of referral for work-related disease in the Rhône-Alpes region. Until 2012 patients seen in Grenoble OD Clinic for systematic hazardous substances assessment came
from workplaces in a more extended area than for the other reasons of referral. As Table 3 shows, for 16 OD Clinics, the ellipse size is relatively large for the assess-ment of the work-relatedness of diseases and OD diagno-sis. For 13 OD Clinics, the ellipse areas for work-fitness concerns are relatively large. For 2 OD Clinics (Creteil and Grenoble), ellipse size is greatest for systematic screening of hazardous exposures. Regarding referral to OD Clinics in Paris and its surrounding area (called the “Ile de France”), the “systematic screening of exposure to hazardous substances” issue is the only reason for refer-ral that displays a very large differences in capture areas. This is because the Creteil OD Clinic is a specialist centre in the systematic screening of patients presenting with lung cancer (Fig. 4c).
In order to take into account the fact that the main cities and suburbs are associated with the greatest den-sity of active workers, Fig. 5 describe the catchment areas taking into account the number of active workers in each employment area (rate of rnv3p observations with the total number of active workers in the ment area as denominator). 297 of the 304 employ-ment area had cases recorded within rnv3p. There were no rnv3p observations for seven employment areas of which five are located in the island of Corsica that has no OD Clinic. The two other areas for which there were no observation are “Issoudun” (central France) and “Menton—Vallée de la Roya” (south-eastern France, at the Italian border) that had an average num-ber of active workers in the 2001–2012 period of 9319 and 20,221 respectively. Overall, the mean number of OD per 10,000 workers catched by OD clinics for the period considered is 23,4/10,000 workers. Nevertheless, variance is very important (standard deviation = 26, minimum = 0.5, maximum = 198). The nine employ-ment areas corresponding to the highest part of the distribution (>2.8 deviation standard), are in decreas-ing order: Lunéville near Nancy (198.2 rnv3p obser-vations per 10,000 workers), Le Havre (rate = 156.9), Toulouse (rate = 149.5), Bordeaux (rate = 142.2), Brest (rate = 118.9), Grenoble (rate = 115.3), Nancy (rate = 109.9), Créteil (rate = 102.3) and Clermont-Fer-rand (rate = 97.5). Most of these employment areas coa-lesce with neighbouring employment areas and show a decreasing rate of observations with increasing distance from the OD clinic. However, employment area with the highest catchment rate are sometimes adjacent to some with the lowest catchment rate (such as Clermont-Fer-rand employment zone and the nearby zones of Gueret and Ussel which have capture rate of 2.7 and 3.2 per 10,000 workers). As for Bordeaux, the administrative regional boundary (black line) seems to act like a bar-rier to referral from the adjacent region. Finally, where
Table 2 Geolocated observations for each French OD clinic (rnv3p 2001–2012)
OD Clinics Total of
observations Observations linked to the workplace Observations geolocated Amiens 564 213 122 (22 %) Angers 2652 2456 2386 (90 %) Besançon 487 342 277 (57 %) Bordeaux 14,269 10,639 9626 (67 %) Brest 5514 3239 3118 (57 %) Caen 6322 956 723 (11 %) Cherbourg 2121 754 551 (26 %) Clermont 3425 2997 2942 (85 %) Cochin 13,790 12,548 12,365 (90 %) Créteil 12,194 7759 7519 (62 %) Dijon 564 485 459 (81 %) Fernand 5921 5582 5471 (92 %) Garches 10,082 2190 1816 (18 %) Grenoble 7668 4928 4854 (63 %) Hôtel‑Dieu 752 661 544 (72 %) Le Havre 4557 2576 2442 (54 %) Lille 10,212 5306 3844 (38 %) Limoges 291 194 179 (62 %) Lyon 12,751 7848 7464 (58 %) Marseille 2121 1765 1573 (74 %) Montpellier 861 603 560 (65 %) Nancy 6129 5599 4725 (77 %) Nantes 9902 8876 5666 (57 %) Poitiers 894 834 814 (91 %) Reims 3227 1268 1151 (36 %) Rennes 1561 1194 1182 (76 %) Rouen 4573 2245 2121 (46 %) Saint‑Etienne 2369 2219 2127 (90 %) Strasbourg 3641 2536 2431 (67 %) Toulouse 11,176 10,487 10,392 (93 %) Tours 1936 1279 1153 (60 %) Total 162,526 110,578 100,597 (62 %)
ellipses overlap (employment areas with two OD Clin-ics) there does not appear to be better capture of obser-vations. In fact, these employment areas often show an
observation rate which is intermediate between those of the nearby cities in which OD Clinics are located (e.g. Angers-Nantes; Lyon-Grenoble).
Fig. 3 Spatial distribution of rnv3p OD Clinics observations. OD clinics Occupational Diseases Clinics. The density is represented by a blue scale, directional distribution are appreciated by standard deviation ellipses (red), and theoretical recruitment area based on geometric calculation through Thiessen polygons (green)
Fig. 4 Catchment areas of OD Clinics according to the main cause of patient referral: work‑relatedness assessement of diseases and diagnosis of OD (a), work‑fitness concern (b), systematic screening of hazardous exposures (c). Circles are proportional to the number of observations, and stand‑ ard deviation ellipses show the main geographical catchment area for each OD clinic. OD clinics occupational diseases clinics
Regarding the industrial sector (manufacturing, min-ing, chemical industry, metallurgy and metal work etc.), it appears that this activity is more concentrated in the northern half of France, whereas the Mediterranean perimeter has a relatively low percentage of industrial workers (Fig. 6). The majority of the employment areas with the highest concentrations of active industrial workers are small. Here, the number of observed cases over the number of expected ones has been studied to highlight employment areas with more referrals than the average. In general the rnv3p pattern of observation
for industrial sectors is in line with what has been previ-ously described, but with some exceptions. The employ-ment area with the highest capture rate of OD among industrial workers are Bordeaux (and some neighbour-ing zones), Toulouse, Grenoble, Nancy, Brest and three zones in Ile de France region. All these employment area have an OD clinic. We notice that, except for Toulouse, none of these OD clinics belong to the highest class regarding the percentage of geocoded information (the information mapped doesn’t only translate the amount of available information). None of these employment
Table 3 Ellipse size (in km2) accounting for 68 % of observations around each OD Clinic according to the main cause
of patient referral
Metropolitan France area = 551,500 km2
OD Clinics Observations Assessment of work-
relatedness of diseases and OD diagnosis
Work-fitness concerns Systematic screening
of exposure to hazardous substances
Number Ellipse size
(km2) Number Ellipse size (km2) Number Ellipse size (km2) Number Ellipse size (km2)
Amiens 122 11,818 107 7262 10 8594 0 – Angers 2386 7848 1279 7988 314 8503 73 6192 Besançon 277 14,269 200 10,442 50 16,475 0 – Bordeaux 9626 16,945 7313 17,222 1083 21,267 143 20,457 Brest 3118 15,051 2233 8209 213 9955 5 87 Caen 723 4385 422 4518 122 3871 9 2546 Cherbourg 551 7392 366 4801 13 2674 1 – Clermont‑Ferrand 2942 5987 2318 6590 555 4046 0 – Cochin 12,365 6083 7754 5216 3470 7267 7 208 Créteil 7519 6205 5797 5934 410 4444 233 8702 Dijon 459 18,421 192 17,964 262 17,531 0 – Fernand‑Widal 5471 7272 4233 6610 492 1359 0 – Garches 1816 2033 1340 2286 232 769 0 – Grenoble 4854 6889 3427 7542 811 3656 108 14,015 Hôtel‑Dieu 544 1794 349 2159 105 952 6 237 Le Havre 2442 2936 928 3604 58 766 95 891 Lille 3844 11,245 1908 12,023 663 14,232 145 13,823 Limoges 179 19,141 156 15,367 9 4914 1 – Lyon 7464 13,484 5547 12,641 1521 16,572 8 – Marseille 1573 11,705 1263 10,293 100 8937 0 – Montpellier 560 19,233 451 17,823 92 20,667 0 – Nancy 4725 11,669 2218 10,424 1702 10,956 37 10,104 Nantes 5666 16,799 4001 12,854 1163 9809 0 Poitiers 814 17,965 640 20,041 90 9418 2 Reims 1151 10,956 1037 11,042 70 3430 3 Rennes 1182 10,260 307 7122 530 13,191 1 Rouen 2121 5606 1140 5344 662 5330 11 5073 Saint‑Etienne 2127 4074 1698 3649 181 7342 9 Strasbourg 2431 9225 1196 9685 512 5527 1 Toulouse 10,392 11,621 5327 12,517 3776 9094 49 8359 Tours 1153 14,552 780 12,609 114 18,492 125 18,356 Total 100,597 311,994 65,927 291,801 19,385 270,067 1072 109,053
areas belong to those having the highest proportion of industrial workers; six of them are even in the lowest quintile.
Finally, in order to take into account the five broad categories of occupational activities (agriculture, con-struction, industry, commerce and non-commercial
Fig. 5 Rate of rnv3p observations per 10,000 workers from all activity sectors (employment areas level). Sources rnv3p data 2001–2012; INSEE data for the average number of active workers on the same period (INSEE: French National Institute of Statistics and Economic Studies)
services), the ratios of observed versus expected OD for each category of activity was calculated and mapped for each employment area. This map (Additional File 1: Fig. S1) was exactly similar to the one of the rate of OD per employment areas (Fig. 5), which means the pattern of recruitment was not substantially modified by the dis-tribution of activities across employment areas.
Another issue is the type of diseases in a given activity sector that are investigated by the OD Clinics and which could lead to qualitative differences in observations. Table 4 shows the typology of OD attributed to work (according to the first ICD-10 digit) in industrial sec-tor for the 11 employment areas with the highest catch-ment. Overall, there is a predominance of lung diseases (31 %) and psychiatric disorders (19 %), followed by eyes and ears diseases (12 %), dermatological diseases (10 %) and musculoskeletal disorders (10 %), but there are stark differences between OD Clinics, according to the exact nature of the medical supply and expertise they were able to develop.
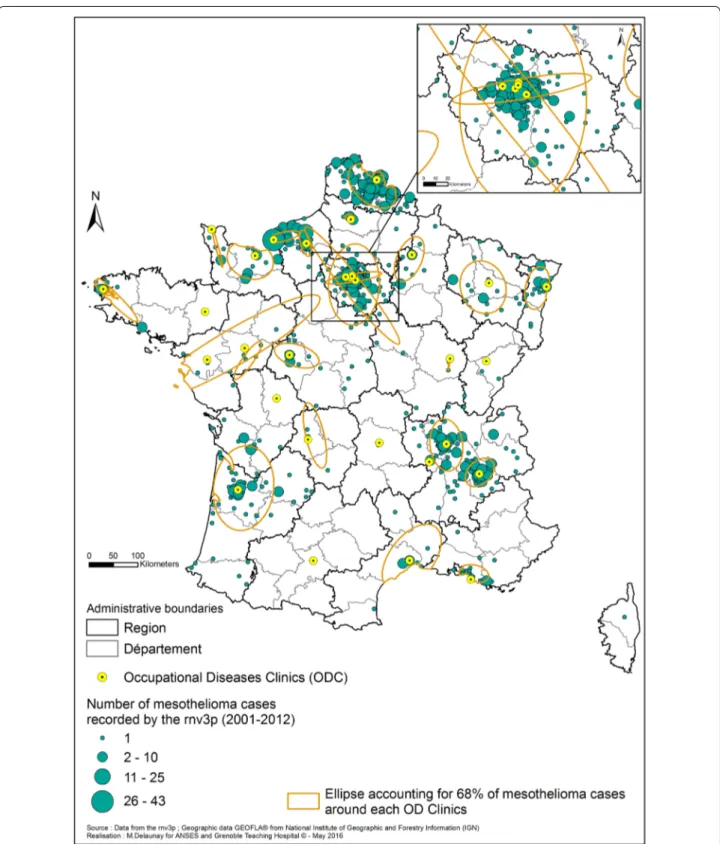
Regarding mesothelioma, we first mapped the 1178 cases recorded by the rnv3p for the 2001–2012 period at the county (département) level (Fig. 7). Most of the cases investigated in OD clinics came from 11 of the 96 “départements” of mainland France. Most of them are located in the Northern part of France (Seine Maritime where Rouen OD clinic is located, Nord and Pas de Cal-ais mostly captured by the Lille OD clinic, and cases from the Ile de France region captured by OD clinics in the Paris area). Three “départements” with a relatively high number of mesothelioma cases recorded by the rnv3p are located in the southern half of France (Gironde by the Bordeaux OD clinic, and Isère and Rhône in the Rhône-Alpes region, by the Grenoble and Lyon OD clinics).
We then compared, for the same 2008–2012 period, the number of all mesothelioma cases recorded by the epidemiological source considered as the gold standard (PNSM, total = 1718) and by the rnv3p (total = 285 cases), by “département” and sex (Table 5). Both sources had a sex-ratio of 0.3 (number of females’ cases over number of males’ cases). In 5 départements out of 22, no males’ cases have been reported in rnv3p, whereas the inverse situa-tion is encountered in 13 départements. The global rnv3p catchment rate for this disease (PNSM taking as a refer-ence) is 17 % for males and 15 % for females, with strong variations between counties showing a strong OD clinic effect (from 0 to 44 and 59 % respectively for females’ and males’ cases, with the highest value associated to Val de Marne). For each clinic, there is usually a wide dis-crepancy between the capture rates of males’ cases and females’ cases. Usually the capture rate of female’s cases for all mesothelioma, is lower than the one for males’ cases,
except for 3 départements: Gironde (34 % for women vs 19 % for men), Seine-Saint-Denis (21 vs 11 %), and Calva-dos (24 and 3 % respectively, but based on a lower number of cases). Then, the rnv3p mesothelioma capture rate was assessed considering only the cases for which an occupa-tional asbestos exposure was certified and considered as the probable cause of the disease (Table 6 for males and Table 7 for females). Regarding males’ cases, the catchment rate did not change globally (191/1107 = 17 %), and the variations in each OD clinics were very limited. Neverthe-less, considering women’s cases, the catchment rate raised from 15 to 47 % when considering the subset of cases for which the disease was attributed to occupational asbestos exposure (24 cases for rnv3p, and 51 for PNSM). In Calva-dos 5 cases have been captured by rnv3p over 7 cases for PNSM. Moreover, in Isère and Val-de-Marne, more cases have been related to an occupational exposure to asbestos within rnv3p than within the PNSM (n = 6 vs 4, and 4 vs 3 respectively). We got the confirmation by checking the medical reports that these female cases were occupation-ally related, and not para-occupational. Again, these analy-ses show a strong OD clinic effect.
Figure 8a1, a2, b1, b2 shows the geographical distri-bution of capture rate of rnv3p compared to PNSM for men and women, for all mesothelioma and the subset of mesothelioma attributed to occupational asbestos exposure. The maps highlight the fact that the capture of mesothelioma cases by rnv3p is very low in the south-ern counties covered by PNSM, with two notable excep-tions, namely Isère where Grenoble OD clinic is located, and Gironde with Bordeaux OD clinic and the nearby Dordogne county. The higher the distance with an OD clinic, the lower is the catchment rate (see for instance Alpes Maritimes at the Italian border) or Corsica. The highest catchments are reached in the Paris area (Val de Marne where the Creteil OD clinic located), Seine Mari-time county (where Rouen and Le Havre OD clinics are located), whereas the catchment in the neighboring Nor-mandie counties remains several times lower (Manche where Cherbourg OD clinic is located, Calvados, and Orne). In the Eastern France, the catchement is also 3 times higher in the county where Strasbourg OD clinic is located (Bas Rhin), than in the neigbouring county with no OD clinic. To the contrary some area surrounding OD clinics (such Loire Atlantique with Nantes OD clinic, and Bouches du Rhône with Marseille OD clinic) have a low catchment of mesothelioma cases, as their main activ-ity is dedicated to other medical issues. Figure 8a2, b2 clearly highlights a highest rnv3p capture rate for female’s cases for which occupational asbestos exposure was iden-tified and considered as the probable cause of the disease, in 4 départements.
Fig. 6 Distribution of Industrial workers in France, and employment area with higher catchment of OD by OD clinics network. OD occupational diseases. Employment rates in the industrial sectors are shown by depth of purple (at the employment areas level), and occupational diseases (OD) reported to the rnv3p by OD Clinics (number of observations) are reported to the expected number (coloured boundaries; highest recruitment zones: red‑hatched). Sources rnv3p 2001–2012, and French National Institute of Statistics and Economic Studies (INSEE)
Table 4 T yp olo gy of oc cupa tional diseases (ac cor ding t o first ICD -10 digit) in vestiga ted b y the F rench OD C linics r egar ding the industr y sec tor , f or the ele ven emplo ymen t ar
eas with the highest c
at chmen t Per cen tages ar e pr esen ted b y lines . A and B: c er tain inf ec
tious and par
asitic diseases; C: neoplasms; D: diseases of the blood and blood-f
or ming or gans and c er tain disor ders in
volving the immune sy
st
em; E: endocr
ine
,
nutr
itional and metabolic diseases; F
: men
tal and beha
viour
al disor
ders; G: diseases of the ner
vous sy
st
em; H: diseases of the ey
e, adne
xa, ear and mast
oid pr
oc
ess; I: diseases of the cir
cula tor y sy st em; J: diseases of the r espir at or y sy st em; K
: diseases of the digestiv
e sy
st
em; L: diseases of the sk
in and subcutaneous tissue; M: diseases of the musculoskeletal sy
st
em and c
onnec
tiv
e tissue; N: diseases of the genit
our inar y sy st em; R: sympt oms , sig ns and abnor
mal clinical and labor
at or y findings , not elsewher e classified; S and T: injur y, poisoning and c er tain other c onsequenc es of e xt er nal causes; U: c odes f or special pur poses; Z: fac tors influencing health sta tus and c on tac
t with health ser
vic es Emplo ymen t zone A ll obser va tions (industr y sec tor) Obser va tions r ela ted to w ork -r ela tedness assessmen t Subset of obser va tions f or
which disease is associa
ted t o oc cupa tional e xposur e with str ong imputabilit y First dig it of the ICD -10 c ode (main ca tegories) B C D E F G H I J Bor deaux 1627 1173 470 5 % 37 % 4 % 5 % 1 % 20 % Br est 537 317 191 3 % 14 % 3 % 5 % 53 % Cr ét eil 288 214 143 2 % 13 % 3 % 8 % 1 % 40 % Gr enoble 1250 937 572 5 % 1 % 5 % 1 % 13 % 1 % 45 % La T est e‑ de ‑Buch 84 50 20 20 % 5 % 55 % Le Ha vr e 1225 499 165 5 % 1 % 2 % 5 % 1 % 75 % Nanc y 659 303 173 6 % 6 % 14 % 2 % 4 % 29 % Nemours 54 36 17 6 % 6 % 12 % 6 % 6 % 47 % Or ly 328 243 130 1 % 6 % 1 % 22 % 4 % 10 % 29 % Pauillac 17 15 6 33 % 17 % Toulouse 1610 1021 774 25 % 5 % 21 % 10 % Total 7679 4808 2661 2 89 24 3 500 86 310 13 821 Emplo ymen t zone A ll obser va tions (industr y sec tor) Obser va tions r ela ted to w ork -r ela tedness assessmen t Subset of obser va tions f or which disease is associa ted t o oc cupa tional exposur e with str ong imputabilit y First dig it of the ICD -10 c ode (main ca tegories) K L M N R S T U Z Bor deaux 1627 1173 470 8 % 14 % 2 % 2 % 1 % Br est 537 317 191 10 % 2 % 2 % 1 % 1 % 8 % Cr ét eil 288 214 143 1 % 12 % 13 % 4 % 1 % 1 % Gr enoble 1250 937 572 1 % 10 % 5 % 6 % 1 % 3 % 2 % La T est e‑ de ‑Buch 84 50 20 5 % 15 % Le Ha vr e 1225 499 165 5 % 1 % 1 % 1 % 1 % 1 % 2 % Nanc y 659 303 173 17 % 11 % 1 % 2 % 3 % 4 % Nemours 54 36 17 6 % 6 % 6 % Or ly 328 243 130 12 % 6 % 1 % 2 % 3 % 3 % Pauillac 17 15 6 33 % 17 % Toulouse 1610 1021 774 11 % 16 % 3 % 3 % 6 % Total 7679 4808 2661 8 274 272 4 86 2 46 39 82
Table 5 A ll mesothelioma c ases iden tified b y PNSM and rn v3p f or the 2008–2012 p erio d, b y “dépar temen t” and se x PNSM F rench Na tional M esothelioma Sur veillanc e P rog ram («P rog ramme Na tional de Sur veillanc e du M esotheliome»), Rn v3p F rench Na tional O ccupa
tional Diseases Sur
veillanc e and P rev en tion Net w or k («R éseau Na tional de Vig ilanc e et de P rév en tion des P atholog ies P rof essionnelles»), M males , F F emales , sex -r atio F/M Coun ties iden tifica tion
(number and name of F
rench «dépar temen ts») A ll M ésothélioma (2008–2012) PNSM rn v3p rn v3p ca tchmen t r at e (%) M F Total Se x-r atio M F Total Se x-r atio M F Total 06—Alpes M ar itimes 60 32 92 0,5 0 0 0 – 0 0 0 13—Bouches ‑du ‑R hône 182 40 222 0,2 2 0 2 0 1 0 1 14— Calvados 37 25 62 0,7 1 6 7 6 3 24 11 24—D or dog ne 19 14 33 0,7 6 0 6 0 32 0 18 25—D oubs 14 3 17 0,2 2 0 2 0 14 0 12 2A—Haut e‑ Corse 5 1 6 0,2 0 0 0 – 0 0 0 2B— Corse du Sud 8 2 10 0,3 0 0 0 – 0 0 0 33— Gir onde 103 32 135 0,3 20 11 31 0,6 19 34 23 38—Isèr e 95 28 123 0,3 34 9 43 0,3 36 32 35 40—Landes 23 9 32 0,4 0 0 0 – 0 0 0 44—L oir e‑ A tlantique 133 24 157 0,2 1 0 1 0 1 0 1 47—L ot ‑et ‑G ar onne 12 3 15 0,3 0 0 0 – 0 0 0 50—M anche 48 13 61 0,3 5 0 5 0 10 0 8 61— Or ne 26 7 33 0,3 2 0 2 0 8 0 6 64—Pyr énées ‑A tlantiques 34 11 45 0,3 1 1 2 1 3 9 4 67—Bas ‑R hin 43 11 54 0,3 18 2 20 0,1 42 18 37 68—Haut ‑R hin 23 5 28 0,2 3 0 3 0,0 13 0 11 76—S eine ‑M ar itime 161 57 218 0,4 74 12 86 0,2 46 21 39 80—S omme 23 9 32 0,4 5 1 6 0,2 22 11 19 83— Var 126 26 152 0,2 1 0 1 0,0 1 0 1 93—S eine ‑Saint ‑D enis 64 24 88 0,4 7 5 12 0,7 11 21 14 94— Val ‑de ‑M ar ne 71 32 103 0,5 42 14 56 0,3 59 44 54 Total 1310 408 1718 0,3 224 61 285 0,3 17 15 17
Table 6 M ales ’ c ases of M esothelioma a ttribut ed t o o ccupa tional asb est os e xp osur e, f or PNSM and rn v3p , b y dépar temen t and se x (2008–2012) PNSM F rench Na tional M esothelioma Sur veillanc e P rog ram («P rog ramme Na tional de Sur veillanc e du M esotheliome»), Rn v3p F rench Na tional O ccupa
tional Diseases Sur
veillanc e and P rev en tion Net w or k («R éseau Na tional de Vig ilanc e et de P rév en tion des P atholog ies P rof essionnelles»), M males , F females , sex -r atio F/M, NA not a ttr ibut ed Coun ties iden -tifica tion (num
-ber and name of F
rench « dépar temen ts») rn v3p PNSM rn v3p ca tchmen t ra te of males ’ mesothelioma cases a ttribut ed to oc cupa tional asbest os e xposur e C = W Rrn v3p / WR PNSM × 100 W ork -r ela ted
males cases among rn
v3p
(WR
rn
v3p
)
Total of males cases ( TPNSM
)
Total of cases investiga
ted (TPNSM -I ) W ork -r ela ted cases among TPNSM -I (WR PNSM -I ) and r ela ted pr o-por tion (p ) Total of C ases NO T in vestiga ted (TPNSM -NI ) Expec ted w ork -rela ted cases
among those not investiga
ted WR PNSM -NI = TPNSM -NI × p Estima ted number of w ork -r ela ted cases WR PNSM = W RPNSM -I + W RPNSM -NI 06—Alpes M ar itimes 0 60 45 38 (0.84) 15 13 51 0 13—Bouches ‑du ‑ Rhône 2 182 140 131 (0.94) 42 39 170 1 14— Calvados 1 37 30 25 (0.83) 7 6 31 3 24—D or dog ne 4 19 14 8 (0.57) 5 3 11 37 25—D oubs 1 14 12 9 (0.75) 2 2 11 10 2A—Haut e‑ Corse 0 5 3 2 (0.67) 2 1 3 0 2B— Corse du Sud 0 8 7 6 (0.86) 1 1 7 0 33— Gir onde 19 103 88 68 (0.77) 15 12 80 24 38—Isèr e 28 95 72 63 (0.88) 23 20 83 34 40—Landes 0 23 22 17 (0.77) 1 1 18 0 44—L oir e‑ A tlantique 1 133 60 52 (0.87) 73 63 115 1 47—L ot ‑et ‑G ar onne 0 12 10 7 (0.70) 2 1 8 0 50—M anche 5 48 21 18 (0.86) 27 23 41 12 61— Or ne 2 26 14 12 (0.86) 12 10 22 9 64—Pyr énées ‑A tlan ‑ tiques 1 34 28 22 (0.79) 6 5 27 4 67—Bas ‑R hin 15 43 39 35 (0.90) 4 4 39 39 68—Haut ‑R hin 2 23 14 12 (0.86) 9 8 20 10 76—S eine ‑M ar itime 63 161 127 112 (0.88) 34 30 142 44 80—S omme 4 23 15 12 (0.80) 8 6 18 22 83— Var 1 126 102 91 (0.89) 24 21 112 1 93—S eine ‑Saint ‑ D enis 6 64 57 40 (0.70) 7 5 45 13 94— Val ‑de ‑M ar ne 36 71 65 52 (0.80) 6 5 57 63 Total 191 1310 985 832 (0.84) 325 275 1107 17
Table 7 F emales ’ c ases of M esothelioma a ttribut ed t o o ccupa tional asb est os e xp osur e, f or PNSM and rn v3p , b y dépar temen t and se x (2008–2012) PNSM F rench Na tional M esothelioma Sur veillanc e P rog ram («P rog ramme Na tional de Sur veillanc e du M esotheliome»), Rn v3p F rench Na tional O ccupa
tional Diseases Sur
veillanc e and P rev en tion Net w or k («R éseau Na tional de Vig ilanc e et de P rév en tion des P atholog ies P rof essionnelles»), M males , F females , sex -r atio F/M, NA not a ttr ibut ed Coun ties iden -tifica tion (num
-ber and name of F
rench «dépar temen ts») rn v3p PNSM rn v3p ca tchmen t ra te of f emales ’
mesothelioma cases attribut
ed t o oc cu -pa tional asbest os exposur e C = W Rrn v3p / WR PNSM × 100 W ork -r ela ted
females cases among rn
v3p (WR rn v3p ) Total of f emales cases ( TPNSM )
Total of cases investiga
ted (TPNSM -I ) W ork -r ela ted cases among TPNSM -I (n = W RPNSM -I ) and r ela ted pr o-por tion (p ) Total of C ases NO T in vestiga ted (TPNSM -NI ) Expec ted w ork -rela ted cases
among those not investiga
ted WR PNSM -NI = TPNSM -NI × p Estima ted number of w ork -r ela ted cases WR PNSM = W RPNSM -I + W RPNSM -NI 06—Alpes M ar itimes 0 32 20 0 (0.00) 12 0 0 NA 13—Bouches ‑du ‑ Rhône 0 40 31 0 (0.00) 9 0 0 NA 14— Calvados 5 25 17 5 (0.29) 8 2 7 68 24—D or dog ne 0 14 11 1 (0.09) 3 0 1 NA 25—D oubs 0 3 3 0 (0.00) 0 0 0 NA 2A—Haut e‑ Corse 0 1 1 0 (0.00) 0 0 0 NA 2B— Corse du Sud 0 2 1 0 (0.00) 1 0 0 NA 33— Gir onde 2 32 29 3 (0.10) 3 0 3 60 38—Isèr e 6 28 26 4 (0.15) 2 0 4 139 40—Landes 0 9 5 0 (0.00) 4 0 0 NA 44—L oir e‑ A tlantique 0 24 14 3 (0.21) 10 2 5 0 47—L ot ‑et ‑G ar onne 0 3 2 0 (0.00) 1 0 0 NA 50—M anche 0 13 6 2 (0.33) 7 2 4 0 61— Or ne 0 7 7 1 (0.14) 0 0 1 0 64—Pyr énées ‑A tlan ‑ tiques 0 11 8 0 (0.00) 3 0 0 NA 67—Bas ‑R hin 1 11 10 1 (0.10) 1 0 1 91 68—Haut ‑R hin 0 5 1 0 (0.00) 4 0 0 NA 76—S eine ‑M ar itime 5 57 43 11 (0.26) 14 4 15 34 80—S omme 0 9 6 1 (0.17) 3 1 2 0 83— Var 0 26 17 1 (0.06) 9 1 2 0 93—S eine ‑Saint ‑ D enis 1 24 23 3 (0.13) 1 0 3 32 94— Val ‑de ‑M ar ne 4 32 31 3 (0.10) 1 0 3 129 Total 24 408 312 39 (0.13) 96 12 51 47
In conclusion, the catchment by rnv3p of the most emblematic OD through the OD clinics varies across France, according to the proximity of OD clinic, but also to their specialities, and according to sex, and work-related-ness for the subset of females’ cases. Some counties char-acterised by an important rnv3p recruitment (Nord, Pas de Calais), could not be studied as not covered by the PNSM. Discussion
This is the first time that the French OD Clinic network, rnv3p, has been examined from a geographical perspec-tive. The location of OD occurrences (addresses of the workplaces imputed to be sources of disease) has enabled us to describe the catchment zones of OD Clinics, and also of some related surrounding zones. The use of dif-ferent geographical analysis methods (density, standard deviation ellipses, Thiessen polygons) shows that there is a strong general trend for patients to be referred to OD Clinics in their own employment area or in the neigh-bouring ones, with a rapid decrease in number of refer-rals with increasing distance. This attractive force of OD clinics in their neighbouring area might also be related to induced-demand (Roemer’s law [19]), as these zones with teaching hospital correspond to those with the highest provision of health services as shown by the French med-ical demography atlas [20], except for some of the coun-ties located at the French South border.
We also showed that the “centre effect” can be mani-fested in different ways, depending on other parameters such as the reason for referral. The catchment was then refined using the size of the underlying active workforce in those “Employment Areas” for which statistical data was available. This revealed some areas associated with a higher capture of cases. We also found a qualitative effect when an OD clinic specialized in a particular type of examination. Taken together, the approach has pro-vided new information to the rnv3p network stakehold-ers that allows them to better interpret the capture of cases and rnv3p figures. Nevertheless there is still work to do to better describe, within the figures analyzed, what depends from the OD centers’ signatures, from the signa-ture of the underlying economic activity and the related work-related diseases.
The rnv3p data were mapped at the most accurate scale permitted by the availability of the external data sources (“départements” for PNSM, employment areas for INSEE, and municipalities for rnv3p data alone).
The main limitation of our study is the loss of infor-mation on observations due to the fact that the “entre-prise responsible of the disease” is often a missing data. Indeed, only 59 % of observations were geolocated. There are two main reasons for this. First of all, the “entreprise responsible” could not be recorded when it was not the current one (limitation due to the rnv3p application in its previous version). This affects mainly long latency dis-eases. Indeed, the percentage of successfully geocoded observations related to a subset of short latency diseases (rhinitis, asthma, contact dermatitis) is 77 %, whereas it is only 24 % for diseases with long latency diseases (cancers, pneumoconioses including asbestosis related pleural plaques). Secondly, the “entreprise address” infor-mation was not mandatory, and was filled differently by OD clinics. Even for short latency diseases, there remain differences in the percentages of addresses recorded (Additional File 2: Table S1). From now on, these limi-tations have been addressed. First of all the new rnv3p information system allows to record previous enterprises, and secondly OD clinics were given the information of the importance to record enterprises addresses, as well as their unique national identifier in order to cross with other databases.
This information had the best quality of geocoding assessed in terms of match rates, match scores, match type and spatial accuracy [21]. This loss of information could induce bias and alter the patterns given by the maps. For this reason, in the legends to the maps we have highlighted the score for geolocation for each OD clinic, so as to alert to caution in interpretation.
Another limitation is that although we highlighted the interaction between the observed catchment and OD Clinic specializations (in terms of emphasis on particular surveillance activities) and the characteristics of the ter-ritories in terms of occupational risks; this is still not suf-ficiently well described and understood at this time. Thus it should not be totally relied on and used to adjust and optimize surveillance missions.
(See figure on next page.)
Fig. 8 Rnv3p capture rate of mesothelioma cases in comparison with the PNSM, by sex, for all mesothelioma, and for the subset of cases with occupational asbestos exposure (2008–2012). a1 rnv3p capture rate for all male’s mesothelioma cases. a2 rnv3p capture rate for male’s mesothe‑ lioma cases related to occupational asbestos exposure. b1 rnv3p capture rate for all female’s mesothelioma cases. b2 rnv3p capture rate for female’s mesothelioma cases related to occupational asbestos exposure. Rnv3p French National Occupational Diseases Surveillance and Prevention Net‑ work, PNSM French National mesothelioma surveillance program (Programme National de Surveillance du Mésothéliome). The capture rate takes the “NA” value, for départements for which no cases have been identified by PNSM. The comparison is available only for the “départements” covered by the PNSM which are the following: 06—Alpes Maritimes, 13—Bouches‑du‑Rhône, 14—Calvados, 24—Dordogne, 25—Doubs, 2A—Haute‑Corse, 2B—Corse du Sud, 33—Gironde, 38—Isère, 40—Landes, 44—Loire‑Atlantique, 47—Lot‑et‑Garonne, 50—Manche, 61—Orne, 64—Pyrénées‑Atlan‑ tiques, 67—Bas‑Rhin, 68—Haut‑Rhin, 76—Seine‑Maritime, 80—Somme, 83—Var, 93—Seine‑Saint‑Denis, 94—Val‑de‑Marne
In terms of perspectives, the main challenge is now to design and develop a dynamic cartographic tool, linked to an updated rnv3p database for OD physicians, OH services and stakeholders to enable them to enter and access their data using a systematically mapped and geographic approach. From a technical point of view, the first step will be to put as much emphasis on the coding of geographic information, and identification of the workplace as on the other recorded variables, in order to obtain the most reliable information from the maps. For a better picture of OH, complementary approaches centred on given diseases are needed (e.g. maps of work-related asthma cases and the geographi-cal distribution of their causes). Apart from the specific case of mesothelioma, there are no other surveillance networks which exhaustively cover occupational dis-eases. Nevertheless, comparisons can be made with some other sources. The most interesting one is the salaried workers’ compensated diseases dataset, which is also available at the workplace level. Comparisons with rnv3p data will allow a more systemic picture of OD across territories to be drawn, and to reassess on-site prevention measures since this information is avail-able on a workplace scale. Data could also be compared with indicators from the Uncompensated Work-Related Diseases Network [22], which draws estimates of non-compensated work-related illnesses at the regional level. Finally, complementary approaches centred on different types of exposures are also needed to advance risk-assessment.
Our work calls for further action. For instance, it would be of interest to examine employment area which have shown no case capture to date (shaded zones of the net-work). This can be done by initiating exchanges between the nearest OD Clinic and the occupational health ser-vices covering these areas.
In the literature, we found no other studies in the occu-pational health field that attempted to describe this kind of network from a geographical point of view. We also found no other studies which analysed GIS data pertain-ing to Occupational Diseases, except those cited above for which the limitations are already mentioned.
In France, a GIS-based project aimed at collecting statistical data (mainly about employment) in order to map “work territories” (the ATTLAS project) was initi-ated in 2006. This project built an open-access on-line tool allowing several indicators to be mapped at differ-ent scales [23]. Another research program (GISCOP 93), is using geographic tools such as GIS in order to collect and map risks of occupational exposure to carcinogens in a particular French département located in the Ile de France Region [24]. Unfortunately, neither of these pro-jects includes data regarding work-related health.
This work, as well as those mentioned above that also use a geographic approach, is in line with one major objective of the French National Plan for Occupational Health 2016–2020, related to knowledge building [25]. Especially the “action 3.13” objective is to give all regions possibilities to identify and map geographically relevant information pertaining to employment and occupational health, in order to build territorial diagnoses of occupa-tional health. The ultimate goal is to promote a regional approach to occupational health risk assessment, prior-itize actions, and facilitate cooperation between all play-ers concerned by OH, so as to improve prevention. Conclusion
The geographic approach to this network, enhanced by the possibilities provided by the GIS tool, allow a bet-ter understanding of the coverage of this network at a national level, as well as the visualization of capture rates for all OD clinics. Highlighting geographic and thematic shading zones bring new perspectives to the analysis of occupational health data, and should improve occupa-tional health vigilance and surveillance.
Abbreviations
EA: employment area (geographic entity level for which economic activities figures are given by INSEE; In French “zones d’emplois”); GIS: Geographic Infor‑ mation Systems; ICD‑10: International Classification of Diseases (10th version); INSEE: French National Institute of Statistics and Economic Studies (“Institut National de la Statistique et des Etudes Economiques”); NAF: national activity codes (“Nomenclature d’Activités Française”); OD: occupational diseases; PNSM: French National Mesothelioma Surveillance Program (“Programme National de Surveillance du Mésothéliome”); rnv3p: French National Occu‑ pational Diseases Surveillance and Prevention Network (“Réseau National de Surveillance et de Prévention des Pathologies Professionnelles”); SDE: standard deviation ellipses; WRD: work‑related diseases.
Authors’ contributions
MD performed the analyses, constructed the maps and contributed to writing the paper. VG supervised Marie Delaunay’s work regarding GIS methods and the geographic approach and contributed to optimizing the paper. MLB contributed to the involvement of the rnv3p network in this project, made it possible to access data, followed the progress of this work and also contrib‑ uted substantially to the improvement of the paper. AGSI made it possible to access the PNSM data and actively participated in the comparison of RNV3P Additional files
Additional file 1: Fig. S1. Employment area with higher catchment of OD by the French OD clinics network (rnv3p) for the broad categories of occupational activities (namely: A. agriculture, B. construction, C. commercial services and D. non‑commercial services). Legend. Occu‑ pational diseases (OD) reported to the rnv3p by OD Clinics are reported to the expected number for each employment area. For each of these geographical units, the sum of the ratios of observed vs expected OD for each category of activity was calculated and mapped. Sources: rnv3p 2001–2012, and French National Institute of Statistics and Economic Stud‑ ies (INSEE). For industry, see Fig. 6.
Additional file 2: Table S1. Success in geocoding rnv3p observations, according to the latency of diseases, and for each French OD clinic (rnv3p 2001–2012).