Development of an urban typology to assess
residential environmental performance
at the city scale
Véronique WALLEMACQ
1, Anne-Françoise MARIQUE
1, Sigrid REITER
11: Local Environment Management and Analysis (LEMA), University of Liege (ULg), Liège, Belgium
ABSTRACT:
In this research, a typology of urban blocks is drawn up for the urban area of Liege. This typology of urban blocks is organized into a set of themes according to various environmental parameters. This paper presents the energy part of this typology on the residential building stock of Liege, which includes four topics: residential buildings energy consumption; transport energy consumption of residents; development potentialities of public transport and development potentialities of energy networks. The proposed typology was elaborated through the use of GIS tools combined with a statistical treatment of several specific criteria at the urban block scale. For each class of this typology, a representative block is selected for further energy simulations in order to model residential energy use related to buildings, transport and energy networks at the city scale. The methodology developed in this paper is adapted to urban, suburban and rural zones. It can thus be adapted and/or reproduced on many other territories in Belgium but also in Europe or even further.Keywords: urban typology, GIS, Principal Component Analysis, energy consumptions, city scale.
1. INTRODUCTION
In studies devoted to the environmental performance of urban areas, the aspect which is most frequently approached is the energy consumption of buildings, taken as autonomous elements, neglecting the importance of environmental phenomena linked to larger scales [1]. Reducing energy consumption in the building sector appears as an important policy target both at the European and the national levels. Moreover, urban areas are supposed to present high potentialities in terms of energy reduction. This is why the Directive on the Energy Performance of Buildings [2] came into force in 2002 with legislation in European Member States by 2006. The energy policy measures of the EPB Directive focus on energy efficiency when new buildings are constructed or when big buildings (larger than 1000 m²) undergo a major renovation. Still it has to be admitted that several parameters, like for examples the urban context, the location and distribution of buildings, their functional mix, the potentialities for lighter renovation actions as well as the energy renovation of smaller buildings, have been widely underestimated until now, even if they are key factors for the global energy performance of cities. Indeed, decisions made at the neighborhood level have important consequences on the performance of individual buildings and on the transport habits of the inhabitants [3].
The urban typology developed in this paper deals with energy consumptions and is related to buildings consumptions, transport and energy networks. It is the first part of a full typology that aims at modeling the global environmental performances of the residential building stock of the urban area of Liège.
2. STATE OF THE ART
Two main approaches have been proposed in the literature for addressing the relation between urban form and energy consumption at the neighborhood and city scales. A first approach is based on building simulation models. Steemers [4] analysed areas of 400 x 400 meters in order to establish the relations between urban form and buildings energy consumptions. The analysis was based on three geometric parameters: building depth, street prospect and urban compactness. A similar analysis was then performed by Ratti et al. [5]. The selected variables were here the distance between facades, orientation of the facades and lighting obstructions. A second approach is based on a statistical approach for the prediction of buildings consumptions. The Energy and Environment Prediction (EEP) model [6] is based on a national database that provides energy consumption for a series of 100 building typologies.
Some existing scientific works study transport consumptions at the city and the regional scales. Based on data from 32 big cities located all over the world, Newman and Kenworthy [7,8] have highlighted a strong inverse relationship between urban density and transport consumptions (only valid for certain conditions). More recently, Boussauw and Witlox [9] have developed a commute-energy performance index and tested it for Flanders and the Brussels-capital region in Belgium, including rural, suburban and urban parts of these territories. This commute-energy performance index is based on statistical data available at the district scale taking into account commuting distances, modal shares of non-car travel modes and aspects of infrastructure in order to investigate the link between spatial structure and energy consumptions for home-to-work travels at the regional scale. Marique and Reiter [10,11] have adapted and completed the index developed by Boussauw and Witlox [9] in order to develop a more
detailed method to assess transport consumptions at the neighborhood scale in the Walloon region of Belgium taking into account energy consumptions for home-to-work travels but also home-to-school travels as well as other purposes of travels (leisure and shopping).
Finally, Steadman et al. [12] adopted an approach which combines building and transport energy consumptions in order to compare different urban organizations: compact city, dispersed settlements, polycentric development along public transport lines, etc. The method developed is based on land use analyses but the impact of urban form on energy consumption is mainly addressed at the agglomeration level and is not of direct use for urban design at the neighborhood or the urban block levels. 3. STUDY AREA, METHOD AND CHOSEN
CRITERIA
Our study focuses on the urban area of Liège and more specifically on its residential urban blocks. This research uses an Urban GIS in order to develop an energy model of the urban area of Liège and to spatialize its major components.
The Urban GIS model used was the PICC, that is a computer project of continued mapping from the Public Service of the Walloon Region of Belgium. The PICC’s data are provided in the form of vector map layers that characterize the natural environment (rivers, forests), the built environment (buildings) and the infrastructure (roads, railways, etc.) at scale 1/1000. The spatial position of these objects is known by their position (x, y) and their altitude (z) with an accuracy of 25 cm.
Delimitation of the urban blocks of our studied area was performed using the following definition: a residential urban block is a piece of land that supports one or more residential buildings and that is completely surrounded by:
• either public roads. The boundary of the block is then located in the middle of the adjacent roads,
• or areas dedicated to other types of assignments (industrial zones, forest, etc). The limit is then the boundary of the residential area.
A large number of variables were selected to characterize the energy efficiency of city blocks (including buildings consumptions, transport and energy networks), using an extensive literature review on this subject. The information in the cadastre and some other quantitative parameters have then been linked to the GIS file in order to spatialize these criteria through the urban area of Liège.
It is important to note that some plots of the PICC found no match in the database of the cadastre. No data will be taken into account for the buildings constructed on these plots. Note that these differences arise because the data from the PICC were developed from aerial rectified photographs and the data from the cadastre were developed from digital cadastral maps. However, these data can be considered acceptable because only 383 buildings could not be taken into account, which represents
only 0.2% of the residential building stock of the urban area of Liège.
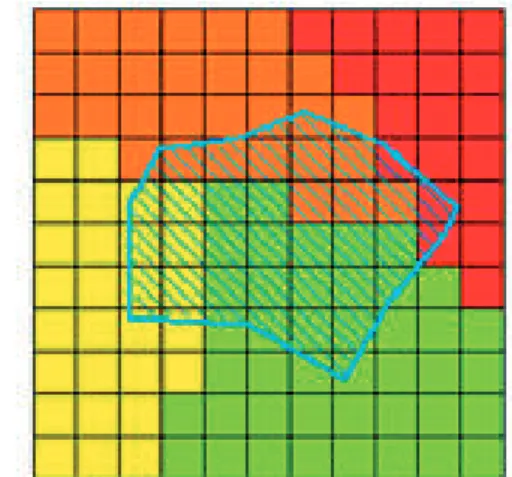
To convert, as consistently as possible, the data known at the census block scale (that is the smallest geographical unit in which statistical data are available in Belgium) to the scale of the urban block, the data associated with each statistical area were distributed in a grid which has a resolution of 10 m wide (see figure 1).
Figure 1: Distribution of the data associated with four census blocks to a spatial grid of 10m wide.
A weighting is then applied according to the surfaces of the urban blocks that are related to one or several census blocks (see figure 2).
Figure 2: Weighting calculation of the urban block (in blue) data on basis of four census blocks data.
A statistical treatment of the large number of parameters selected from the literature was performed using a Principal Component Analysis. This methodology [13,14], allows crossing a large number of criteria and grouping them according to their similarities. This statistical treatment reduced the number of our selected criteria to characterize the energy performance of the residential urban stock of Liège.
These are the nine criteria the most representative of the urban area of Liège in order to perform energy studies at the city scale:
• Buildings’ date of construction (before 1930, from 1931 to 1969, from 1970 to 1985, from 1986 to 1996, from 1997 to today), depending on the types of construction related to regional regulations and construction modes. These data are defined across the urban blocks from the cadastre.
• Type of buildings (two, three or four frontages). Indeed, a terraced house uses less energy than a detached house. These data are defined across the urban blocks from the cadastre.
• Type of housing (collective or individual). These data are defined across the urban blocks from the cadastre.
• Urban functions (residential, trade, school or socio-cultural facilities, services). Each block may contain one to four of these functions. The functional mix reduces energy consumption associated with shorter distances between the different activities’ locations of everyday life. These data are defined across the urban blocks from the cadastre.
• Index of energy performance for residents’ travels to their work places, following [10,11]. This index is based on statistical data available at the census block scale. These data come from national censuses, carried out every ten years in Belgium. Weighted average of the built area of each city block has been achieved to adapt these data from the census block scale to the scale of the city block.
• Expected modal shares for alternatives to the car, following [15]. This calculation
takes into account the daily frequency of trains and buses weighted by their type and destination.
• The net built density, which is the product between the built footprint (ratio between the built area at the ground level and the total area of the urban block) and the average height of the urban block. These data are calculated with the GIS tool thanks to the PICC data.
• The compactness of the built urban block, defined as the ratio between the total area of the buildings’ envelopes and the living volume inside the buildings (m²/m³). These data are calculated with the GIS tool thanks to the PICC data, using some geometric simplifications.
• The area of the urban block (in ha), calculated with the GIS tool thanks to the PICC data.
4. TYPOLOGY OF URBAN BLOCKS
The typology of urban blocks is organized into four topics: residential buildings energy consumption; transport energy consumption of residents to their work places; development potentialities of public transport and development potentialities of energy networks.
For each topic of this typology, representative blocks are selected in order to model energy use at the city scale, as well as to consider the possible evolution of the city energy consumptions and to
simulate the effects of some strategies of urban design and urban renewal. The proposed representative blocks were selected by choosing for each topic the representative criteria into the list of nine criteria previously determined by the Principal Component Analysis and then crossing them at the urban block scale.
For the first topic “Residential buildings energy consumption”, the following criteria were selected: buildings date of construction, type of buildings (number of frontages) and type of housing (collective or individual). After crossing these three criteria at the urban block scale, only the main classes that include the largest number of urban blocks were selected. So, fourteen types of urban blocks have been defined, which represent 97% of the blocks of the urban area of Liège.
Within each of these 14 types, a representative block was chosen to allow modeling more accurately the energy consumption of buildings. These representative urban blocks are selected on the basis of their strongest characteristics. For example, in the category of urban blocks built before 1930, where the type of buildings are mix (two, three or four frontages) with no type exceeding a proportion of 66.6% in the urban block and where most of the buildings are individual, the most representative block is an urban block including a maximum number of individual buildings built before 1930 (100% if possible) and where the three types of buildings are equally represented (ideally 33.3% of detached buildings, 33.3% of semi-detached buildings and 33.3% of terraced buildings). Among all the urban blocks that meet these criteria, the block that includes the largest number of buildings is chosen.
The four most frequently encountered types for this first theme cover 63% of the residential building stock of the urban area of Liege.
1. There are 1169 urban blocks built before 1930, where the type of buildings are mix (two, three or four frontages) with no type exceeding a proportion of 66.6% in the urban block and most of them are individual housing. This type of urban block corresponds to 28% of the residential building stock of the urban area of Liège (see figure 3).
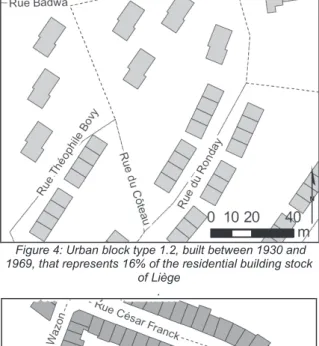
2. There are 667 urban locks built between 1930 and 1969 where the type of buildings are mix (two, three or four frontages) with no type exceeding a proportion of 66.6% in the urban block and most of them are individual housing. This type of urban block corresponds to 16% of the residential building stock of the urban area of Liège (see figure 4).
3. There are 508 urban blocks built before 1930 where over 66.6% of the buildings are terraced houses and most of them are individual housing. This type of urban block corresponds to 12% of the residential building stock of Liège (see figure 5).
4. There are 314 urban blocks constructed after 1970, where over 66.6% of the buildings are separate and most of them are individual housings. This type of urban block
corresponds to 7% of the residential building stock of Liège (see figure 6).
Figure 3: Urban block type 1.1, built before 1930, that represents 28% of the residential building stock of Liège.
Figure 4: Urban block type 1.2, built between 1930 and 1969, that represents 16% of the residential building stock
of Liège .
Figure 5: Urban block type 1.3, , built before 1930, that represents 12% of the residential building stock of Liège.
Figure 6: Urban block type 1.4, built after 1970, that represents 7% of the residential building stock of Liège.
For the second topic “Transport energy consumption of residents to their work places”, the index of energy performance for residents’ travels to their work places (IPE) developed by Marique and Reiter [10,11], was used to spatialize and characterize (see figure 7) this variable through the urban area of Liège. This method is based on statistical data available at the census block scale.
Figure 7: Mapping of the index of energy performance for residents’ travels to their work places (IPE, in kWh/worker for one way to work) through the urban area of Liège
As far as home-to-work travels are concerned, the first step of the method is to combine the number of workers in a census block with the number of travels per week (thought the repartition of the number of working days in the census block), the distance travelled for home-to-work travel (one way) and the modes of transport used (car, bus, train, motorbike,
bike or on foot) in this census block in order to determine, for each census block, how many kilometers are covered annually by each mode of transport.
A correction factor is applied to short distances covered by train and long distances covered by bus, in order to keep the relationship between the mode and the distance travelled. Non motorized trips are not considered in the following calculations because they do not consume any energy. Motorbike trips are neglected because they represent a very small part of Belgian travels.
When the main mode of transport used is the train, we take into account travels from the house to the train station for the suburban blocks because they are generally located far away from train stations. Travelling by car to the station can thus play a significant role in the energy consumptions. The mode of transport used for home-to-station travels is determined according to the distance travelled and the bus services available in each census block.
Kilometers covered by diesel cars are then separated from those covered by petrol cars, according to the regional distribution of the vehicle stock in the Walloon region (55% diesel and 45% petrol cars). The final step of the method consists in allocating consumption factors to the kilometers covered in each category of vehicles (diesel car, petrol car, bus or train) in order to convert kilometers into kWh. Consumption factors take into account the mean consumption of the vehicles (liter per km), the passenger rate and the characteristics of the fuel. For the train, the consumption factor used depends on the production of electricity because in Belgium trains are mainly electrified.
The map drawn up with the index of energy performance for residents’ travels to their work places (IPE, in kWH par worker, for one way) through the urban area of Liège (see figure 7) shows obviously that peripheral areas tend to generate much more energy consumptions due to home-to-work travels than the central areas of the urban zone.
For the third topic “Development potentialities of public transport”, the following criteria were selected: the net built density, the urban functions and the expected modal shares for alternatives to the car, (calculated following [15]). The net built density is dependent on buildings concentrations and thus characterizes the necessity for public transport stops. This variable was discretized into three classes: low density (<0.5), medium density (between 0.5 and 1) and high density (> 1). The mixed use was defined thanks to seven classes, established by the number and type of functions of each urban block:
1. Residential buildings only, 2. Residential buildings and shops, 3. Residential buildings and services,
4. Residential buildings and school or socio-cultural equipment,
5. Residential buildings, shops and services, 6. Residential buildings, shops and school or
socio-cultural equipment,
7. Wide mix of functions (residential buildings, shops, services and school or socio-cultural equipment)
Finally, the expected modal share of alternatives to the car has been characterized in three classes: low (<15%), medium (between 15% and 30%) and high (> 30%).
After crossing these three criteria at the urban block scale, only the main classes (including more than 0.5% of the total urban blocks of the urban area of Liège, i.e. 21 urban blocks) were selected. These 34 chosen types of urban blocks represent 93,4% of the blocks of the urban area of Liège. The selection of the representative block for each of the 34 chosen types was conducted following a similar methodology to that used for theme 1.The four most common types for this third theme cover 40% of the studied urban stock:
1. Type 3.1, characterized by residential buildings, low density and low expected modal share, covers 13.1% of the studied urban stock.
2. Type 3.2, characterized by residential buildings and shops, high density and medium expected modal share, covers 9.9 % of the studied urban stock.
3. Type 3.3, characterized by residential buildings, medium density and medium expected modal share, covers 8.7 % of the studied urban stock.
4. Type 3.4, characterized by residential buildings, high density and medium expected modal share, covers 7.8 % of the studied urban stock.
For the fourth topic “Development potentialities of energy networks”, the following criteria were selected: the urban functions, the compactness of the urban blocks and the area of the urban blocks. An important mix of functions improves the efficiency of an heating network thanks to the time difference between the energy demand of the buildings dedicated to different activities. The compactness and the area of the urban blocks are needed parameters to optimize the energy networks. The compactness and the area of urban blocks have been characterized in three classes: low, medium and high. The average medium value for the compactness of the urban blocks of Liège is 0.335 m²/m³ and the average medium value for the blocks area is 2.1 ha.
After crossing these three criteria at the urban block scale, only the main classes (including more than 0.5% of the total urban blocks of the urban area of Liège, i.e. 21 urban blocks) were selected. These 35 chosen types of urban blocks represent 91.6% of the blocks of the urban area of Liège. The selection of the representative block for each of the 35 chosen types was conducted following a similar methodology to that used for theme 1. The four most common types for this fourth theme cover only 26% of the studied urban stock:
1. Type 4.1, characterized by residential buildings, medium compactness and small area, covers 8.1% of the studied urban stock.
2. Type 4.2, characterized by residential buildings, low compactness and small area, covers 6.7% of the studied urban stock.
3. Type 4.3, characterized by residential buildings, medium compactness and medium area, covers 5.6 % of the studied urban stock.
4. Type 4.4, characterized by residential buildings and shops, medium compactness and large area, covers 5.6 % of the studied urban stock.
5. CONCLUSION
There are a lot of modelling tools to assess energy management of a specific building. However, such an approach makes it difficult to generalize the results in order to determine the best strategies at the urban scale.
After summarizing the state of the art on energy modeling for buildings and transportation at the urban scale, this paper presented a typology of urban blocks drawn up for the urban area of Liege (in Belgium) through the use of GIS tools combined with a statistical treatment of several specific criteria at the urban block scale. This typology of urban blocks is organized into four themes: residential buildings energy consumption; transport energy consumption of residents; development potentialities of public transport and development potentialities of energy networks. A selection of the most representative types of urban blocks is done for each of these themes and a representative block of the urban area of Liège is chosen for each of these representative types.
This typology allows us to conduct several researches on the energy performance of Liège’s housing stock, at the urban block scale, at the neighborhood scale and at the city scale. It should thus help developing strategies of urban design and urban renewal as well as improving urban management and policy making. For example, it is an important basis to consider the possible quantitative and qualitative future evolution of this residential stock on one hand, and on the other hand, to simulate the effects of some strategies of urban renewal on the energy performance of this built stock.
The typology presented in this paper is the first part of a larger typology developed in order to assess the environmental performance of Liège’s residential urban stock including the energy, water and biodiversity points of view. Comparative studies of these different aspects should help to improve the sustainability of the Belgian built environment.
Moreover, the methodology developed in this paper is adapted to urban, suburban and rural zones. It can thus be adapted and/or reproduced on many other territories in Belgium but also in Europe or even further.
6. ACKNOWLEDGEMENTS
This research has been funded by the Special Funds for Research of the French Community of Belgium.
7. REFERENCES
[1] C. Ratti, N. Baker and K. Steemers (2005), Energy consumption and urban texture, Energy and Buildings 37 (7), 762-776.
[2] Directive 2002/91/EC of the European Parliament and of the Council of 16 December 2002 on the Energy performance of buildings (2003), Official Journal of the European Union L 001, 65-71.
[3] E. Popovici and B. Peuportier (2004), Using life cycle assessment as decision support in the design of settlements, Proc. of the 21th PLEA Conference on Passive and Low Architecture. Eindhoven.
[4] K. Steemers (2003), Energy and the city: density, buildings and transport. Energy and Buildings (35) 3–14.
[5] C. Ratti, N. Baker and K. Steemers (2005), Energy consumption and urban texture. Energy and Buildings (37) 762–776.
[6] P.J. Jones, S. Lannio and J. Williams (2001), Modelling building energy use at urban scale, 7th International IBPSA Conference, Rio de Janeiro, Brazil,13-15.
[7] P. Newman and J.R. Kenworthy (1989), Cities and Automobile Dependence, A sourcebook, Gower, Aldershot.
[8] P. Newman and J.R. Kenworthy (1999), Sustainability and Cities: overcoming automobile dependence. Island Press, Washington DC. [9] K. Boussauw and F. Witlox (2009). Introducing a
commute-energy performance index for Flanders. Transport Research Part A 43, 580-591.
[10] A.-F. Marique and S. Reiter (2010). A method to assess global energy requirements of suburban areas at the neighborhood scale, Proc. of the 7th International IAQVEC Conference on Indoor Air Quality, Ventilation and Energy Conservation in Buildings, Syracuse, New York.
[11] A.-F.,Marique and S. Reiter (2010). A method to assess transport consumptions in suburban areas. PLUREL conference: Managing the Urban Rural Interface, Copenhagen.
[12] P. Steadman, S. Holtier, F., Brown, J. Turner, T. De La Barra and P.A. Rickaby (1998), An integrated building stock, transport and energy model of medium sized. Report to the EPSRC. [13] L. Lebart, A. Morineau and J.-P. Fenelon
(1982), Traitement des données statistiques – méthodes et programmes, 2d ed., Bordas Éd., Dunod, Paris.
[14] M. Volle (1993), Analyse des données, 3rd ed., Economica, Paris.
[15] Y. Cornet, D. Daxhelet, J.-M. Halleux, A.-C. Klinkenberg and J.-M. Lambotte (2005), Cartographie de l’accessibilité par les alternatives a la voiture, Conférence Permanente du Développement Territorial (CPDT), Belgium.
“Identification of urban subcentres by means of
land use, electric consumption and CO
2
production. The case of Barcelona Metropolitan
Area (RMB)”
C
ARLOSA
GUIRREN
ÚÑEZ1, C
ARLOSM
ARMOLEJOD
UARTE21Centre de policy land an valuations, ETSAB, University Polytechnic of Catalonia Barcelona, Spain.& Civil
Construction School, Catholic University of Chile,
2 Centre de policy land an valuations, ETSAB, University Polytechnic of Catalonia Barcelona, Spain.
ABSTRACT:
Read In urban economics theory, the activity index has been measured based on the quantity of workers in the zone and the land-use density. In general, most of the studies in the field of the urban land economics incorporate these indicators as input for evaluating the urban structure, the identification of urban subcenters and the definition of mobility patterns. Urban subcenters are territorial concentration of workers and in that sense; they define the urban mobility patterns over a metropolitan area. However, there are more possibilities to identify them.
This paper proposes a new definition of sub-centers. Density of workers is complemented with the observation of four approaches for the analysis of the Barcelona Metropolitan Area. These four approaches are the urban lands patterns (based on CORINE land cover information), the mobility of workers (from data of the Spanish Census), electric consumption (from information of the electric companies) and the estimated CO2 production.
Consequently, the urban structure will be defined based on these four approaches, which also will validate the previously defined 15 subcenters of the Barcelona Metropolitan Area.
Keywords: Urban Subcentres, Urban use patterns, electric consumption, and urban structure
1. INTRODUCTION
Since the Industrial Revolution, cities have developed based on the following guidelines: 1) urban growth (not necessarily contiguous in space and continuous in time), and above all, a change in their spatial structure. In the latter regard, it has occurred emergence of the CBD (central business district, in the acronym) and post industrialization debacle[1]. Under the model monocentric, characterized by a clear dominance of the CBD in terms of concentration of employment, flourished the main theories urban economy, highlighting the income offered (bid rent), which inversely related (trade-off) the income locators are willing to transfer to the ground and transport costs (Including the value of time). So more locations accessible, ie the most central, are precisely those whose lands receive more income (ie: where you create the highest point land value).
The current paradigm of metropolitan urban systems is monocentric model away abysmally in the meantime:
The non-CBD tends to concentrate as much of metropolitan employment; other employment or is dispersed or agglomerated sub which is attracting potential differential. The gradual emergence and consolidation of complex systems, in partly dispersed and polycentric, has taken a place as development lines of cities in the last decades of the twentieth century. This agglomeration is based on the concentration of economics factors, such as capital labour and technology, which are basis input for dynamic structuring of the territory. This work seeks to relate these dynamics metropolitan watching environmental standards, such as electricity
consumption, land use and the estimation of CO2
production.
2. STATE OF THE ART
A subcentre is a point in the metropolitan area characterized not only by having a density significantly higher than the workers of their neighbours, but above all, by being able to exert an influence on their surroundings. This influence can be reflected by the flow of workers and shoppers who visit him from their residences, or by a modification of the mantle value and intensity of land use around it. A subcentre, should also be a reference point in the territory with an identity that can be recognized for their neighbourhood, but not incorporated the environmental aspect for this urban structure.
Since the early spatial models such as Von Thunen, 1826, to those of Krugman and Fujita, self-organization of space has been raised through the integration of three closely interrelated processes, namely:
1) The formation of spatial rent of land, 2) The configuration of land uses, and 3) The intensity of use of space.
Value, use and density are, therefore, the three sides of a coin, in which background underlying transport costs and time spent to overcome space and agglomeration externalities, as emergent property, arising from the concentration of locators. In this sense Betaud [2] has emphasized that the forces that form and maintain the subcenters are related to the efficiency and effectiveness of the transport system.
Bertaud [2] raises the differences between the monocentric and polycentric cities depending on the