HAL Id: hal-00633560
https://hal.archives-ouvertes.fr/hal-00633560
Submitted on 18 Oct 2011
HAL is a multi-disciplinary open access
archive for the deposit and dissemination of
sci-entific research documents, whether they are
pub-lished or not. The documents may come from
teaching and research institutions in France or
abroad, or from public or private research centers.
L’archive ouverte pluridisciplinaire HAL, est
destinée au dépôt et à la diffusion de documents
scientifiques de niveau recherche, publiés ou non,
émanant des établissements d’enseignement et de
recherche français ou étrangers, des laboratoires
publics ou privés.
A Multiwindow Approach for Radargrammetric
Improvements
Stéphane Meric, Franck Fayard, Eric Pottier
To cite this version:
Stéphane Meric, Franck Fayard, Eric Pottier. A Multiwindow Approach for Radargrammetric
Im-provements. IEEE Transactions on Geoscience and Remote Sensing, Institute of Electrical and
Elec-tronics Engineers, 2011, 49 (10), pp.3803-3810. �10.1109/TGRS.2011.2144606�. �hal-00633560�
considered, this computation is called radargrammetry. The main idea of which is to match stereopair radar images in order to create a disparity map from one image to the other and, finally, to compute the elevation. Therein, we present our studies on the extraction of 3-D information from radar images. We examine a way to produce a DEM of a challenging area of the French Alps. The central issue of this paper concerns improvements for radargrammetric synthetic aperture radar image processing for high-relief reconstruction, and we focus on the matching step, which is one of the most important points of the radargrammetric processing. Thus, we propose original methods using different correlation windows. On the one hand, we take the advantages of a multiwindow approach to combine relevant information by multiplying the correlation surfaces obtained for each correlation window size during the matching operation. On the other hand, the second improvement is based on the expansion of windows on foreshortened areas, particularly because of the side-looking radar view. These methods allow us to achieve reliable image matching and to improve the accuracy of the DEM.
Index Terms—Digital elevation model (DEM), matching
cor-relation, radar, radargrammetry, stereoscopy, synthetic aperture radar (SAR).
I. INTRODUCTION
S
YNTHETIC aperture radar (SAR) imagery offers many research options in remote sensing; however, in this paper, we focus on how to obtain a digital elevation model (DEM) from pairs of stereoscopic SAR images. There are several methods to reconstruct elevation models from radar images: clinometry [1], interferometry [2], polarimetry [3], and stere-oscopy [4]. Our focus herein is on how to obtain a DEMManuscript received September 30, 2010; revised February 10, 2011; accepted April 10, 2011. Date of publication May 26, 2011; date of current version September 28, 2011.
S. Méric is with the Institute of Electronics and Telecommunications of Rennes, National Institute of Applied Sciences (INSA), 35043 Rennes, France (e-mail: [email protected]).
F. Fayard was with the Institute of Electronics and Telecommunications of Rennes, National Institute of Applied Sciences (INSA), 35043 Rennes, France. He is now with the Signal and Image Processing Department (TSI), Télécom ParisTech, 75634 Paris, France.
É. Pottier is with the Institute of Electronics and Telecommunica-tions of Rennes, University of Rennes 1, 35065 Rennes, France (e-mail: [email protected]).
Color versions of one or more of the figures in this paper are available online at http://ieeexplore.ieee.org.
Digital Object Identifier 10.1109/TGRS.2011.2144606
[11], we can regard the topic as still being important.
Radargrammetric processing requires a mastery of several steps to solve 3-D stereo intersection equations: viewing ge-ometry, image matching, and geometric reconstruction. First, viewing geometry, of which the most common radar configu-rations are same- and opposite-side configuconfigu-rations, allows us to decide how to obtain the required radar images. The next step is image matching, which is based on an area correlation between stereo radar images. This step gives the information parallax between stereoscopic images, which is the main infor-mation required to compute elevation. From each pair of radar images, we get a disparity map along both the azimuth axis and the range axis. Finally, the computation of this disparity map, obtained under known flight conditions, produces terrain elevation.
One of the most sensitive steps in radargrammetric process-ing is the matchprocess-ing step. The most commonly used image-matching technique is based on an area correlation between stereo radar images; however, image matching can dramatically fail in some high-relief areas due to radiometric and geometric differences between SAR stereopair images. Most efforts to im-prove the performance of radargrammetry have focused on this matching step [12]–[15]. Herein, we propose a new approach for the matching computation by combining two methods. On the one hand, we use results from different correlation window sizes in order to collect more information for better reliability by multiplying these results. It is worth noting that the use of the results for different window sizes has already been accom-plished [16], [17]. On the other hand, we apply an expanded correlation window in order to make the correlation patterns more similar. Thus, a resampling operation, which is applied to this expanded correlation window by different amounts in the range direction, is carried out in order to account for unknown foreshortening effects, resulting in improved match correlations for high-relief terrain. Moreover, we apply our improvements at different steps of the pyramidal scheme that we established for our radargrammetric processing.
We will set out the discussion in three parts. First, we will present the basic extraction operations from radar data, as pre-cisely described in [18] and [19]. Second, we will develop the different suggested improvements in order to cancel reconstruc-tion errors. Thus, we present the results that we obtained by considering one test pixel. Finally, we evaluate the performance of our correlation process improvements when applied to SIR-C mission data in order to produce a DEM of an area of the French Alps.
3804 IEEE TRANSACTIONS ON GEOSCIENCE AND REMOTE SENSING, VOL. 49, NO. 10, OCTOBER 2011
Fig. 1. One possible radar stereoscopic configuration.
II. BASICS OFRADARGRAMMETRY
A. Principle
Leberl [5] stated that “radargrammetry is the technology of extracting geometric information from radar images.” The main parameters used in the stereoscopic method are absolute parallax p (or disparity) and convergence angle ∆θv. The base-line BS also has an important function as regards the quality and accuracy of terrain reconstruction [20]. Assuming a same-side stereoscopic configuration (the radar scene is located on the same side with respect to the position of the two radars), these parameters are described in Fig. 1. The parallax p of an observed point is directly connected to its elevation and increases according to its altitude h. The convergence angle ∆θv= θv1− θv2is defined by the intersection of the two lines of sight of the radar; this angle increases as the baseline BS rises. For satellites, the altitude h can be defined as
h = p
cot θv1− cot θv2
. (1)
For same-side configurations, a large baseline makes it possible to achieve good geometry for stereo plotting because of the increase in parallax values. The higher the parallax value is, the more accurate the elevation reconstruction will be. In opposite-side configurations (the radar scene is located between the two radars), the large baseline results in precise stereo plotting. However, the radiometric and geometric differences between the two radar images are so great that matching is almost impossible without image preprocessing [20].
B. Matching Step
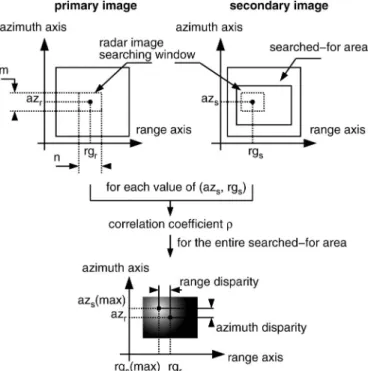
The objective of radargrammetry is to match two radar images using “registration” processing. The registration step aligns two images viewed from different positions, containing the same radar scene. The aim of the matching step applied to the stereopair radar images (primary image and secondary image) is to obtain a dense description in order to achieve the required image registration accuracy. The most common image-matching method is area correlation. For a given area in the primary image, the matching computation has to detect the closest corresponding area in the secondary image by searching for its best match. The standard method of finding matching areas is to use analytical metric comparison, while the zero-mean normalized cross correlation (ZNCC) can be applied to
Fig. 2. Matching operations between the primary image and the secondary image.
radar image searching windows of radar images. The result of the ZNCC computation is given by the cross-correlation coefficient ρ and can be stated as follows:
ρ = E[I!1I2]− E[I1]E[I2] V (I1)V (I2)
(2) where I1 and I2 represent the amplitude values of the pixels of the primary and the secondary image windows, respectively. These windows are defined by an n-by-m pixel window which are the sizes along the range and azimuth axes, respectively. The expression of E[·] gives the mean expectation, whereas V [·] is the variance expression. The value of ρ is bounded by (−1) and (+1), and the windows are considered to be matched for the maximum value of ρ. The coefficient ρ is calculated using (2) for each position (azs and rgs) of the radar image searching window in the searched-for area. We also compute a correlation surface, obtained with the values of the coefficient ρ. The maximum value of this surface gives the disparity (dispaz) along the azimuth axis (dispaz =|azs(max)− azr|) and the disparity (disprg) along the range axis (disprg= |rgs(max)− rgr|). This ρ calculation step is carried out for each pixel in the primary image in order to obtain the disparity map. Fig. 2 shows the correlation computation applied to one pixel inside the primary image. Once the matching operation has been completed, we obtain the disparity map. However, the disparity values should be considered according to confi-dence in the correlation coefficient. When the highest value inside a correlation surface can be precisely detected and the corresponding position is obvious, we achieve a high degree of confidence correlation. However, when the maximum posi-tion cannot be clearly obtained, the confidence correlaposi-tion is considered as low, and large main lobes or high sidelobes occur for the correlation surface. In this case, additional noise can modify the results of the disparity map, and refinements such
as speckle reduction and pyramidal procedure must be applied to strengthen the correlation results. Several refinements can be applied to improve the matching operation. One way to reduce the false matching result is to limit the search area for the correlation windows. Thus, we apply an epipolar constraint [21] between radar images and also reduce the search for the matched window along the azimuth axis. Epipolar geometry considerably reduces the size of the search area, so when matching one pixel, there are fewer candidates on the secondary image than with a larger window. In our case, the disparity value along the azimuth axis is almost null, and for a given pixel, its homologue is located on an epipolar line along the range axis (see Fig. 3). If SAR data are collected at nonzero Doppler, the Doppler sensitivity regarding height and azimuth displacements between the SAR images must be taken into consideration. However, for the SIR-C data that we used, this displacement is sufficiently small (less than one pixel) that we only take into account a fine strip (three pixels) along the azimuth axis in the search for the matched window. Thus, we can ignore the along-track disparity and consider that the position of the homologous pixel is only significant along the range axis. The correlation surface, obtained by sorting the values of ρ, can be consequently represented by a correlation profile along the range axis. It is well known that the speckle phenomenon affects the interpretation of a radar image, and this phenomenon is undesirable for radargrammetric applications. Thus, speckle reduction is required prior to image analysis in order to improve the use of radar images in radargrammetry. This can be achieved in two ways: multilook processing and filtering techniques applied to the SAR image. Finally, a hierarchical strategy can be considered to enhance the accuracy of the DEM [22]. From the original image, we build an image pyramid. At each level, the image size is reduced by a factor of two. Radargrammetry is applied to each step, and for each iteration, the matching process makes it possible to establish an approximate disparity map. Thus, we are able to predict the disparity offsets at the next level of the hierarchical process. In the final step, the last disparity map is used to produce a DEM. In our case, the original image studied is reduced from 352-by-304 pixels to 88-by-76 pixels, which means that the radargrammetric pro-cessing is achieved through three steps.
C. Computation of the Radar Stereo Model
The objective of this step is to extract 3-D geometric data from stereopair radar images by using the coordinates (position
at the perpendicular direction of the radar beam [24]. The intersection of the range sphere and the Doppler plane provides two solutions, but only one can be right according to the direction of the radar beam. Deriving from the exact solution to the stereo equations given in [25] and considering the small Doppler centroid for the SIR-C data, the solution (x, y, z) of the search point satisfies the following equation:
(x− X1)2+ (y− Y1)2+ (z− Z1)2 = r21 (x− X1) ˙X1+ (y− Y1) ˙Y1+ (z− Z1) ˙Z1 = 0 (x− X2)2+ (y− Y2)2+ (z− Z2)2 = r22 (x− X2) ˙X2+ (y− Y2) ˙Y2+ (z− Z2) ˙Z2 = 0 (3)
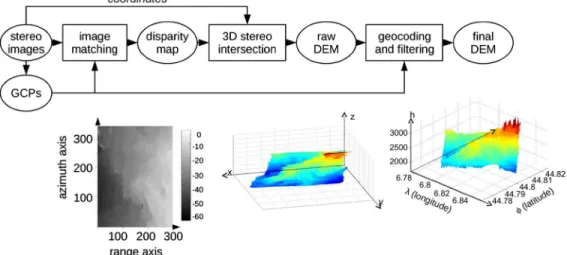
where the position (X(1,2), Y(1,2), Z(1,2)) and the velocity ( ˙X(1,2), ˙Y(1,2), ˙Z(1,2)) of the radar must be known. Also, the raw DEM is directly obtained by resolving the system (3) for all the pixels of the radar image. To quantify the accuracy of our elevation reconstruction, we compared it to the Shuttle Radar Topography Mission (SRTM) DEM [26]. We also applied a geocoding operation in order to be able to process the compar-ison. Fig. 4 shows an overview of our entire radargrammetric process. As mentioned previously, we notice that some ground control points (GCPs) may be required in order to refine the stereo model parameters [18].
III. MULTIWINDOWAPPROACH AS ANORIGINAL
IMAGE-MATCHINGIMPROVEMENT
A. Available Data
The DEM reconstruction results that we exhibit were ob-tained by applying our radargrammetric operations to data on an area of the French Alps, recorded in April 1994 by the space shuttle Endeavour during the SIR-C mission (PR17310 and PR17429 satellite paths). The two radar images (1500-by-3000 pixels) are recorded at incidence angles of 35.7◦and 50.1◦, respectively. Furthermore, the range resolution of these SAR images is 27.1 m. Because we apply multilook processing (four looks), we get a 24.8-m azimuth resolution. Moreover, a Lee speckle filtering operation using a 5-by-5 pixel window size is applied in order to reduce the speckle phenomenon. Finally, three GCPs are required in order to compensate for satellite position and velocity inaccuracies. Fig. 5 shows the study areas on which our radargrammetric processing was applied. These areas were chosen because specific radar image characteristics are included: foreshortening and shadowing effects on the one hand and homogeneous and heterogeneous areas on the other
3806 IEEE TRANSACTIONS ON GEOSCIENCE AND REMOTE SENSING, VOL. 49, NO. 10, OCTOBER 2011
Fig. 4. Radargrammetric processing overview.
Fig. 5. Study areas from the SIR-C stereopair SAR images.
hand. As explained earlier, stereo configuration is critical on high-relief areas because the two images show many radiomet-ric and geometradiomet-ric differences. Since the reliability of terrain reconstruction is very dependent upon the matching results, the generated DEM is not accurate enough. Our current studies focus on this point by applying original improvements at the matching step. First, we propose to show the results of our improvement methods by trying to match a test pixel inside the primary image with its homologous pixel inside the secondary image. Its relative position, i.e., 11 in the range direction (see Fig. 6), is given by operator-based matching. Second, we apply the proposed image-matching method to the whole study area, and we exhibit the comparison between our DEM and the SRTM one. This comparison is done at the first step and at the last step of the pyramidal scheme.
B. Combining Correlation Surfaces (Method #1)
For a homogeneous structure, we notice that a wide correla-tion window is required in order to collect useful informacorrela-tion for the matching process, whereas a heterogeneous image only needs a small correlation window to be correctly matched. Rather than work with a unique size n-by-m for the correlation windows (n along the range axis and m along the azimuth axis), we use several correlation window sizes in order to
Fig. 6. Relative position of the homologous pixel to the pixel inside the primary image.
obtain additional information on the area. Furthermore, in our case, we propose matching four correlation windows, whose sizes are 23-by-23 pixels, 19-by-19 pixels, 13-by-13 pixels, and 7-by-7 pixels. For each window size, we compute the cross-correlation coefficients, obtaining a correlation profile by sorting the values of these coefficients. Finally, we combine the different information from each of the four correlation profiles
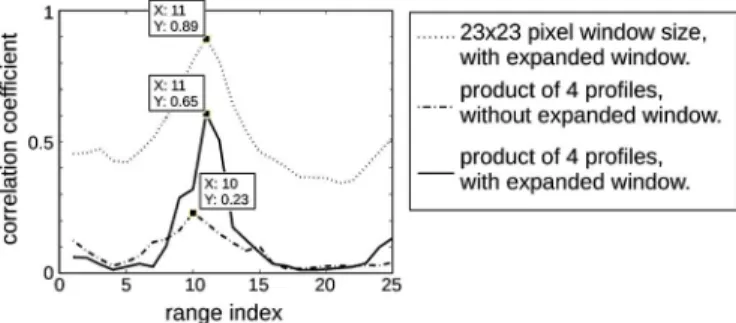
by multiplying them to obtain a unique profile. One of the main objectives of this operation is the right location of the homologous pixel. This can be achieved by the cancellation of the correlation profile sidelobes, which induces a refined peakedness of the main lobe of the correlation profile as shown in Fig. 7. The correlation-coefficient values of this profile are used as confidence levels for the correlation result. Thus, the position of the maximum correlation coefficient defines the position of the matching pixel. Considering the test pixel, the correlation profiles that are shown in Fig. 7 are obtained for the 7-by-7 pixel and 23-by-23 pixel windows (we only show two profiles in order to have the clearest figure). Moreover, we exhibit the correlation profile of the product correlation profile along the range direction. Considering the position of the homologous pixel, these results mismatch because the range indexes (index 10 for the 7-by-7 pixel window and index 8 for the 23-by-23 pixel window) are obviously different. Further-more, the range profiles of the correlation surface are quite different. On the one hand, the position of the maximum is obvious for the 7-by-7 pixel window, but some sidelobes appear along the range profile for this small correlation window. On the other hand, the confidence level of the 23-by-23 pixel window profile could not be sufficient because of the low value of the maximum. Finally, considering the profile of the product, the index value of the homologous pixel determined is equal to 10, which almost corresponds to the true value, which is 11. Moreover, no obvious sidelobe occurs for the correlation profile combination, an important contributing factor to the decision to choose the homologous pixel.
C. Expanded Correlation Windows (Method #2)
As mentioned previously, the matching operation tends to fail for pixels located in foreshortened areas particularly. There-fore, we notice bad DEM reconstruction around these areas. Thus, the main objective of the expanded correlation window improvement is to reduce the bad matches occurring for steep areas and resulting from the foreshortening effect between the two images. For such areas, the higher the difference of the an-gle of incidence between the primary and the secondary images, the more different the resulting images. As a consequence, the correlation windows in the primary and secondary images are not similar enough (see the black boxes in Fig. 8) to provide a reliable match. In order to avoid mismatching, the secondary correlation window is truncated along the range axis from n
Fig. 8. Example of the procedure used when expanding correlation windows.
Fig. 9. Range profiles for several values of k for expanded correlation windows.
pixels to k pixels (k ≤ n). We only change the range size n of the window because this axis is particularly affected by the foreshortening effect of the radar image. Afterward, this extracted pattern is enlarged to retrieve the original window size and gives a secondary expanded window (see Fig. 8). The range resampling method used to extend the extracted pattern performs a bilinear interpolation as an extension of the linear interpolation for interpolating images. This secondary expanded window and the primary one are matched through the matching step. As we have no information about the range compression ratio, the minimum value of k, which corresponds to the maximum compression effect, is estimated with respect to the terrain slope of the studied site. Then, based on the 23-by-23 pixel size for the primary window, we generate different truncated secondary window sizes (k-by-m) from 11-by-23 pixels to 23-by-23 pixels. The right value of k is obtained when the maximum coefficients of the cross-correlation operations raise the maximum. A more detailed study (see Section IV) establishes a basic relationship between the stretching factor ks= k/n and the slope value. For the test pixel, the value of k that maximizes the correlation coefficient is k = 15 (see Fig. 9). The maximum value of the corresponding correlation coefficient located at range index 11 is about 0.89, whereas it is 0.65 at range index 8 for the 23-by-23 pixel window size (see Fig. 7). Therefore, the index value of the homologous pixel is corrected, giving a better attached confidence value. Also, the method described makes it possible to compensate for the radar range foreshortening phenomenon.
3808 IEEE TRANSACTIONS ON GEOSCIENCE AND REMOTE SENSING, VOL. 49, NO. 10, OCTOBER 2011
Fig. 10. Correlation profile comparison for different improvement methods in the matching step.
TABLE I
RECONSTRUCTIONERRORS OF THEGENERATED
DEMsIN THEFIRSTPYRAMIDALSTEP
D. Combining Both Improvement Methods (Method #3)
In order to further improve the DEM reconstruction ac-curacy, we take advantage of the two methods described in Sections III-B and C by combining them. While the method based on the expansion of the correlation window only works with a value of m equal to 23, the combination of improvements applies the expansion method to each m value (m ∈ {7, 13, 17, 23}) used by the multiplication profile procedure (method #1). For each value of m, the correlation profile that gives the maximum correlation coefficient is selected. Then, we multiply the four selected profiles to obtain the final unique profile. The test pixel results in a correlation profile using this procedure are sharper than the ones obtained with the other improvements (see Fig. 10).
E. Results
In order to generate a DEM, we apply both matching-step improvement methods (including ZNCC) to the study area described in Fig. 5. The quantitative accuracy results are per-formed over the entirety of the zone covered by the SRTM data. The elevation reconstruction is compared to the elevation data obtained during the SRTM. According to Rodriguez et al. [26], a C-band SAR-derived DEM has a global absolute vertical accuracy of less than 16 m. Moreover, we derive from the height expression (4) the relationship between the disparity error ∆p and the height error ∆h
∆p = ∆h(cot θv1− cot θv2). (4) It should be noted that our extracted DEM has to be regridded in order to fit with the description of the SRTM DEM. Indeed, as it is shown in Fig. 4, the 3-D stereo intersection procedure results in a “cloud” of 3-D points. The results of the comparison of our extracted DEMs with the SRTM DEM are summarized both in the first step (Table I) and in the last step (Table II) of the
TABLE II
RECONSTRUCTIONERRORS OF THEGENERATED
DEMS IN THELASTPYRAMIDALSTEP
TABLE III
RECONSTRUCTIONERRORS OF THEGENERATEDDEMSCOMBINING
BOTHIMPROVEMENTMETHODSUNTIL THELASTPYRAMIDALSTEP
pyramidal scheme. As expected, we note a significant improve-ment in reconstruction accuracy using our new image-matching methods instead of the one based only on the ZNCC operation. Also, for the first pyramidal step, we notice an improvement on the accuracy obtained with the ZNCC matching method. Therefore, in the first pyramidal step, the disparity map gen-erated combining both methods (method #3) is more accurate and reliable than the disparity map generated by method #1 and method #2. However, contrary to the results obtained in the first pyramidal step, method #3 does not lead to improved results in the final step. Even if this method is efficient in the first step, applying it to all steps of the pyramidal scheme leads to worse results compared to method #2. Thus, for the first step, we decide to keep the method giving the best results, i.e., method #3. For the following steps, we apply the other methods in order to test the efficiency of each combination. The results are shown in Table III. Applying method #3 in the first step and method #2 in the following steps gives exactly the same results as applying method #2 in all the steps (see Table II). However, we recall that the disparity map generated using method #3 in the first pyramidal step is more accurate and reliable than the disparity map generated applying method #2. Thus, we recommend a combination of the two improvement methods (method #3 and then method #2) in order to ensure maximum accuracy and reliability throughout the radargrammetric process [27].
IV. DISCUSSION
Several methods are analyzed to increase DEM accuracy by obtaining greater match reliability. The results that we obtained for each method give rise to some issues related to the characteristics of the study area.
First, for method #1, we propose to use different correlation window sizes for the homogeneous or heterogeneous structure of the correlation window. The size and the number for the different correlation windows are arbitrarily chosen. Thus, fur-ther work could deal with an image-matching algorithm, taking
into account an adaptive window with respect to the statistical behavior of the SAR image in order to improve the confidence of the matching computation.
Second, method #2 proposes to extend correlation windows in order to mitigate the range foreshortening effect. The stretch-ing factor ks, defined in Section III-C, can be derived from the expression of the foreshortening equation, given the fore-shortening factor kf, considering the incidence angle θv and the slope θ of the terrain (see Fig. 11)
kf =
1
sin [θv− arctan(θ)]
(5) where the foreshortening kf is also given with kf = d/d%and the slope θ is determined with θ = h/x. Considering (5), kf 1 and kf 2represent the foreshortening factors for the primary and the secondary images, regarding the incidence angles θv1 and θv2, respectively. We can thus derive the stretching factor ks given for an observed slope
ks= kf 2/kf 1. (6) Equation (6) is obtained under the assumption of a constant cross-track slope θv. Thus, an rms slope variation relative to the mean slope within a correlation window will give an approxi-mative value for the stretching factor ks. The significance of the correlation window size should once again be noted.
Moreover, in the case of our hierarchical scheme, the predic-tion of the stretching factor kf for each iteration allows us to reduce the number of possible values of kf at the next level of the radargrammetric hierarchical process. Thus, the pyramidal methodology applied to the stretching factor fixing obviously induces better accuracy of the DEM and gives computational advantages.
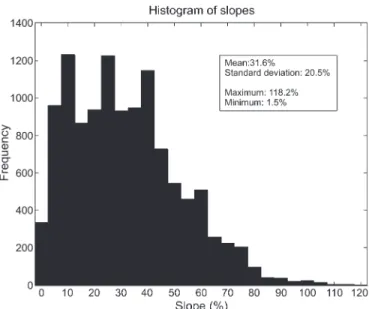
Finally, considering the different methods, we note a signif-icant improvement in reconstruction accuracy (98.0% of pixels with an error less than 100 m and 85.5% of pixels with an error less than 50 m). From our studies, we can draw two major statements. First, the study area that we get is a very demanding one with respect to the high relief involved. Second, the intersection angle value accentuates the foreshortening ef-fect occurring in the mountainous area. We can conclude that our improved matching methods are quite efficient for such steep terrain. In order to provide a quantitative indication of the slope amount, we can consider the histogram of the slopes (see Fig. 12) for the studied area.
Fig. 12. Histogram of the slopes for the studied area.
V. CONCLUSION ANDFURTHERDEVELOPMENT
In this paper, we have presented the relevance of using stereoscopic radar images in order to retrieve the DEM of terrain and the way to improve the accuracy of this DEM for a mountainous area. The accuracy of the reconstruction of terrain depends on the success of the matching operation. Moreover, the generated DEM is not accurate enough because this match-ing operation tends to fail for pixels located in foreshortened areas particularly. Thus, we have suggested improvements in order to cancel reconstruction errors. The first improvement takes advantage of a multiwindow approach which combines information by multiplying the correlation surfaces obtained for each correlation window size. The second improvement is based on the expansion of windows on foreshortened areas. Finally, we combine these two improvement methods. Consid-ering that the high-relief area studied is a challenging one for matching operations, we can say that our methods are very appropriate for this kind of area. These encouraging results allow us to study further improvements.
In the first instance, it would be interesting to establish a confidence map in order to clearly indicate the area charac-terized by low-level confidence. Second, we have proposed to multiply the correlation profiles for different window sizes, allowing us to investigate some weighted functions (based on the integrated sidelobe ratio, for example) in order to improve the correlation profile sidelobe suppression. Third, the amount of foreshortening factor for a SAR image is calculated in the first step without knowledge of the local slope. This a priori knowledge of the slope would be essential to apply method #2 in the first step. Finally, further work could deal with an image-matching algorithm, taking into account an adaptive window with respect to the statistical behavior of the SAR image.
ACKNOWLEDGMENT
The authors would like to thank the editor and the anonymous reviewers for their suggestions and time to improve the quality of this paper.
3810 IEEE TRANSACTIONS ON GEOSCIENCE AND REMOTE SENSING, VOL. 49, NO. 10, OCTOBER 2011
REFERENCES
[1] G. La Prade and E. Leonardo, “Elevations from radar imagery,”
Photogramm. Eng., vol. 35, no. 4, pp. 366–371, Apr. 1969.
[2] D. Massonnet and T. Rabaute, “Radar interferometry: Limits and poten-tial,” IEEE Trans. Geosci. Remote Sens., vol. 31, no. 2, pp. 455–464, Mar. 1993.
[3] D. L. Schuler, J. Lee, and G. De Grandi, “Measurements of topography using polarimetric SAR images,” IEEE Trans. Geosci. Remote Sens., vol. 34, no. 5, pp. 1266–1277, Sep. 1996.
[4] G. La Prade, “An analytical and experimental study of stereo for radar,”
Photogramm. Eng., vol. 29, no. 2, pp. 294–300, Mar. 1963.
[5] F. Leberl, Radargrammetric Image Processing. Norwood, MA: Artech House, 1990.
[6] C. Gonzales de Oliviera and W. R. Paradella, “An assessment of the altimetric information derived from spaceborne SAR (RADARSAT-1, SRTM3) and optical (ASTER) data for cartographic application in the Amazon region,” Sensors, vol. 8, no. 6, pp. 3819–3829, Jun. 2008. [7] B. Pradhan, T. Bolch, and M. Buchroithner, “Elevation modeling using
radargrammetry: Case study from Malaysia,” in Proc. AGILE, 2009, pp. 1–11.
[8] A. Renga and A. Moccia, “Performance of stereoradargrammetric methods applied to spaceborne monostatic–bistatic synthetic aperture radar,” IEEE Trans. Geosci. Remote Sens., vol. 47, no. 2, pp. 544–560, Feb. 2009.
[9] H. Lee, “Radargrammetry of high resolution synthetic aperture radar on-board KOMPSAT-5,” in Proc. IEEE IGARSS, Honolulu, HI, Jul. 25–30, 2010, pp. 1246–1249.
[10] H. Raggam, K. Gutjahr, R. Perko, and M. Schardt, “Assessment of the stereo-radargrammetric mapping potential of TerraSAR-X multibeam spotlight data,” IEEE Trans. Geosci. Remote Sens., vol. 48, no. 2, pp. 971– 977, Feb. 2010.
[11] T. Toutin, “Impact of RADARSAT-2 SAR ultrafine-mode parameters on stereo-radargrammetric DEMs,” IEEE Trans. Geosci. Remote Sens., vol. 48, no. 10, pp. 3816–3823, Oct. 2010.
[12] P. Paillou and M. Gelautz, “Relief reconstruction from SAR stereo pairs: The “optimal gradient” matching method,” IEEE Trans. Geosci. Remote
Sens., vol. 37, no. 4, pp. 2099–2107, Jul. 1999.
[13] F. Tupin and J.-M. Nicolas, “Matching criteria for radargrammetry,” in
Proc. IEEE IGARSS, Toronto, ON, Canada, Jun. 24–28, 2002, vol. 5, pp. 2608–2610.
[14] G. Oller, P. Marthon, and L. Rognant, “Edge detection and extraction for SAR images,” in Proc. IEEE IGARSS, Toulouse, France, Jul. 21–25, 2003, pp. 4004–4006.
[15] D. Brunner, G. Lemoine, L. Bruzzone, and H. Greidanus, “Building height retrieval from VHR SAR imagery based on an iterative simulation and matching technique,” IEEE Trans. Geosci. Remote Sens., vol. 48, no. 3, pp. 1487–1504, Mar. 2010.
[16] S. Hensley and S. Shaffer, “Automatic DEM generation using Magellan stereo data,” in Proc. IEEE TGRS, Pasadena, CA, Aug. 8–12, 1994, vol. 3, pp. 1470–1472.
[17] R. Frankot, S. Hensley, and S. Shaffer, “Noise resistant estimation tech-niques for SAR image registration and stereo matching,” in Proc. IEEE
IGARSS, Pasadena, CA, Aug. 8–12, 1994, vol. 2, pp. 1151–1153. [18] S. Méric, F. Fayard, and E. Pottier, “Radargrammetric SAR image
pro-cessing,” in Geoscience and Remote Sensing. Rijeka, Croatia: In-Tech, Oct. 2009, pp. 421–454.
[19] F. Fayard, S. Méric, and E. Pottier, “Generation of DEM by radargrammet-ric techniques,” in Proc. IEEE IGARSS, Honolulu, HI, Jul. 25–30, 2010, pp. 4342–4345.
[20] T. Toutin and L. Gray, “State-of-the-art of elevation extraction from satel-lite SAR data,” ISPRS J. Photogramm. Remote Sens., vol. 55, no. 1, pp. 13–33, Feb. 2000.
[21] Z. Zhang, R. Deriche, O. Faugeras, and Q. Luong, “A robust technique for matching two uncalibrated images through the recovery of the un-known epipolar geometry,” Artif. Intell., vol. 78, no. 1/2, pp. 87–119, Oct. 1995.
[22] M. Denos, “A pyramidal scheme for stereo matching SIR-B imagery,” Int.
J. Remote Sens., vol. 13, no. 2, pp. 387–392, Jan. 1992.
[23] L. Polidori, Cartographie Radar. New York: Gordon and Breach Science, 1997.
[24] P. Chen and I. Dowman, “A weighted least squares solution for space intersection of spaceborne stereo SAR data,” IEEE Trans. Geosci. Remote
Sens., vol. 39, no. 2, pp. 233–240, Feb. 2001.
[25] S. Hensley, “A combined methodology for SAR interferometric and stereometric error modeling,” in Proc. IEEE RADARCON, Pasadena, CA, May 4–8, 2009, pp. 1–6.
[26] E. Rodriguez, C. Morris, J. Belz, E. Chapin, J. Martin, W. Daffer, and S. Hensley, “An assessment of the SRTM topographic products,” Jet Propulsion Lab., Pasadena, CA, Tech. Rep., 2005.
[27] F. Fayard, S. Méric, and E. Pottier, “Radargrammetric improvements: A multi-window approach,” in Proc. EUSAR, Aachen, Germany, Jun. 8–10, 2010, pp. 766–769.
Stéphane Méric (M’08) received the B.S. degree in
electrical engineering from the National Institute of Applied Sciences (INSA), Rennes, France, in 1991, the M.S. degree in signal processing and telecommu-nications from the University of Rennes 1, Rennes, in 1991, and the Ph.D. degree in electronics from INSA in 1996.
Since 2000, he has been an Assistant Professor with INSA, where he joined the SAPHIR Team, Institute of Electronics and Telecommunications of Rennes (CNRS UMR 6164), in 2005. He is interested in using synthetic aperture radar (SAR) data in radargrammetric ap-plications. Furthermore, he is currently working on radar systems (continuous-wave and frequency-modulated continuous-(continuous-wave radar systems) dedicated to specific SAR applications (radar imaging in motorway context, remote sensing, multiple-input–multiple-output configurations, and passive radar imaging). His education activities are about analog electronics, signal processing, radar and radar imaging, and electromagnetic diffraction.
Franck Fayard received the B.S. degree in electrical
engineering, the M.S. degree in electronics, and the Ph.D. degree in electronics, for his research works including synthetic aperture radar image process-ing and radargrammetric applications, from the Na-tional Institute of Applied Sciences (INSA), Rennes, France, in 2004, 2004, and 2010, respectively.
Since 2010, he has been in a postdoctoral posi-tion at the Signal and Image Processing Department (TSI), Télécom ParisTech, Paris, France. He is par-ticularly interested in registration of radar and optical satellite images, radargrammetric applications, and 3-D reconstruction.
Éric Pottier (M’95–SM’06–F’11) received the
M.Sc. and Ph.D. degrees in signal processing and telecommunication from the University of Rennes 1, Rennes, France, in 1987 and 1990, respectively, and the Habilitation from the University of Nantes, Nantes, France, in 1998.
Since 1989, he has supervised more than 30 research students to graduation (Ph.D.) in radar polarimetry covering areas from theory to remote sensing applications. Since 1999, he has been a Full Professor with the University of Rennes 1, where he is currently the Deputy Director of the Institute of Electronics and Telecommunications of Rennes (CNRS UMR 6164) and also the Head of the Image and Remote Sensing Group, SAPHIR Team. He has published a book coauthored with Dr. J. S. Lee in 2009, nine publications in books, and more than 50 papers in refereed journals and has presented more than 330 papers during international conferences, symposia, and workshops. He has presented advanced courses and seminars on radar polarimetry to a wide range of organizations (DLR, NASDA, JRC, RESTEC, and IECAS) and events (ISAP2000, EUSAR’04, EUSAR’06, EUSAR’10, NATO’04, NATO’06, PolInSAR’05, PolInSAR’11, JAXA’06, IGARSS’03, IGARSS’05, IGARSS’07, IGARSS’08, IGARSS’09, and IGARSS’10). His current activi-ties of research and education are centered in the topics of analog electronics, microwave theory, and radar imaging with emphasis on radar polarimetry. His research covers a wide spectrum of areas from radar image processing (synthetic aperture radar and inverse synthetic aperture radar), polarimetric scattering modeling, and supervised/unsupervised polarimetric segmentation and classification to fundamentals and basic theory of polarimetry.
Dr. Pottier was the recipient of the Best Paper Award at the Third European Conference on Synthetic Aperture Radar (EUSAR2000) and the 2007 IEEE GRS-S Letters Prize Paper Award. He was also a recipient of the 2007 IEEE GRS-S Education Award “in recognition of his significant educational
contributions to geoscience and remote sensing.” He has chaired and organized 35 sessions in international conferences and was a member of the technical and scientific committees of 32 international symposia or conferences. He has been invited to present 46 presentations in international conferences.