HAL Id: hal-00696978
https://hal-mines-paristech.archives-ouvertes.fr/hal-00696978
Submitted on 15 May 2012
HAL is a multi-disciplinary open access archive for the deposit and dissemination of sci-entific research documents, whether they are pub-lished or not. The documents may come from teaching and research institutions in France or abroad, or from public or private research centers.
L’archive ouverte pluridisciplinaire HAL, est destinée au dépôt et à la diffusion de documents scientifiques de niveau recherche, publiés ou non, émanant des établissements d’enseignement et de recherche français ou étrangers, des laboratoires publics ou privés.
economics of platform shift in high technological velocity
environments
Yacine Felk, Pascal Le Masson, Benoit Weil, Patrick Cogez
To cite this version:
Yacine Felk, Pascal Le Masson, Benoit Weil, Patrick Cogez. Advanced R&D for prepositioning strate-gies: the economics of platform shift in high technological velocity environments. International Prod-uct Development Management Conference, 2010, Spain. pp.20. �hal-00696978�
1
ADVANCED R&D FOR PRE-POSITIONING STRATEGIES:
THE ECONOMICS OF PLATFORM-SHIFT IN HIGH TECHNOLOGICAL VELOCITY ENVIRONMENTS
Authors: Yacine Felk(1)(2), Pascal Le Masson(1), Benoit Weil(1), Patrick Cogez(2)
(1)
MINES Paristech, CGS- center for management science, Paris, France.
(2)
Technology R&D, STMicroelectronics, Crolles, France.
Keywords: Innovation, Platform, R&D, New Product Development, Semiconductor. Abstract
This paper addresses the design of platform, and more precisely the economics of platform shift in industries with high technological velocity. A platform consists in fixing some design dimensions (such as basic components, modules or processes) to get better performance on some other dimensions (flexibility of alternative development, enhanced variety, lower costs). Platform design consists in using a stock of design rules to find the right balance between fixed parameters and to be defined parameters for a certain time period. In high technological velocity (HTV) environment this time period can become very short so that platform renewal becomes critical. Moreover in this HTV environment, the stock of design rules becomes obsolete so that platform renewal can take several forms: this can range from “adaptation” (development activity makes the optimal use of existing stock) to “anticipation” (research activity produces new design rules to prepare the development of the next platform).
In this paper we propose an economic model of platform renewal to compare these strategies, depending on the technological velocity. We show where anticipation and adaptation are relevant and what is the optimal research level compared to development. Moreover we show that an alternate strategy, called “prepositioning”, based on Advanced R&D (ARD) and consisting in renewing the stock of design rules for several generations, would be interesting in case of HTV.
We then illustrate its insights through a case study in a typical HTV industry, semiconductor industry. This enables us to propose an explanation of complex platform renewal strategies. The article closes with managerial implications and directions for further research in platform renewal.
2
Introduction
Throughout the last twenty years, the concept of product family based on product platforms has been introduced for solving problems linked to fast product development, short life-cycles and customized product requirements. Many companies adopted a platform approach to increase standard parts, reduce costs and shorten product design lead-times. A common theme that cuts across the literature on platform is what kind of strategies make organizations more or less likely to succeed in new platform introduction. In this paper we focus on the design of platform, and more precisely the economics of platform shift, in industries with high technological velocity.
Nowadays, in many industries such in semiconductors we observe a very fast platform renewal based on unusual organizational logics. For a same product family, some platform-core are based on development activities whereas some others are based on both research and development activities. These kinds of platform renewal logics suggest several questions about both Research and Development attributes (are these activities based on anticipation, reaction or other strategies) and indicators of its efficiency. Thanks to a simplified analytical model we describe the two main platform renewal strategies identified through the literature review and expose what mixed strategies could be. We then illustrate its use through a case-study in the semi-conductor industry. This paper reports the preliminary results of an ongoing study in an IDM (Integrated Device Manufacturer) firm in a High-Technological Environment (the semiconductor industry), where overall aim is understanding what are high velocity environments impacts on platform renewal strategies, modeling the environment velocity in the one hand and the firm’s capabilities and innovative decisions technology investments undertaken on the other hand. For that purpose, we carried out an in-depth case study of radical change in the semiconductor industry in order to analyze research project contribution to platform development. The case study develops the idea that the dynamics of platform evolution rely on design rule renewal. This analysis led us to three results; the first one is that we pointed out the existence of specific research activities that embody both market as well as technical principal in order to define planed and repeated breakthroughs. The second one is that in high velocity markets, research activities enable pre-positioning strategies (based on robustness and value enhancement) in order to sustain flexible platform development. Finally, we show that research activities enable smooth transitions from an old platform to a new one. The objective of this paper is to give some insights on how to manage platform shift or renewal and to focus on new design rules introduction process.
Before discussing this, we will review the existing literature on platform design and economical evaluation and show how PF renewal issue has been stressed as a major challenge by many authors and practitioners. We will then present the research setting and our methodology before detailing the different aspects of our model settled to describe the trade-offs between different platform renewal strategies. We then describe our model interpretation through a case-study in high-technological velocity industry. Before concluding, we deepen the discussion of the case-study and relates it to recent development in platform theory.
3
Research background and hypothesis: the economics of platform shift in situation of high velocity technological change.
A gap in the literature: Platform renewal in High Technological Velocity Environments.
Literature is full of historical success stories such as sony’s walkman (Sanderson and Uzumeri 1994) or Black & Decker’s power tools (Meyer and Utterback 1993) product family analysis, which show the relevance of platform strategies for new product development, manufacturing and distribution. Platform is a design strategy that consists in fixing some design dimensions (basic components, processes,…) to get better performance on some other ones (flexibility of alternative development, enhanced variety, lower costs,…) (Krishnan and Gupta 2001) (Uzumeri and Sanderson 1994). Several definitions have been used to qualify a product platform such as a “set of common components, modules and parts from which a stream of derivative products can be efficiently created and launched” (Meyer, Tertzakian et al. 1997) or “the collection of assets that are shared by a set of products” (Robertson and Ulrich 1998) (where assets may include components, processes, knowledge and people) and enables companies to re-use core technologies and other common building blocks for a set of products. Product platforms are often developed along a lead product, a practice that facilitates a development that fulfills concrete product requirements, but requires careful product architecture management to guarantee that the developed platform will be suitable as a product platform. Therefore, platform design consists in designing in advance this balance between fixed and “to be defined” parameters (Martin and Ishii 2002) (Jiao, Timothy et al. 2007) so as to manage the balance between commonality and differentiation needs within a product family. The main idea across the literature is that implementing a platform strategy helps exploiting commonalities between several products and thus is considered as a good mean to better leverage investments (Sawhney 1998) (Ulrich 1995) for new product development (Meyer and Lopez 1995).
As, the concept of platform has been widely accepted as an option to create flexibility and enhance product design efficiency, the literature focused mainly on ex-post case-studies highlighting the relevance of this strategy from a wide variety of industries. Nevertheless, only few works have explored the issue of platform renewal (Sundgren 1999), which has been identified as an open-question for both academics and practitioners. Different empirical works (Baldwin, 1997) (Baldwin, 2002) and research programs (Halman, Hofer et al. 2003) have stressed the issue of platform renewal and design Halman et al. exhibit a striking case, ASML, where platform renewal process could lead “to restrictions on the use of new technologies in a later stage,…, to rigidity in design when a lot of choices have to be made in a very early stage”. They consider that platform renewal is a “white spot” of research on platform. The cases analyzed by the authors (computer industry for Baldwin, semiconductor for ASML case of Halman et al.), are all cases of so-called high velocity environment (Bourgeois and Eisenhardt 1987);( Bourgeois and Eisenhardt 1988).
But not all “high-velocity” environments are critical for platform renewal, on the contrary, literature has also shown that platform appears to be a smart solution in high velocity markets where applications are rapidly obsolete (Eisenhardt 1989). In this kind of situation, modular platforms have been proposed as a solution for designing the balance between fixed and to-be defined parameters for platform so as to increase flexibility and option value. In these environments, platform product strategies are particularly relevant because of the modular architecture that enables to keep a stable platform core and flexible
4
modules. This kind of dynamics has been illustrated in the Software industry (Meyer and Lopez 1995). One of the developed work linked to platform product development is the central concept of “Design Rule” (Baldwin and Clark 1997). A “Design Rule” can be considered as a design decision that decouples other design decision by imposing certain constraints (an interface) on them. More precisely, these are powerful routines defining boundaries that renders complexity manageable by making it possible to run parallel experiments that pursue alternative explorative design paths at the level of modules.
Hence high velocity environment becomes a critical issue for platform renewal when the pace and duration are so high that the design rules themselves have to be changed. This is what we call a high technological velocity environment: this is specific type of high velocity environment where the “technology” can not be kept stable to address market needs. Paradoxically in sone HTV environments like in microelectronic the market needs might be almost known (faster speed,…) but the technology to address these needs are not and even it is known that breakthrough will be required. In this kind of situation, platforms have to be built (to address complex and varied market needs) but platform have also to evolve rapidly to integrate new technologies.
Hence it appears that platform renewal in HTV environment is a gap in the literature. This raises several questions: how are platforms renewed in high technological velocity environment? What are the relevant strategies and economical indicators for platform renewal?
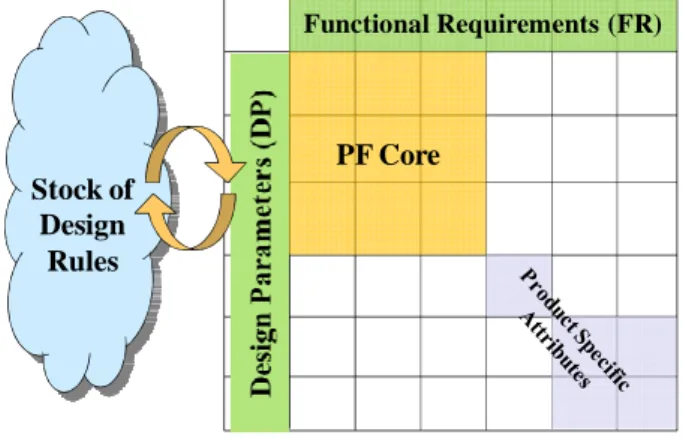
Figure 1: Where do platform knowledge com from: the stock of design rules.
Platform renewal strategies.
Usually fixing platform parameters consists in choosing the best technologies for a more or less uncertain range of products. The components of these technologies (defined as Design Parameters (in Figure 1) come from a stock of design rules which enable to define platform boundaries for each generation. Actually the literature proposes a first platform renewal strategy based on two types of classical approaches, top-down (or functional approach) (Farrel and Simpson 2003) (Simpson, Maier et al. 2001) and bottom up (or consolidation) (Farrel and Simpson 2003).
Top–down is defined as an a-priori approach where “a company strategically manages and develops a family of products based on a product platform and its derivatives”, ie a company partially creates a renewal of the stock of design rules (through research activity, be it technological research or even market research) and then uses a stock of design rules based on available technologies and available market knowledge to design a new platform.
Bottom-PF Core
Functional Requirements (FR)
Stock of Design
5
up approach is when “company redesigns or consolidates a group of distinct products to standardize components to improve economies of scale”. Actually this also means that the company first develops products that help to create a stock of design rules to then develop the platform. Actually top-down and bottom-up processes require a strong anticipation capacity, in order to first develop technology alternatives before development (Meyer and Dalal 2002). In these processes designers are highly knowledgeable on future products and available technologies in order to optimize investments, and some methods such as “conjoint analysis” can help them to define platform-core(Moore, Louviere et al. 1999). In the meantime these approaches are based on strong assumptions about product and functionalities description and the valuable technologies used for platform development. In a nutshell, the literature identifies a first kind of platform renewal strategy (S2) based on anticipation, where designer first prepare the stock of design rules and then, using pre-defined design rules, develop a new platform.
Whereas “anticipation” appears as a “long jump”, a second platform renewal process is based on a kind of local search process (trial/error by limited modifications) guided by performance indicators. In this approach, platform evolution is based on incremental modifications. The design process is a pure development process, using existing competences: there is stock rules (platform designers competences) to design the platform. There is no “research activity” to evolve the stock of design rules in advance.
Different indicators can be used in order to measure platform’s freshness and competitiveness. Meyer and Lehnerd (Meyer and Lehnerd 1997);(Meyer, Tertzakian et al. 1997) define five measures aiming to provide information about when a platform begins to lose its economical advantages and should be updated or replaced. Two of them appear to be relevant for platform performance evaluation, Platform Efficiency measures whether a platform is providing a productive base for derivative products, actually it compares the development costs of derivative products to platform development costs (a rise in platform efficiency rate may indicate that the platform is aging or it has to be renewed). The aim of Platform Effectiveness is to measure the commercial effectiveness of product platform by comparing resources used to design products (engineering costs, manufacturing costs, market development costs) to revenues derived from them over the long term. But even if these indicators give some insights about platform obsolescence, it does not give indicators on the obsolescence of the stock of design rules itself, which is nevertheless one of the critical factors for platform renewal costs.
These elements enable us to define a second kind of platform renewal strategy (S1) based on adaptation, where designers use the existing stock of design rules to redefine an optimal platform.
Regarding performance, it is interesting to note that S1 and S2 are both of them aiming at minimizing design costs and enabling reactive and flexible design strategies. This enable us defining two performance dimensions for platform-renewal strategies, the first one estimating for a generation platform-cost renewal (‘Criteria 1: PF renewal costs optimization’), the second one aiming at measuring the capacity of a firm to develop an original, unique plaform thanks to a specific stock of design rules. With a a better stock of design rules , a firm has a technical competitive advantage; it gains a kind of autonomy in its innovation strategies, a better flexibility and reactivity to outperform the general trend in the industry (which we define as ‘Criteria 2: A reactive capacity, through technical competitive advantage’)
6
Some industries are in the specific situation where for each platform generation, the range of future products is almost known but the range of technologies required is partly unknown. This is particularly the case in high technological velocity industries where these two platform renewal strategies might be considered unsuitable because « platform redesign » might not be innovative enough and « anticipation » might be too expensive and too risky as the objective appear too challenging. This paper targets this gap in the literature: depending on the technological change velocity, where are “anticipation” and “redesign” strategies relevant? Are (S1) and (S2) and their combinations the only identifiable strategies for platform renewal? What are the economic indicators that could help to manage the platform renewal process? What can be a design strategy that enables to prepare platform renewal for several generations (and not only for the next one)? The analysis of the state-of-the-art literature and the remaining research gaps announces three propositions:
P1: In high-technological velocity environments, platform renewal strategies based on S1 are under-optimal for ‘Criteria 1’.
P2-a: S2 strategies for platform renewal in high-technological velocity environments are relevant for platform development cost optimization (‘Criteria 1’).
P2-b: S1 and S2 are not enabling technical competitive advantage for several platform generations (‘Criteria 2’).
P3: There are some strategies (S3) based on design rule renewal that outperforms S1 and S2 for ‘Criteria 2’ and allow to define design strategies for several platform generations.
Research Method
Our aim is to analyze the process through which an organization explores and adopts new design rules in order to prepare platform renewal. We propose an economical model based on classical models of production functions adapted to R&D contexts, ie taking into account the issue of competences which accounts for the variety of forms or platform shift design strategy over time and for their economic performance (i.e their value related to the competitive and technological landscape). We use and exploit “learning curve” modeled by Arrow (Arrow 1962) to model an ‘unlearning effect’ and describe design-rule obsolescence impact on platform development renewal activity, we then explain what are the different platform renewal foreseen and analyze through simulation what are relevant conditions for each of them.
In order to explore this model utility we carried out a field methodology research in a semiconductor manufacturer and analyzed the research project contribution to platform development in a specific case study. As a case-study, we focused on image sensor products, for which there is no technology roadmap (ITRS 2007), so that technology uncertainty is even higher in this range of products. Our case study took place in the unit in charge of exploratory projects (commonly called Advanced R&D) and we worked on one of the main innovation challenges of the “imager” business unit: the design of the next generation (platform) of the image sensors for digital cameras. This case actually implied several research projects, several innovation and development projects. In this context we analyzed in a longitudinal way four platforms and three platform shifts over time. We had access to main economic indicators and could track main R&D projects leading to the successive platforms. This enabled us to identify and discuss several types of platform shift strategies over time and discuss major decisions with managers.
7
This enabled us to track the processes through which new design rules are introduced. This research suggests three proposals discussed in this paper: first, we pointed out the relevance of research activities which embodies market, economic as well as technical principles enabling to manage value creation, integrating all the possible design alternatives into a strategic mapping process. Secondly, we show that in high velocity environments, advanced research projects enable prepositioning strategies in order to sustain platform development and design rules renewal. Finally, in high velocity environments, advanced research projects enable smooth transitions between different platform generations.
A Model for platform shift strategies description.
A model is used to highlight the nature of the incentives of firms to invest in technology, more particularly how firms allocate these investments over different activities such as Research and Development. We concentrate on the nature of the activities and size of the investment budget to differentiate these two different types of technological investments. Technology clockspeed is usually associated to “how rapidly the underlying technology of a platform core is changing” (Fine 1998) (Fine 2000), in our model we propose to describe and define technological velocity as the velocity of design rules obsolescence. A design rule will be considered as “obsolete” when using the same design rule, designers will not be able to define an efficient platform potential to sustain product roadmap. Thus we assume that technological velocity environment will be described by design rule obsolescence velocity from a platform generation to the next one.
Model Variables and Indices:
- : Model Scenario ;
i = H (High-Technological-Velocity), i = L (Low-Technological-Velocity). - : Set of Design Rules that a firm F can use for PF design at generation N in
Scenario i with (0 1 .
- : Set of Design Rules needed for PF development.
- : Costs attributable to PF development using in case 1 or X0 in case 2.
- ′ : Costs attributable to exploration activities and new design-rules proposition.
- " : Costs attributable to experimentation for new design rules definition.
- : Design rule obsolescence rate for one platform generation for scenario i. - : Costs attributable to S1 Platform-Shift strategy in Scenario i.
- : Costs attributable to S2 Platform-Shift strategy in Scenario i. - : Costs attributable to S3 Platform-Shift strategy in Scenario i.
- n : Design-rule life-time expressed in number of platform generations (n). - : Measure of the created design-rules.
- : Number of design rules for a complete design rule stock 1 - : Number of available design rules with
8
Modeling platform-shift strategies: S1 and S2.
In the previous section, we presented through a literature review the analysis of two platform-shift strategies, based on anticipation or adaptation principles and optimizing two kinds of criteria: investments and platform flexibility. In this part, we propose a model which enables to compare S1 (Simpson, Maier et al. 2001) (Farrel and Simpson 2003) and S2 (Rosenberg 1990) and define, depending on environments velocity when each kind of strategy is relevant.
Three main assumptions are underlying the proposed model. First, we propose to consider platform value as an exogenous parameter, this is particularly relevant in High-Technological Velocity environments where value is linked to product roadmaps (such in electronics, or semiconductor). We thus consider that platform performance is mainly defined by its development costs (H1) which means that a well-designed platform is a cheap platform that can be developed in a short time and enables to catch main market opportunities for a given time-window. The second assumption (H2) is linked to platform renewal time-pacing. Whereas, insights from the literature (Meyer and Mugge 2001) define a strategy that consists in extending a platform as long as possible, we consider that in High Technological Environments, time-pacing is known and that platform life-time is defined (H2) ( such as in semiconductor industry through platform roadmaps (ITRS 2007)). Therefore, platform succession is known and what we aim to model are the different strategies that enable to propose an efficient platform at a given time. Finally, the last underlying assumption is made on platform development costs where we aggregate at each generation all the required costs for defining a valuable and reliable platform (H3). These assumptions will be discussed in the fourth part of this paper. Now that we expressed the assumptions underlying our model let’s define how we distinguish the different strategies for platform renewal.
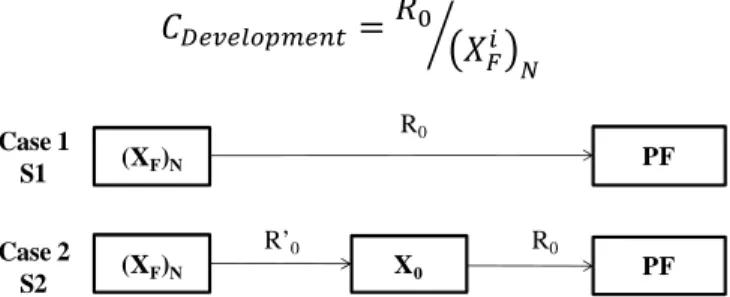
This model is based on the representation of firm capabilities (Development or both Research and Development competencies: see Figure 1) and the definition of two cases illustrating S1 and S2 strategies. In the first one, Development capacity is defined as the capacity of design teams to exploit existing and available design rules in order to develop a new platform. Whereas, for a highly-skilled design team, we consider that (XF)N=1 and
platform development costs R0, here, the aim is modeling the development effort made by a
team with only limited experience and knowledge. Hence we look at modeling a kind of “unlearning” effect due to rapid knowledge obsolescence. As several studies have demonstrated the learning phenomenon in several activities (Rapping 1965) (Hirschmann 1964) (Joskow and Rose 1985), with S1 we model the opposite effect of Arrow’s (Arrow 1962) “learning by doing” phenomenon and ride learning curve in the opposite direction. Thus in S1, we consider that the firm has only development capacities which allow developing a platform using (XF)N (the available design rules), in analogy to these
approaches we propose to consider that the exploitation of existing design rules activity (as a fine-tuning capacity) will have such an expression:
!"#"$%&'"() ,* +
Figure 2: Platform-shift design strategies S1 and S2.
(XF)N PF R0 Case 1 S1 (XF)N PF R0 Case 2 S2 R’0 X0
9
In second case which illustrates platform-shift strategy based on design-rule renewal, the considered firm has both Research and Development capacities. More specifically, research is used for design rules production and development for platform design parameters and modules optimization from a defined platform to the next one. In this case, the firm has a design rule production capacity which allows to regenerate platform design rules asset (from (XF)N to X0) and Research is defined as firm capability to recognize, select and introduce new
design rules. Consequently, the firm has a capacity to activate research for design rules stock renewal when (XN)F is under an X0 defined level. Research cost will be expressed as the cost
of renewing a design rules stock, therefore, we use classical production formulas:
-"."/012 3 4 with 3 the unitary cost for design rule production and q the set of design rule produced, therefore:
-"."/012 3 4 -"."/01 3 4 4 and: -"."/012 5 6 7 84 9 :; 5 3 4
As it is shown by the R’0 expression above, R’0 represents the research cost of all design rule
set production. Therefore, research costs will be considered at a first order as proportional to the set of the design rules produced. As we have defined development and research activities, their nature and contribution for platform renewal strategies, we propose in the next section to present (X)F evolution in each case.
Learning rates and environment technological velocity
We propose to define two scenarii (scenario L and H) for the low and high obsolescence velocity cases where X behaves as a linear function of time, therefore for each platform generation:
<= 7 9 :; ; >?@ 0 A B 1
Here, is considered as a discount rate or a depreciation rate used for the evaluation of
existing design rules application from a platform to a new one. We assume that for the first platform PFN all the design rules are known and in the figure below we represent X evolution
from a platform to a new one as a percentage of initial available design rules. As an example if (XF)N=100% at each platform generation this means that designers are very knowledgeable
about what has to be designed, as uncertainty increases less and less design rules are available for platform development at each generation.
Figure 3: Design Rule obsolescence and technological velocity environment.
0 0,2 0,4 0,6 0,8 1 PFN PFN+1 PFN+2 PFN+3 PFN+4 X(t) XA XL XH X0 with δL = 0,05 with δH = 0,13
10
In order to develop a new platform, design teams need to have (XF)N =1 (a complete
design stock), that is to say to have all the design rules that enable to define platform modules, components and interfaces. To distinguish Research from Development activities, we define X0 as the minimum set of design rules that development can use in order to propose a reliable
and valuable platform. As an illustration, we present in Figure 3 the two cases based on scenario H (HTV case).
Figure 4: Comparison of X evolution for F following S1 and S2 strategy in scenario H.
In the first case, (XF)N decreases linearly at a δH velocity, this means that at each N
generation, design teams have (XF)N design rules in order to explore, develop and validate a
new platform. In the second case, Research is in charge of producing [(XF)N – X0] design rules
before that development uses these X0 design rules for new platform development. In this
specific case, the design rules stock produced at platform generation N are valid for only this platform generation and become obsolete for the next one.
Modeling ‘Criteria 1’ and ‘Criteria 2’ for S1 and S2 platform renewal Strategies.
For criteria 1 in S1 case, platform renewal is based on platform development exploiting an existing design rule stock, therefore a platform-renewal based on development activity (S1) will have a cost:
,
denotes the cost of platform development using existing design rules and R0 is the
cost of platform development. CS2 will be expressed in two parts, the first one expressing
design rules cost production from (XF)N to X0, the second one the exploitation of X0 design
rules for platform development. Thus we express platform renewal cost with S2 strategy as:
0 0,2 0,4 0,6 0,8 1 PFN PFN+1 PFN+2 PFN+3 PFN+4 XA(t) XD(t) Development 0 0,2 0,4 0,6 0,8 1 PFN PFN+1 PFN+2 PFN+3 PFN+4 XA(t) XD(t) X0 (XD) N+2– X0 (XD) N+3– X0 Development Research (X)t = 1 (XH) t (X)t (X)t (X)t = 1 (XH) t X0
11
′ 6 7 8 C D for E E 0
, for 1
6 7 8 represents the stock of design rules that have to be produced by exploratory
units enabling platform development. With regards to ‘Criteria 2’, we model the firm technical competitive advantage as its capacity to reduce impact on (XF)N evolution.
Actually, is an exogenous parameter which represents design rules obsolescence velocity (due to technological or business evolutions). Therefore, a firm that has a technical competitive advantage is able to manage . Regarding the impact on (XF)N we can notice
through Figure 4 that S1 and S2 are equivalent, i.e for each platform generation S1 and S2 afford the same design rule amount (XF)N. This means that S1 and S2 don’t afford any
technical competitive advantage for reducing (XF)N obsolescence induced by exogenous
parameters (such as market trends or technical roadmaps).
As the platform renewal strategies have been defined through, obsolescence rate, design-rule renewal, cost functions and platform-development mechanisms, we propose in the next section some simulations linked to this model application in order to deduce insights about S1 and S2 in high-technological velocity environments.
Model simulation and Scenarii Analysis
In this part we propose in a first approach to define independently from environment velocity what are relevant domains for S1 and S2 PF renewal strategies. This will lead us to define a shift strategy for which X0 allows an optimized investment logic ‘criteria 1’.
Figure 5: Comparison of cost evolution for S1 and S2 (with low X0, high X0) strategies.
Figure 5 suggests different comments. Firstly in S1 strategy platform renewal costs decrease in 1/X which means that this kind of strategy is interesting in case of high level of available design rules set. In S2 with High X0 case, for X spread from X0 to X1, S1 prevails.
In this domain, using an S2 platform renewal strategy will induce an overinvestment in research whereas using existing design rules will enable an effective platform design. The last point is that for X under X1, adopting a platform-shift strategy based on design rule renewal
0 400 800 1200 0 0,1 0,2 0,3 0,4 0,5 0,6 0,7 0,8 0,9 1 C(X) X S1 S2 (with X0 Low) S2 (with X0 High)
Platform renewal Strategies
X0High X0Low X1
12
appears more cost effective. In S2 with low X0 S1 prevails for X>X0 and S2 prevails for
X<X0. Consequently we define two domains, the first one where S1 prevails and the second
one where S2 prevails. However this first simulation doesn’t tell so much about environment velocity impact on platform renewal strategies, it has the advantage to present domain dominance for each strategy (depending on design team approach for Design Rules exploitation).
As we analyzed S1 and S2 strategies, we focus in the next section on environment velocity impact on these platform-shift strategies (first in Low Technological Velocity Environments (LTVE) then in High Technological Velocity Environments (HTVE) so as to compare the relevance of these strategies in different industrial contexts).
Figure 6: Comparison of S1 and S2 platform renewal strategies in LTVE
In low velocity environments, as (XF) decreases slowly at each platform generation,
the remaining set of design rules is sufficient for new platform development. This is particularly obvious in Figure 5, where S1 platform renewal approach prevails on S2 for several generations. Therefore, in this kind of environment Research activities and new design rules production can be considered as a wasting R&D effort and S2 is not relevant.
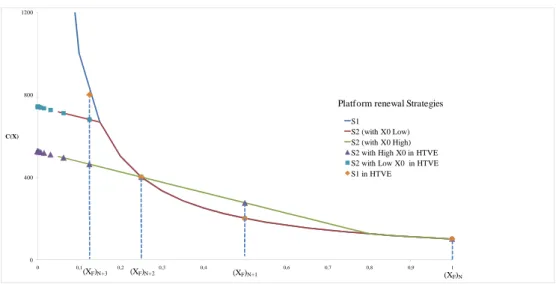
Figure 7: Comparison of S1 and S2 platform renewal strategies in HTVE
In the HTVE, design rules are rapidly obsolete, consequently their renewal is an iterative issue. As illustrated by the simulation based on scenario H, we notice that from (XF)N+3,
0 400 800 1200 0 0,1 0,2 0,3 0,4 0,5 0,6 0,7 0,8 0,9 1 C(X) X S1 S2 (with X0 Low) S2 (with X0 High) S2 in LTVE S1 in LTVE (XF)N (XF)N+1 (XF)N+2 (XF)N+ 3 (XF)N+ 4 (XF)N+5
Platform renewal Strategies
0 400 800 1200 0 0,1 0,2 0,3 0,4 0,5 0,6 0,7 0,8 0,9 1 C(X) X S1 S2 (with X0 Low) S2 (with X0 High) S2 with High X0 in HTVE S2 with Low X0 in HTVE S1 in HTVE
(XF)N
(XF)N+1
(XF)N+2
(XF)N+3
13
platform renewal strategies based on S2 mechanisms are more suitable than S1. S2 helps to propose a better balance than S1. Therefore, using this graph we identify a logical sequence for platform renewal strategies based on successive S1 and S2 approaches:
PFN : S1 PFN+1 : S1 PFN+2 : S2/S1 PFN+3 : S2.
As a conclusions, in this section we compared S1 and S2 platform-shift strategies and shown where each of them is relevant, depending on the level of technological obsoleteness.
From S1 to S2 transition optimization.
In the last section we stressed the particular relevance of S2 in HTVE. This suggests a question about S2 optimization and X0 definition: is there a defined X0 for which S2 is
optimal? These two first graphs enable to define an optimal strategy which enable to optimize design costs for S1 and S2 platform renewal strategies. At this specific point (X0 Optimal) the
CS1 and CS2 curves are tangent:
FG=
F
D H&) '/$ FGI
F
D H&) '/$ J H&) '/$ K D ′
Therefore we show that there is an optimal point (X0 optimal) for which shifting from S1 to S2 is
relevant. One of the interpretation that we can associate to this expression is that the more R’0 is high (this means that research activities are costly, due to exploration and screening processes) the more X0 optimal will be low, which means that Research will be asked to produce
very few design rules. Conversely, if R’0 is very low, this means that Research activities are
very cheap (e.g : funded by public offices) and therefore, X0 optimal is very high, which means
that Research will be asked to propose, explore and develop design rules ready to be transferred to development.
Figure 8: Optimizing S2 platform renewal strategy
Through this model and its simulation, we have shown that S1 and S2 strategies for platform renewal are different regarding the investment optimization issue (for the following platform) but make no difference in term of design rules renewal at a longer term (PF N+2, PF N+3, …., PF N+t). Beyond S1 and S2, we can infer an S3 strategy that integrates design rule stock renewal issue for several platform generations that will be presented and explained in next part. 0 200 400 600 800 1000 1200 0 0,1 0,2 0,3 0,4 0,5 0,6 0,7 0,8 0,9 1 C(X) X S1 S2 (with X0 Low) S2 (with X0 High) S2 with X0 Opt. X0High X0Low X1 X0 Optimal
14
New platform renewal strategy (S3) based on design rule stock renewal
In this section we propose to define Advanced R&D (ARD) as firm capacity to produce δx design-rule stock valid from N+2 until N+t platform generations. The main difference between R and ARD relies on time-depth design-rules applicability. Whereas in R the produced design-rules are only valuable for next platform generation, ARD enable to define design-rules for multiple platform generations. ARD activity cost follows R activity logics as it can be assimilated to a design-rule stock renewal, therefore its cost function as a production function will be defined as: L-! " ? M
The cost of such activity shows an increasing return both for the time depth (a longer design rule validity costs relatively more, as uncertainty is growing) and for the number of design rules added to the design rules stock, because of the validation of the interactions and the compatibility between each design rule (this means that N O 1). With S3, our aim is to model a company that has the capacity to develop δx, a relative increase of design rules stock that is valid for t platforms (and beginning at the over-next one) and could lead to a technical competitive advantage (see Figure 9).
Figure 9: Defining S3 as a pre-positioning strategy based on a reliable design rule.
More precisely, in S3 case for a given platform (generation N), firms makes both Advanced R&D, Research and Development for the next platform. Therefore, instead of looking only for investment optimization, S3 platform renewal rely on the proposition of a valuable design rules stock. Regarding ‘Criteria 1’ S3 cost has the following expression:
" ? MC ′ 6 7 8 C D for E E 0
, for 1
Here, ARD launched in PFN leads to δx design rules capitalization that can be used in
PFN+2, which enables an economy of research in PFN+2. Therefore S3 compared to S1 and S2
lead to a δx technical competitive advantage, which means that S3 outperforms S1 and S2 for ‘Criteria2’. Regarding ‘Criteria 2’, the objective is to define a valuation method for design rules stock renewed. Thus we define q Q δX , as the parameter that represents this design effort with δx0 is the minimal fraction of the required design rule stock (Q =1/ δx0) for
platform development (representing the relative size of an elementary rule). The value of δx for one time period is the value of design rule stock increase, as a first approximation, we model this increase by valuing only the economy of design efforts for the following
0 0,2 0,4 0,6 0,8 1 PFN PFN+1 PFN+2 PFN+3 PFN+4 XA(t) XD(t) X0 (XD)N+2– X0 (XD)N+3– X0 δx X(t) Development Research Advanced R&D
15
generation. The value (V) is computed by comparison with a reference scenario defined as design rule stock for PFN with (XF)N, but without δx through three cases:
DR stock level Nature of the economy Value
0 < (XF)N < X0 - δX δX enables an economy of ARD T R’ δX
X0-δX < (XF)N < X0 Economy is the difference between D and
ARD costs T R’0. X0 – XF C
R0
X07
R0
XF NC δX
X0< (XF)N < 1 δX enables an economy of Development T R0
XF N7
R0
XF NC δX
As previously shown, the optimization of ARD activity leads to define an optimal X0 optimal for which X0 optimal = √(R0/R’0) which gives the shape of the curve below. This figure
shows that if the company does not follow the optimal S2 strategy (i.e X0 is significantly
lower than X0 optimal), the maximal value is obtained in X0; this kind of firm tends to overinvest
in ARD and consequently the maximal value of the design rules stock renewal lies around X0
and δX is used to correct this overinvestment.
Figure 10: Design-rule stock value evolution.
Therefore, this model gives two main insights.
Consequence 1: The first one is that the value V(δX) is significant for (XF)N < X0, for
higher values of (XF)N, the value decreases as 1/X2. Therefore, a pre-positioning strategy is
particularly relevant for low level of design rules stock, which is the case in High Technological Velocity Environments.
Consequence 2: The second one is that the value V(δX) decreases strongly if XF+ δX > X0, this means that pre-positioning strategies bring value as long as δX< X0- XF,
which indicates that this kind of strategy is valuable for a limited increase of design rules stock.
A more sophisticated valuation could take into account the fact that design rules renewal brings a greater capacity to take clever technical and scientific positions in the field. Evaluating this ARD capacity, we look for optimal q and n that maximize the benefit of renewing design rules stock. We therefore maximize the function:
[ , ? T , ? 7 F[ , ? DF? ′ D 7 N " M?M]= This brings: F[ , ? DF? 0 ? N71 ′0 N " 0 , 0 5 10 15 20 0 0,25 0,5 0,75 1 V(X) X V(X) X0 X0- δX
16
This expression suggests a third consequence for ARD activities. Actually ? O 1if and only
if " ′ D and ′ D is the expression of the research cost allocated for one elementary N
design rule. This means that the unitary cost of developing one elementary design rule for a defined platform has to be lower than the research cost of an elementary design rule divided by β. That is to say that ARD cost has to be significantly lower than the cost of anticipation research which implies that ARD has to minimize β, which means that one of the requirements for ARD activities is to produce design rules that are generic over time and easily compatible with each-other.
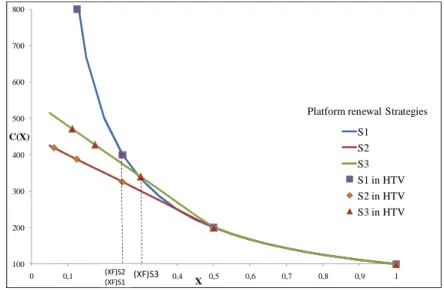
Figure 11: S1, S2 and S3 comparison in High-Technological Velocity environments.
S3 is a different platform renewal strategy from anticipation and adaptation that can be characterized as a “pre-positioning” strategy. In that sense, S3 does not only anticipate the development of the next platform but it aims at configuring the stock of Design Rules that enable clever positioning for the development of multiple future platforms.
As a conclusion of this part, we demonstrated that the optimization of the set of design rules leads to a combination of Research and Development with a turning point for the beginning of research. This is particularly the case in HTVE where S1 is rapidly an unsustainable strategy for platform renewal (P1), whereas S2 is relevant for platform development cost optimization (‘Criteria 1’) with H&) '/$ K D (P2). ′
Nevertheless, it is interesting to underline the fact that these strategies have no effect on the design rules stock renewal and don’t afford any technical competitive advantage (P3). As shown in the last part of this section, a prepositioning strategy consists in including the design rule stock renewal in the strategy. Our model shows that this strategy is not self evident since its validity area is limited. Prepositioning strategy S3 is interesting for HTVE, at low design rule stock level, and for a limited design rules set renewal. To optimize S3 strategy, ARD teams will try to limit R”0 and to increase time and scope genericity of the produced design rules (P4).
In the next section, we illustrate through a case-study in a high-technological velocity industry the insights suggested by our model.
100 200 300 400 500 600 700 800 0 0,1 0,2 0,3 0,4 0,5 0,6 0,7 0,8 0,9 1 C(X) X S1 S2 S3 S1 in HTV S2 in HTV S3 in HTV Platform renewal Strategies
(XF)S3 (XF)S2 (XF)S1
17
Case study: Designing the next generation of cell phone image sensor platforms
While industries such as ICT, biotechnology or semiconductors have been characterized as high-velocity environments, in which demand, competition and technology are constantly changing, we settled a collaboration research with an Integrated Device Manufacturer (IDM) with the aim to at explore the utility of our method. The data to test this model were gathered from a specific application, which is image sensor platform. Image sensors made a big jump in the 2000’s with the introduction of CMOS sensor technology which gave birth to the low-cost, high volume camera phone market. Image sensors are now part of our everyday’s life: from cell-phone cameras, to notebook webcams, digital cameras, video camcorders to security and surveillance systems. This kind of device became a central business for STMicroelectronics when it appeared possible to use Silicon wafers as a photodiode; then it was possible to build an electronic integrated circuit on the wafer to treat the photodiode signal, the electronic treatment stack being produced by using classical CMOS technologies (ie technologies used for microprocessors). The market for image sensors has been experiencing explosive growth in recent years due to the increasing demands of mobile imaging, digital still and video cameras, internet-based video conferencing, surveillance and biometrics. With over three hundred million parts shipped in 2007 and an annual growth rate over 25%, image sensors have become a significant silicon technology driver.
Studying the historical record of image sensor in the company required many discussions and interviews with engineering teams, researchers, PhD students and marketing managers in charge of platform development. The first task of our field research study was to build platform maps and transitions distinguishing Development efforts from Research and Advanced R&D activities. In total, the data set contained information for five platforms, which provided a rich database on platforms renewal approach to explore the utility of our model.
Empirical data.
Image sensor platform: trends and evolution.
An image sensor is one of the main building blocks in a digital imaging system (such as digital still or video camera) and is one of the main elements of the image pipeline. It is composed of millions of pixel, each pixel translating the incident light on it into one bit. The rest of the pipe consists in “integrating” the stored pixel signals to produce the image. In our study we focus on the technology platform which is the pixel array and more precisely the pixel itself defined mainly by its architecture, components, manufacturing processes and size. If we consider pixel size evolution in the last ten years, the main trend concerning the image sensors is their size diminution (to improve the resolution of the sensor) at a regular and rapid time pacing.
18
Figure 12: Pixel trend from a CMOS to a specific Image sensor process(Jaffard 2008).
Image sensors benefit from CMOS technology scaling by reducing pixel size, increasing resolution, and integrating more analog and digital circuits on the same chip with the sensor at each generation. As image sensor products this rapid image sensor evolution had an impact on its architecture, processes, modules and design rules. This can be analyzed at several levels. Meyer & al. propose an evolutionary model for the product family which suggests that a firm must seek to continuously renew its base product architectures while mining the commercial potential of existing platform. Following that framework, we show in Figure 4 how platform renewal process is based on extension approach or new design rules production by positioning in this map the different identified platform-shift strategies (S1, S2 and S3).
Figure 13: Image sensor Platform renewal process using Meyer framework (Meyer, Tertzakian et al. 1997).
As image sensor platform roadmap is driven by Mobile camera applications, image sensor module trend is mainly based on more compact modules at each generation. As an example, between 2001 and 2006, the VGA module went from a 1cm3 to 0,05cm3 volume,
0 1 2 3 4 5 6 7 8 9 10 1998 2000 2002 2004 2006 2008 2010 P ix e l S iz e ( µ m )
Pixel Size Evolution (1998 - 2010)
Pixel Size CMOS Process
Image sensor
option Image sensor Process
CMOS Capable
Development of sensor PF based on 3µm pixel Initial Product
Follow-on Product 1 Follow-on Product 2
Development of a New PF based on 2.2µm pixel Initial Product# Follow-on Product# 1 Follow-on Product# 2 Plan Multiple Generations Initial Product## Follow-on Product## 1 Follow-on Product## 2 ……..
New design to Achieve Value Cost Leadership and Reach New Market Applications
Cost Reduction & New Features.
New Market Applications S1
Development of a New PF based on 1,75µm pixel
Initial Product### Follow-on Product### 1
………
Development of a New PF based on 1,4µm pixel
2003 2004 2005 2006 2007 2008 2009 2010
Initial Product### Follow-on Product### 1
………
Development of a New PF based on 1,1µm pixel
S1
S2
19
which means that its volume has been reduced by a factor 20. This shows that for the same resolution and performance in term of image quality, a huge work has been made on each platform in order to sustain product trend. In the late 2007, it became clear that some sort of threshold would be reached soon. The traditional approach could not be improved any further relying on the introduction of incremental innovations focused on specific functional blocks of the classical image sensor platform. Facing this situation we present in the next section what have been Advanced R&D design strategies and propositions, which will enable us to shed the light on the debated issue about the relationship between design rules and platform renewal issues. At each image sensor generation, surface reduction tends to decrease the performance of the single pixel, since each one receives less light, therefore one of the main challenges consists in shrinking the pixel size without decreasing the pixel performances. To meet this challenge, several innovation projects have been launched ranging from classical improvement to more discontinuous projects.
At STMicroelectronics several teams are designing the next generation of cell phones image sensors. It is not self evident to understand the role of each team in the overall design process: it is neither a pure Work Breakdown Structure where each team would be in charge of one module; nor is it a competitive process where each team explores one single solution in the hope to be selected as the winner entering the development funnel. The analysis consisted in meeting with each teams to clarify the concepts they are working on, the knowledge they are using and producing and the relationships they have with other actors. Studying the historical record of the image sensor product platform required many discussions with engineering and marketing managers. The first step in field study was to distinguish for each platform generation, the development from the research projects and to specify their links. Studying the evolution of a specific platform, we distinguished different renewal phases which will be described in next section.
Platform shift strategies analysis through four Image sensor generations.
Image sensor platform and more precisely pixels are mainly made of four Modules, the first one (M1) is the sensitive part made of silicon where photodiode and transistors are processed, then are oxide layers used for the interconnection between the transistors (M2) and the photodiode (M3). On the top of these interconnections there is a specific layer used for the color resist (M4) and finally the micro-lens (M5) which is used for focusing optical incident signal on the photodiode. Considering the classical approach we can notice that developing each new image sensor generation consist in keeping same design rules and optimizing each block in order to develop each new image sensor generation.
Analyzing image sensor projects at every generation let us notice that for image sensor, platform design from 1st to 3rd generation consisted in optimizing design parameters (such as material or process used, stack height, transistor numbers by pixel) of each module keeping the same design rules, which is in correspondence with S1 platform renewal design strategy. For these generations, there were no Advanced R&D projects as the design parameters enabling “platform design” were well defined. For the fourth platform generation, Advanced R&D activity consisted in exploring new design paths, proposing new design rules by new module introduction which enabled an optimal performance for the forthcoming platform (Platform 4 and next ones). In the next figure we synthetize all the modifications made at each generation in order to improve image sensor platform performances.
20
Figure 14: Pixel evolution and new design rules development.
As a conclusion for this part, in this case-study three platform-shift strategies have been analyzed and presented. The first kind of platform-shift can be described in the switch from Platform 1 to Platform 2 which is mainly based on anticipation and existing platform extension (S1). The second one is the platform-shift strategy settled in the switch from Platform 2 to Platform 3 which is based on local search process, which enables to improve different modules (S2). Last kind of platform-shift strategy is represented in the switch from Platform 3 to Platform 4 which is based on Advanced R&D technological blocks integration and the exploration of original design path (it seems that this kind of strategy has not yet been characterized). We present in the next section an application of the previous model that describes the mechanisms of platform-shift logics depending on environment technological velocity. We then discuss the representation and interpretation of the main parameters to conclude with the managerial implications on platform-shift logics.
Advanced R&D contribution to platform renewal and platform shift strategies analysis.
Linked to platform renewal issue, and platform development, one of the main objectives for the Advanced R&D is the exploration of breakthrough technologies for new design rules proposition. For instance, a discontinuous alternative investigated by the exploratory unit is to “suppress” the optical stack containing all the electronic components for signal treatment so that pixel performance can be maximal (such a concept would lead to an “ideal” optical surface for the pixel but requires to completely change the semiconductor process, to be able to stick, assemble and connect complex nano-electronics building blocks) (see Figure 14). This kind of approach offers multiple benefits as it increases photodiode area (enabling a higher density) and lowers optical path (as seen in Figure 5 and Figure 6) but it brings also drawbacks such as process complexity (which has as major effect to increase image sensor cost). However these alternatives are far from being solutions: they rather emerge as multiple design pathes for future explorations. For instance , whereas Tohoku University and the MIT propose to develop parallel approach for 3D image sensor integration(V.Suntharalingam, Berger et al. 2005); (Koyanagi and Fukushima 2006), ARD proposed another alternative to develop the same kind of device, based on a “sequential” (Coudrain, Batude et al. 2008) process which would imply to re-process the first stack in order to develop the second part above the first one. This second approach has several constraints (the main one is the thermical budget of the first stack) but is an answer to the
Photodiode Photodiode Photodiode Micro-lens Color Filter Metal Layer 2 Metal Layer 1 Silicon Bulk Silicon Bulk Micro-lens Color Filter Metal Layer 1 Metal Layer 2
Carrier Silicon bulk
Metal Layer 2 Metal Layer 1 Silicon Bulk Micro-lens Color Filter Transistor Layer Transistor Layer - Platform GN4 Transistor Layer M1 M2 M3 M4 M5 M1 M2 M3 M4 M5 M6 M1 M2 M3 M4 M5 M6
Advanced R&D Projects (exploratory project)
21
main constraint generated by the bonding of two distinguished parts (the precision of the alignment). Performances improvements have been based on process and there are new promising technologies for which there is a significant cost gap to overcome. Therefore, in this case-study we can notice that advanced R&D attribution is to propose new design rules that helps to design platform potential and more precisely platform robustness (in term of design path) and value (for sub-micronic pixels).
Applying our model to the case-study: Variables and Indices definition for D, R and ARD
In previous part, through case-study description, we have shown that D activities are based on existing design rules exploitation for new platform development; R activities consist in producing new design rules for next platform and ARD activities. Applying our model to this case-study implies to specify several inputs and hypothesis. Regarding resources and cost estimation, we considered for the development part engineers (in this specific case, as some engineers work simultaneously on two platform we consider that they work half-time on a specific one) and prototypes, for the R and ARD part the different researchers and PhD students involved in these projects. Therefore we express in arbitrary units resources involved for each platform generation:
Figure 15: Resources in arbitrary units for D, R and ARD.
For Q estimation (total number of design rules), we gathered our data from two sources which are DRM (Design Rule Manual), the main document describing main sensor blocs and physical layout and process-flow which precises all the process steps required for image sensor platform manufacturing. As we had only a limited access to PhD student works regarding R activities in progress, we used as a proxy of their design rules production, an evaluation of the number of the DRM pages and process-flow steps that they were able to dicuss (in our case we assume that R activities enable to discuss further 3 of the 100 DRM pages and 12 of the 250 process steps, which means that Q = 100, and q = 3). For ARD activities, we assume n=2 (this means that the design rules produced are useful for two platform generations) and β = 2, which signifies that for 2 design rules (e.g : A and B) to be produced by ARD, ARD is supposed to produce A, B, to verify and validate “A B” and “B A” interactions. We then estimate XPF1 comparing the percentage of specific image sensor
steps compared to common CMOS processes (we find that XPF1=45%). In the next part we
explain how, thanks to these several inputs, we are able to explore model utility through our case-study.
Modeling the case-study
Thanks to these empirical data, the aim of this section is to define for each PF the couple ((XF)N,CPFN) we are able to trace back and analyze S1, S2 and S3 as trajectories
corresponding to the different PF renewal strategies followed by the firm. This will enable us to compare theoretical to empirical results. Thanks to empirical data and model equation we are able to link R0 to the different XPFN (XPF1, XPF2, XPF3, XPF4 and XPF5) and the platform for
their which there is research (X0 for PF3, PF4 and PF5).
PF1 PF2 PF3 PF4 PF5
D 150 150 150 125 125
R 3 8 6
22
On the one hand, from model hypothesis we have different equations linking several parameters (as an example, XN+1 – XN = δX gives us three equations linking XPF1, XPF2, XPF3,
XPF4 and XPF5). On the other hand, empirical studies through interviews revealed an issue
linked to value parameter estimation. As an example, we know that first platform was over-estimated (over-investment in comparison to resources needed), therefore we look at finding a theoretical value for XPF1 rather than using development cost formula for X1 estimation. The
interviews showed also that PF2 was under-estimated (not enough investments) which lead to several delays and impacted platform performance, therefore as for X1 we intend to define a theoretical value for XPF2. Finally among the ongoing research studies runed by PhD Students,
some of them are lead for the ongoing platform whereas some others are for the next platform generation. As we were not able to identify a clear boundary for these research activities, we will not use these inputs. All these elements bring us to estimate Xi for XPF3, XPF4, and XPF3
using platform development costs and research costs.
Platform generation C Development C Research
PF3 ^ D [1] ′ ^7 ^ [4] PF4 _ D [2] ′ _7 _ [5] PF5 `
D [3] ??? (Not easy to be identified)
As XN+1 – XN = δX for XPF1, XPF2, XPF3, XPF4 and XPF5, we deduce that:
a _ 3 a ^27 a = Using : [6] - H&) '/$ K ′ D [7] - L-! " ? M " L-! ? M , [8] - - ′ d 7 B e ′ -,6 7 8
With these equations we define H&) '/$ These data enable to plot the different graphs representing S1, S2 and S3 and to follow firm trajectory for platform renewal monitoring.
XPF1 45% XPF2 38% XPF3 31% XPF4 24% XPF5 27% 174 173 161 Theoretical Value 133 158 174 173 167 Empirical Value 150 150 XPF
23
Figure 16: Modeling Platform renewal strategies in image sensor case-study.
In next part we analyze through Figure 16 interpretation what have been firm decisions for platform renewal from PF1 to PF5 and what can be next positioning for forthcoming platforms.
Case-study analysis.
Comparison between empirical data and theoretical model suggests several comments. Firstly, we find back theoretical cost values for XPF1 and XPF2 and confirm an overinvestment
in PF1 and an underinvestment in PF2. We also find back a credible value for research. The second point is that this model allows giving an interpretation of firm’s behavior and strategy selection. As described in figure 16, firm begins by launching PF1 through a development process, before activating R and ARD little by little, generation after generation, then ARD stops when design rule stock is at an acceptable level. Here, the main challenge relies on firm capacity to estimate its design rule stock level.
Therefore, investments in D, R and ARD aim at optimizing design rules stock exploitation (Criteria 1) for platform development and its renewal value (Criteria 2) using successive adjustments:
- For PF1 and PF2, adjustments give some insights on initial platform development and enable to estimate at a first order R0 (as it is over-estimated for the first one and
under-estimated for the second one).
- Then, as development investments increase, firm decide to begin research activities but again, one of the main challenge is to give an estimation of the X0 optimal level, with an
X0 for PF3 too low, raised for PF4 and PF5. Surprisingly, we notice that the empirical
(X0)PF4 is very close to the theoretical one (as (X0)PF4=48% and X0optimal = 55%).
- Finally, as an acceptable X0 approximation has been defined, the firm proceeds to the ARD effort balance. As R”0 is very low (0,22 vs 1,82) this suggests a great efficiency of ARD activity. It would be unprofitable to realize more ARD, as for XF around X0 design
rules value decreases radically (see Figure 10).
110 120 130 140 150 160 170 180 190 0% 10% 20% 30% 40% 50% 60% 70% 80% 90% 100% C(X) X D : R+D (x0(3)) R+D (x0(4)) D-costs (empirical) Total costs (empirical) D-costs (theoretical) Total costs (theoretical)
XPF1 XPF2 XPF3 XPF4