HAL Id: tel-03209566
https://tel.archives-ouvertes.fr/tel-03209566
Submitted on 27 Apr 2021HAL is a multi-disciplinary open access
archive for the deposit and dissemination of sci-entific research documents, whether they are pub-lished or not. The documents may come from teaching and research institutions in France or abroad, or from public or private research centers.
L’archive ouverte pluridisciplinaire HAL, est destinée au dépôt et à la diffusion de documents scientifiques de niveau recherche, publiés ou non, émanant des établissements d’enseignement et de recherche français ou étrangers, des laboratoires publics ou privés.
Utilisation complémentaire des techniques de
fractionnement flux-force asymétrique et en colonne
tournante pour la caractérisation d’échantillons
environnementaux de particules
Aleksandr Ivaneev
To cite this version:
Aleksandr Ivaneev. Utilisation complémentaire des techniques de fractionnement flux-force asymétrique et en colonne tournante pour la caractérisation d’échantillons environnementaux de par-ticules. Chimie analytique. Université de Pau et des Pays de l’Adour, 2020. Français. �NNT : 2020PAUU3035�. �tel-03209566�
№ |_|_|_|_|_|_|_|_|_|_| UNIVERSITE DE PAU ET PAYS DE L’ADOUR
École doctorale des Sciences Exactes et de leur Applications (ED 211)
ET
UNIVERSITE NATIONALE DE SCIENCES ET TECHNOLOGIE “MISiS”
École doctorale
THESE
PRESENTEE PAR Aleksandr IVANEEV
Pour obtenir le grade de docteur de l’Université de Pau et des Pays de l’Adour Spécialité: Chimie Analytique et Environnement
Utilisation complémentaire des techniques de fractionnement flux-force
asymétrique et en colonne tournante pour la caractérisation d'échantillons
environnementaux de particules
Soutenue le 17 décembre 2020MEMBRES DU JURY Directeurs de thèse
Petr FEDOTOV Directeur de laboratoire, Université “MISiS”
Gaёtane LESPES Professeur, Université de Pau
Rapporteurs
Serge BATTU Professeur, Université de Limoges
Anna ZAVARZINA Leading research scientist, Lomonosov
Moscow State University
Examinateurs
Tatiana MARYATINA Professeur, Vernadsky Institute of
Geochemistry and Analytical Chemistry
Karen GAUDIN Professeur, Université de Bordeaux
Acknowledgments
First, my sincere gratitude goes to my supervisors Petr Fedotov and Gaёtane Lespes for the obtained experience, consideration, encourage and support at all steps of the thesis work, discussion of results and planning of experiments.
I am grateful Mikhail Ermolin and Stéphane Faucher for their contribution and help in experimental work, valuable advices, discussion of results, and planning experiments.
I thank Vasily Karandashev and Natalia Fedyunina for their contribution in experimental work in part of digestion and analysis of samples under study, helpful suggestions and comments.
I express my acknowledgements to the Embassy of France in Moscow for Vernadsky PhD fellowship awarded for performing this doctoral thesis under co-supervision by Petr Fedotov and Gaёtane Lespes in University of Pau and University “MISiS”.
I would like to thank the Laboratory Of Separation and Pre-concentration in Chemical Diagnostic of Functional Materials and Environmental Objects (NUST “MISiS”) and Institut des Sciences Analytiques et de Physico-Chimie pour l’Environnement et les matériaux (UMR 5254 UPPA/CNRS, Pau) for the support and contribution towards this doctoral thesis.
Last, but not the least, I want to thank my colleagues and friends for continued support. I also express my sincere thank my wife Liubov for support and inspiration over the years.
TABLE OF CONTENTS List of figures ... 5 List of tables ... 7 Glossary ... 8 General introduction ... 9 Introduction générale ... 11 Введение ... 14
Chapter 1 State of the art ... 17
1.1 Introduction ... 17
1.2 Theoretical background and instrumentation ... 19
1.2.1 Sedimentation field-flow fractionation ... 19
1.2.2 Flow field-flow fractionation ... 22
1.2.3 Coiled tube field-flow fractionation ... 24
1.2.4 Split flow thin cell fractionation ... 27
1.3 Applications to environmental studies ... 30
1.4 Conclusion ... 39
Chapter 2 Materials and methods ... 40
2.1 Volcanic ash samples ... 40
2.2 Reagents ... 41
2.3 Separation of nanoparticles from volcanic ash samples ... 42
2.3.1 Filtration ... 42
2.3.2 Sedimentation ... 43
2.3.3 Coiled tube-field flow fractionation ... 43
2.4 Size characterization of recovered fractions and initial samples ... 44
2.5 Trapping of recovered nanoparticles on filters ... 44
2.6 Elemental analysis of initial samples and recovered nanoparticles ... 45
2.6.1 Pre-treatment procedures ... 45
2.6.1.1 Digestion of initial samples ... 45
2.6.1.2 Digestion of filters with trapped nanoparticles ... 46
2.6.1.3 Digestion of nanoparticle suspension ... 46
2.6.1.4 Acidification of nanoparticle suspension ... 47
2.6.2 Elemental analysis ... 47
2.6.2.1 Inductively coupled plasma atomic emission spectrometry analysis ... 47
2.6.2.2 Inductively coupled plasma mass spectrometry analysis ... 48
2.8 Comparison of the results of direct and indirect elemental analysis ... 49
2.9 Study of volcanic ash nanoparticles by hyphenated system (Asymmetric flow field- flow fractionation-UV detector-multi-angle light scattering-inductively coupled plasma mass spectrometry) ... 50
2.9.1 Dimensional analysis ... 50
2.9.2 Elemental analysis ... 51
2.9.3 Signal processing from fractograms ... 52
Chapter 3 Analytical study of the nanoparticle fraction of volcanic ash ... 53
3.1 Separation of nanoparticles from volcanic ash samples: comparative study of filtration, sedimentation, and coiled tube field-flow fractionation ... 53
3.1.1 Dimensional characterization of nanoparticle fractions ... 53
3.1.2 Elemental characterization of bulks and nanoparticle fractions ... 56
3.1.3 Weight characterization of bulks and nanoparticle fractions ... 60
3.2 Reliability of direct ICP-MS analysis of volcanic ash nanoparticles ... 62
3.3 Characterization of volcanic ash nanoparticles and study of their fate in aqueous medium by asymmetric flow field-flow fractionation – multidetection ... 67
3.3.1 Comparison of volcanic ash particle sedimentation process in deionized water and a synthetic river water ... 67
3.3.2 Dimensional and elemental characterization ... 69
3.3.3 Temporal monitoring ... 74
3.4 Fractionation and characterization of volcanic ash nanoparticles by coiled tube field-flow fractionation, laser diffraction, scanning electron microscopy and inductively coupled plasma mass-spectrometry ... 80
3.4.1 Recovering of submicron particle fraction from ash sample ... 80
3.4.2 Separation of submicron particle fraction into three different populations ... 83
3.4.3 Elemental analysis of separated populations ... 88
General conclusion and Perspectives ... 89
References... 92
List of figures
Figure 1. Schematic formalization of (a) SdFFF instrumentation, (b) parabolic flow of the mobile phase in the channel, and (c) normal and (d) steric modes of elution in FFF; x: transverse axis; z:
longitudinal axis ... 20
Figure 2. Schematic view of symmetric (a) and asymmetric (b) flow field-flow fractionation. ... 23
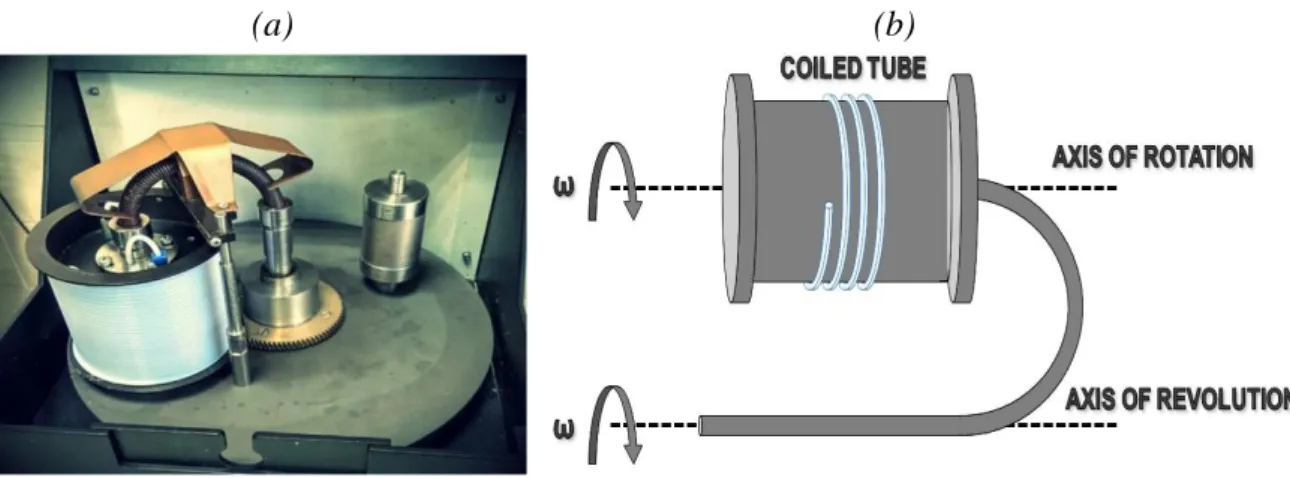
Figure 3. The planetary centrifugal motion for CTFFF. Photo of the instrument (a) and principal scheme (b)... 25
Figure 4. Schematic view of SPLITT channel ... 28
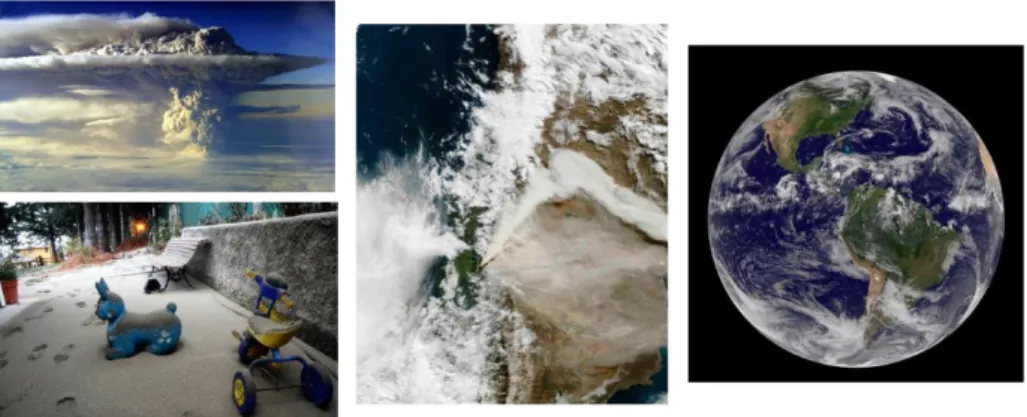
Figure 5. Photos of Puyehue (Chile) eruption of 2011. Sources: Reuters and NASA ... 41
Figure 6. Principle scheme of filtration cell for trapping of recovered nanoparticle on filters ... 45
Figure 7. The size distribution of NP fractions of Puyehue (A), Tolbachik (B), and Klyuchevskoy (C) volcanic ash samples as measured by laser diffraction. ... 54
Figure 8. Micrographs of NP fractions of Puyehue (A), Tolbachik (B), and Klyuchevskoy (C) volcanic ashes separated by filtration, sedimentation, and CTFFF, techniques. For NP fraction separated by sedimentation, a population of particles with size < 400 nm and submicron population are illustrated in micrographs 1 and 2, respectively ... 55
Figure 9. Monitoring of the suspension generated with deionized water and synthetic river water. The blue rectangle represents the selected 72-hour study area, indicated from 0 to 72 hours in the text, for simplicity ... 68
Figure 10. Typical fractograms of the initial suspension of the Klyuchevskoy volcano ash nanoparticle fraction, with the three deconvolved populations (P1, P2 and P3). ... 70
Figure 11. Morphological study; values of aspect ratio distribution of the observed particles from micrographs of Klyuchevskoy NP fraction ... 72
Figure 12. Typical UV-Vis spectra taken at the top of the 3 peaks (corresponding to the 3 populations P1, P2 and P3) of the fractogram of the initial suspension of the Klyuchevskoy volcano ash nanoparticle fraction, given as A) absolute and B) normalized. ... 73
Figure 13. Distribution of elements and oxides in the populations P1, P2 and P3 in the initial suspension of the Klyuchevskoy volcano ash nanoparticle fraction. Precision is ±1 on the last digit of each percentage value... 74
Figure 14. Fractograms showing the 72-hour evolution of the suspension of the Klyuchevskoy nanoparticle fraction. The variation in size as a function of the elution time reported (in gray, at the top) corresponds to 72 hours... 75
Figure 15. Evolution of the different populations identified in the suspension of the Klyuchevskoy nanoparticle fraction. The concentrations are given in percentage relative to the total concentration of nanoparticles in the initial suspension. ... 76
Figure 16. UV-Vis spectra at the top of the 3 peaks of the fractograms seen in Figure 14 (i.e. the 3 populations P2, P3 and P4). ... 78 Figure 17. Fractogram of elution of submicron particle fraction. ... 81 Figure 18. Particle size distribution obtained by laser diffraction and typical microphotograph obtained by scanning electron microscopy of the submicron particle fraction recovered from Klyuchevskoy volcanic ash. ... 83 Figure 19. Fractogram of populations separated from submicron particle fraction; P1 – population 1, P2 – population 3, PF – interim population, P3 – population 3, PF – residual population. Elution was performed at a flow rate of 4.5 mL min-1. ... 85 Figure 20. Particle size distribution of population 1, 2, and 3 separated from submicron fraction as obtained by laser diffraction ... 86 Figure 21.Microphotographs of population 1, 2, and 3 separated from submicron particle fraction as obtained by scanning electron microscopy ... 87
List of tables
Table 1. Selected applications of “conventional” sedimentation field-flow fractionation in a thin channel ... 32 Table 2 Selected applications of asymmetric field-flow fractionation in a thin channel ... 33 Table 3. Applications of “non-conventional” sedimentation field-flow fractionation in a rotating coiled column ... 36 Table 4. Applications of split flow thin cell fractionation in a centrifugal force field ... 38 Table 5. Properties of volcanic ash samples under study ... 40 Table 6. Concentration of major and trace elements in bulk samples (relative to measured bulk ash weight) and NP fractions (relative to measured NP fraction suspension volume) of volcanic ash separated by filtration, sedimentation, and CTFFF techniques (mean ± Standard Deviation (SD) (n=3) and Relative Standard Deviation (RSD) into brackets) ... 57 Table 7. Calculated weights of NPs separated from volcanic ash samples using filtration, sedimentation, and CTFFF methods ... 60 Table 8. Concentration of elements in NP fraction from Puyehue, Tolbachik, and Klyuchevskoy volcanic ashes as obtained by ICP-MS (mean ± U* and RSD** into brackets) ... 65 Table 9. Main dimensional characteristics and elemental composition of NPs and NP deconvoluted populations from Klyuchevskoy volcanic ashes ... 71 Table 10. The flow rates and corresponding time used at the second step of new CTFFF fractionation procedure to provide the separation of submicron fraction of Klyuchevskoy volcano ash into three different populations. The submicron particle fraction was separated at the first step of new CTFFF fractionation procedure. ... 84 Table 11. Elemental concentration in population 1, 2, and 3 separated from submicron particle fraction as obtained by ICP-MS ... 88
Glossary
NP – nanoparticle;
FFF – field-flow fractionation;
SPLITT – split flow thin cell fractionation; FlFFF – flow field-flow fractionation;
SdFFF – sedimentation field-flow fractionation; A4F – asymmetric flow field-flow fractionation; RCC – rotating coiled column;
CTFFF – coiled tube field-flow fractionation; CSF – conventional SPLITT fractionation;
FFDSF – full feed depletion SPLITT fractionation; PSD – particle size distribution;
ICP-AES – inductively coupled plasma atomic emission spectrometry; CV-ETAAS - cold vapour electrothermal atomic absorption spectroscopy; ICP-MS – inductively couples plasma mass spectrometry;
sp-ICP-MS – ICP-MS in single particle mode; SEM – scanning electron microscopy;
TEM – transmission electron microscopy; EDS – energy dispersive X-ray spectroscopy; LD – laser diffraction;
DLS – dynamic light scattering;
LDR – light intensity distribution reproduction; SEI – second electron image;
MALS – multi angle light scattering; UV – Ultraviolet detector;
SD – standard deviation;
RSD – relative standard deviation; U – uncertainty;
B – relative accuracy bias; LOD – limit of detection; LOQ – limit of quantification;
MAD – maximum acceptable deviation; REE – rare earth elements;
rG – gyration radii; ar – aspect ratio.
General introduction
According to conventional definition, a nanoparticle is defined as a nano-object having its three external dimensions in the size range from about 1 to 100 nm [1]. However, from behavioural point of view, the sub-micrometric range (i.e. ≤ 1000 nm) has to be considered in order to account at once primary nanoparticles (NPs) and assemblies of nano-object [2]. Nanoparticles, which can have different origin (soil erosion, volcanic eruptions, dust storms, wildfires, etc.), are an intrinsic part of environmental compartments [2,3]. Environmental NPs have a potential risk for human health and ecosystems due to their ubiquity, specific characteristics and properties (extremely high mobility in the environment, abilities of accumulation of toxic elements and penetration in living organisms) and, hence, should be scrutinized.
The study of environmental NPs remains a challenge for analytical chemistry. In fact, NPs in a polydisperse environmental sample may represent only one thousandth or less of the bulk sample. Consequently, a considerable sample weight must be handled to separate amount of NP fraction sufficient for their dimensional and quantitative characterization. Moreover, there is the lack of unified analytical methodologies for recovering nanoparticulate fractions for their subsequent quantitative analysis [4,5]. Nowadays various techniques can be used for the separation of nanoparticles from environmental particulate samples. Environmental nanoparticles can be fractionated by membrane filtration, centrifugation, or field-flow fractionation (FFF) techniques. Due to their advantages (that will be discussed in detail in Chapter 1), the group of field-flow fractionation (FFF) techniques can serve as a basis for the development of unified methodology applicable to the study of environmental NPs.
This doctoral thesis focuses on the complementary use of asymmetrical flow and coiled tube field-flow fractionation techniques in the analysis of environmental particulate samples. Volcanic ashes from different regions of the world were taken as test samples. As compared, for example, to street dust, which has both anthropogenic and natural origin, volcanic ash is only from one source (volcanic eruption). The ash samples with particles size over a very wide range (from nanometre to millimetre) are characterized by an extremely low content of organic matter [6]. Therefore, volcanic ashes look to be appropriate “simple” samples for the comparative study of different separation methods and the development of a methodology for the recovery of nanoparticle fractions from polydisperse environmental solids. Furthermore, volcanic eruptions are one of the main sources of natural nanoparticles. During one eruption, more than 30 million tons of ash can be ejected to the height of tens of kilometers and reach the stratosphere, where volcanic ash
particles may spread worldwide and affect all areas of the Earth for years [7]. For example, it is known that airborne volcanic ash particles contribute to cooling of Earth surface due to ability of absorption and scatter solar radiation [8]. In addition, volcanic ash as a source of nutrient elements (e.g. iron and phosphorus) can increase bioproductivity of phytoplankton [9] and affect the global balance of CO2 and hence climate change [10]. Along with nutrient elements, volcanic ash also contains toxic elements. Moreover, according to recent studies, particles of volcanic ash can accumulate toxic and potentially toxic elements; the concentration of these elements in NPs can be one or two order of magnitude higher than bulk ones [3,6].
The manuscript of doctoral thesis consists of three chapters. The first chapter is synthesis and assessment of bibliography concerning to the subject of the present study. It presents the examination of various approaches and techniques applied to the separation of environmental nanoparticles. Recent examples of studies on environmental nanoparticles of various origin for instance, dust, natural water colloids, and ashes, are also considered in this chapter.
The second chapter describes materials, reagents, techniques, and procedures which were used for the study of volcanic ash nanoparticles.
The third chapter considers results of the development of methodology based on the complementary use of asymmetrical flow and coiled tube field-flow fractionation techniques for the study of volcanic ash nanoparticles. Furthermore, the results related to the investigation of stability of environmental nanoparticles are also given. The new coiled tube field-flow fractionation procedure is proposed.
Finally, the general conclusion summarizes all the results obtained in the present study and describes possible perspectives.
The text of the present manuscript contains data of three articles published in international scientific journals and one submitted article. All the articles were prepared within the framework of this doctoral thesis. The list of articles is given in appendix.
Introduction générale
Selon la définition conventionnelle, une nanoparticule (NP) est un nano-objet ayant ses trois dimensions externes dans la plage de taille allant d'environ 1 à 100 nm [1]. Cependant, d’un point de vue comportemental, la gamme sub-micrométrique (c’est-à-dire inférieure ou égale à 1000 nm) doit être considérée pour tenir compte à la fois des nanoparticules primaires et des assemblages de nano-objets [2]. Les nanoparticules peuvent avoir différentes origines telles que l’érosion des sols, les éruptions volcaniques, les tempêtes de poussière, ou encore les feux de forêt. Elles font donc partie intégrante des compartiments environnementaux [2,3]. Les NP environnementales présentent un risque potentiel pour la santé humaine et les écosystèmes en raison de leur ubiquité, de leurs caractéristiques et de leurs propriétés spécifiques. Plus particulièrement les NP ont une mobilité extrêmement élevée dans l'environnement, une capacité à associer, voire à concentrer des éléments toxiques et à pénétrer dans les organismes vivants. Les nanoparticules doivent donc être considérées avec une attention particulière dans les études environnementales.
Néanmoins, l'étude des NP dans l'environnement demeure un défi pour la chimie analytique. En effet, les nanoparticules présentes dans un échantillon environnemental polydispersé peuvent représenter seulement un millième ou moins de la masse de l'échantillon global. Par conséquent, une masse d'échantillon considérable doit être manipulé pour séparer une quantité de nanoparticules suffisante pour leur caractérisation dimensionnelle et quantitative. De plus, il n'y a pas de méthodologie analytique unifiée pour récupérer différentes fractions nanoparticulaires en vue de leur analyse quantitative ultérieure [4,5]. De nos jours, diverses techniques peuvent être utilisées pour séparer les nanoparticules d'échantillons de particules environnementales. Les nanoparticules environnementales peuvent être fractionnées par des techniques de filtration sur membrane, de centrifugation ou de fractionnement flux−force (FFF). En raison de leurs avantages (qui seront examinés en détail au chapitre 1), l’ensemble des techniques de fractionnement par flux−force peut servir de base pour le développement d'une méthodologie unifiée applicable à l'étude des NP environnementales.
Cette thèse de doctorat porte sur l'utilisation complémentaire des techniques de fractionnement à flux asymétrique et à colonne tournante pour l'analyse d'échantillons de particules environnementales. Des cendres volcaniques de différentes régions du monde ont été prélevées afin de servir d’échantillons tests. Par rapport, par exemple, à la poussière de rue, qui a à la fois une origine anthropique et naturelle, les cendres volcaniques ne proviennent que d'une seule source (éruption volcanique). Les échantillons de cendres dont la taille des particules est très large (du nanomètre au millimètre) sont caractérisés par une teneur extrêmement faible en matière organique
[6]. Par conséquent, les cendres volcaniques peuvent être considérées des échantillons «simples» appropriés pour l'étude comparative des différentes méthodes de séparation et le développement d'une méthodologie pour la récupération de fractions de nanoparticules à partir de solides environnementaux polydispersés. De plus, les éruptions volcaniques sont l'une des principales sources de nanoparticules naturelles. Lors d'une éruption, plus de 30 millions de tonnes de cendres peuvent être éjectées à une hauteur de dizaines de kilomètres et atteindre la stratosphère, où les particules de cendres volcaniques peuvent se propager dans le monde entier et atteindre toutes les régions de la Terre pendant des années [7]. Par exemple, on sait que les particules de cendres volcaniques en suspension dans l'air contribuent au refroidissement de la surface de la Terre en raison de leur capacité d'absorption et de diffusion du rayonnement solaire [8]. De plus, les cendres volcaniques en tant que source d'éléments nutritifs (par exemple le fer et le phosphore) peuvent augmenter la bioproductivité du phytoplancton [9] et affecter l'équilibre global du CO2 et donc le changement climatique [10]. Outre les éléments nutritifs, les cendres volcaniques contiennent également des éléments toxiques. Ainsi, selon des études récentes, les particules de cendre volcanique peuvent accumuler des éléments toxiques et potentiellement toxiques ; la concentration de ces éléments dans les nanoparticules peut alors être supérieure d'un ou deux ordres de grandeur à celle des éléments présents dans l’échantillon global [3,6].
Ce manuscrit de thèse de doctorat comprend trois chapitres. Le premier chapitre est une synthèse bibliographique concernant le sujet de la présente étude. Il examine les diverses approches et techniques appliquées à la séparation des nanoparticules environnementales. Des exemples récents d'études sont donnés concernant des nanoparticules de diverses origines, telles que des poussières, des colloïdes aquatiques naturels et des cendres.
Le deuxième chapitre décrit les matériaux, réactifs, techniques et procédures qui ont été utilisés pour l'étude des nanoparticules de cendres volcaniques.
Le troisième chapitre présente les résultats du développement méthodologique basée sur l'utilisation complémentaire des techniques de fractionnement à flux asymétrique et à colonne tournante pour l'étude des nanoparticules de cendres volcaniques. Complémentairement, la stabilité de ces nanoparticules y est abordée. Une nouvelle procédure de fractionnement en colonne tournante est également proposée.
Enfin, la conclusion générale reprend tous les principaux résultats obtenus et présente les perspectives possibles à cette étude.
Le texte du présent manuscrit contient les données de trois articles publiés dans des revues scientifiques internationales et d'un article soumis. Tous les articles ont été préparés dans le cadre de cette thèse de doctorat. La liste des articles est donnée en annexe.
Введение Согласно общепринятому определению, наночастица – это объект, размер которого хотя бы в одном из измерении составляет от 1 до 100 нм [1]. Следует отметить, что частицы окружающей среды в нанометровом диапазоне обладают различной морфологией (наностержни, наносферы, нанопластины, нановолкна и др.) и могут образовывать скопления (агломераты), свойства и характеристики которых отличны от свойств и характеристик образующих их частиц [2]. В связи с вышеизложенным частицы и их скопления в субмикронном диапазоне размеров (≤ 1000 нм) тоже следует рассматривать с точки зрения изучения окружающей среды, чтобы при исследовании сложных полидисперсных образцов (например, пыль и пепел) были учтены их разнообразные составляющие и свойства, в том числе наночастицы и их скопления, параметры и свойства данных наночастиц и скоплений [2]. Наночастицы, которые имеют различные источники происхождения (эрозия почв, вулканические извержения, пылевые бури, лесные пожары и др.), являются неотъемлемой частью окружающей среды [2,3]. Наночастицы окружающей среды могут быть потенциально опасны для здоровья людей и состояния экосистем из-за своих характеристик и свойств (повышенная подвижность в окружающей среде, возможность аккумулировать токсичные элементы и проникать в живые организмы) и, следовательно, требуют тщательного изучения. Исследование наночастиц осложнено их незначительным количеством в исходных полидисперсных образцах окружающей среды, которое обычно составляет сотые и в редких случаях десятые доли процентов. Кроме того, наночастицы должны быть выделены из исходных образцов в необходимом для их последующего изучения и анализа количестве. Кроме этого, в настоящее время отсутствует единый подход в выделению фракций наночастиц для их последующего количественного анализа [4,5]. Различные методы можно использовать для выделения наночастиц из полидисперсных образцов окружающей среды. Наночастиц окружающей среды могут быть выделены методами мембранной фильтрации, седиментации и проточного фракционирования в поперечном силовом поле (ПФП). Благодаря своим преимуществам, которые будут подробно описаны в первой главе, группа методов ПФП может послужить основой для создание единого подхода, применяемого к изучению наночастиц окружающей среды. Настоящая докторская работа направлена на развитие подхода, основанного на взаимодополняющем применение методов асимметричного проточного фракционирования
с поперечным потоком и фракционирования частиц во вращающейся спиральной колонке при исследовании полидисперсных образцов окружающей среды. Вулканический пепел, отобранный в разных региона мира, изучали в настоящей работе. вулканический пепел может быть «удобным» образцом для разработки методологии исследования наночастиц окружающей среды из-за его относительно однородной минеральной структуры. По сравнению с частицами городской пыли, которые имеют как естественные, так и антропогенные источники происхождения, частицы пепла образуются только в результате вулканической активности. Образцы вулканического пепла содержат частицы с широким диапазоном размеров от нанометра до миллиметра и характеризуются низким содержанием органического вещества [6]. В дополнение к изложенному следует отметить, что извержения вулканов являются одним из основных источников образования природных наночастиц. Во время одного извержения более 30 миллионов тонн пепла могут выбрасываться на высоту десятков километров и достигать стратосферы. Частицы вулканического пепла в нанометровом диапазоне размеров могут распространятся по всему миру и являться причиной негативного воздействия на многие регионы Земли в течение многих лет [7]. Наночастицы вулканического пепла, находящиеся в атмосфере, изменяют температурный режим планеты, рассеивая и поглощая длинные и короткие волны солнечной радиации [8]. Питательные элементы (железо и фосфор), содержащиеся в наночастицах вулканического пепла, увеличивают биопродуктивность фитопланктона, что приводит к изменениям в биогеохимических процессах в мировом океане [9] и оказывает влияение на мировой баланс CO2 и, следовательно, изменяет климат [10]. Наночастицы вулканического пепла могут концентрировать на своей поверхности токсичные элементы и вещества [14,15,91]. Следует отметить, что содержание токсичных элементов в данных наночастицах может быть на порядок и более выше, чем в микрочастицах пепла [14,15]. Таким образом, наночастицы вулканического пепла могут быть потенциально опасны для экосистем и здоровья людей в локальном и мировом масштабах. Вместе с питательными веществами, наночастицы также могут содержать токсичные элементы; содержание токсичных элементов в данных наночастицах может быть на порядок и более выше, чем в микрочастицах пепла [3,6]. Текст докторской диссертации состоит из трёх глав. В первой главе проведён обзор литературы, соответствующей предмету настоящего исследования. В данной главе представлены различные подходы и методы, применяемые для разделения полидисперсных образцов окружающей среды. Кроме этого, в данной главе также приведены примеры
современных исследований наночастиц окружающей среды, имеющих различные источники образования, например, пыль, естественные водные коллоиды и пепел. Вторая глава описывает материалы, реактивы, методы и методики, используемые в настоящем исследовании наночастиц вулканического пепла. Третья глава содержит результаты развития методологии, основанной на взаимодополняющем применении метода ассиметричного проточного фракционирования с поперечным потоком и фракционирование частиц во вращающейся спиральной колонке. Кроме этого, в третьей главе приведены результаты исследования стабильности суспензий наночастиц окружающей среды. Новая методика фракционирования частиц во вращающейся спиральной колонке была также предложена в настоящей главе. Заключение содержит описание всех полученный результатов в настоящей работе и возможные перспективы развития настоящего исследования. Текст диссертационной работы содержит информацию, изложенную в трёх опубликованных в международных научных журнал статьях и в одной статье, которая была направлена в редакцию. Все перечисленные статьи сделаны в рамках настоящей докторской работы. Список статей приведён в приложение.
Chapter 1 State of the art
1.1 Introduction
The characterization of particles over a size range of less than 100 µm remains a challenge in field of environmental studies [3,11–17]. Such characterization is all the more important since most physical and chemical properties of these objects are linked to their size [3,11]. Therefore, determining the characteristics of polydisperse sample as a function of size and obtaining the associated size distributions are needed for a comprehensive investigation. Among the different analytical strategies for obtaining this information, the size fractionation of the sample under study is an attractive way of investigation.
Nowadays various techniques can used for the fractionation of (sub) micron-sized objects. Analytes with size 1-100 µm can be fractionated by membrane filtration, field-flow fractionation (FFF), split flow thin cell fractionation (SPLITT), sedimentation, or centrifugation. Analytes with size less than 1 µm can be fractionated by capillary electrophoresis, gel chromatography, membrane filtration, centrifugation, or FFF [18–21]. Among this set of techniques, on line separation is the most efficient; and among on line separation techniques, only FFF enables analytes to be fractionated over the nano- and micrometric size ranges.
FFF is a rapidly elaborating family of techniques, with increased selectivity, sensitivity, resolution and wide applications. The concept of FFF was proposed by J.C. Giddings in 1960s [22]. Analytes of very varied nature such as biological cells, particles, and/or macromolecules can be fractionated on the basis of their physical and/or chemical characteristics in a carrier liquid which can also be of varied nature, typically aqueous or organic. Unlike chromatography FFF does not require a stationary phase, which minimizes sample breakthrough effects or the analytes or their interactions with the stationary phase. The separation is performed in a thin (0.05-0.5 mm) ribbon-like channel under the action of a physical force applied at a right angle to the channel and owing the non-uniform flow velocity profile of a carrier liquid. FFF enables analytes from 1 nm to 100 µm to be fractionated with a higher resolution than offline techniques and most online techniques [18,23,24]. The group of FFF techniques can be divided into sub-techniques according to the nature of the applied force field, which can be hydrodynamic, gravitational, thermal, magnetic, acoustic, electrical, etc. Flow FFF (FlFFF) can be considered as the most versatile FFF subtechnique; it employs a nonspecific hydrodynamic force across the channel [18,23]. In turn, sedimentation FFF (SdFFF) employs a centrifugal force field to fractionate analytes in a wide size
range, from approximately some tens nanometers up to some hundreds micrometers [12,24–26]. Moreover, as compared to other FFF subtechniques including asymmetrical flow FFF (A4F), the advantage of SdFFF is absence of membrane, which is an integral part of A4F technique; there are no interactions between membrane material and particles to be separated in SdFFF.
Nevertheless, it should be noted that FFF has an important limitation, namely, the mass of injected sample, which should not exceed 1 mg to avoid overloading the system. Therefore, FFF is mainly used in analytical couplings with sufficiently sensitive detectors and not as a preparative tool. In addition, since the separation performance is strongly related to the quantity injected, the sample preparation and in particular homogenization prior separation is essential in order to provide representative results [4,18].
The fractionation in a rotating coiled column (RCC) can also be attributed to FFF family, and also using a centrifugal force field. This non-conventional SdFFF technique is called coiled tube FFF (CTFFF).[27] One of its interests is that the mass of the loaded sample introduced in a long column can be increased up to at least 1 g (see details in the next part). The method was applied to samples of soil, street dust and volcanic ash, for which the particles were sorted into different size fractions [6,28–30].
Split flow thin cell fractionation technique should be also mentioned since it is similar to FFF[18,31] and can also employ gravitational or centrifugal force field [32–35]. In addition to the gravitational and centrifugal fields, magnetic [36] and electric [37] force fields may be used for SPLITT fractionation. Like in CTFFF, large amounts of sample (up to gram level) can be fractionated using SPLITT technique. However, during one experimental run SPLITT technique is capable to recover only two fractions (e.g. particles with size <10 and >10 µm). Therefore, for the separation of more than two fractions, the use of multi-stage procedures is required [18,31].
The present chapter mainly focuses on the recent advances in theory and applications of A4F, sedimentation FFF in thin channels and rotating coiled columns. SPLITT technique is also considered. The four types of methods are compared and critically evaluated. The promising directions for the further development of the methods are also discussed.
1.2 Theoretical background and instrumentation
1.2.1 Sedimentation field-flow fractionation
In the SdFFF, the fractionation is performed in a circular flat channel inserted inside a centrifugal basket (Fig. 1). For this method, which employs flat channels with volumes of about a few millilitres and laminar flows, the theory is relatively well developed.[23,38] Firstly, the behaviour of analytes can be explained in a simple and general way, without taking into account the type of force applied, and in the case of hard spherical particles. In normal mode, the force induced by the field applied perpendicularly to the flow initially leads to the accumulation of particle on the channel wall (named accumulation wall). This generates an opposing diffusive force, which gives the particle its position at a certain height above the wall. Since the flow has parabolic velocity profile, this position leads the particle to acquire a specific longitudinal velocity. Therefore, a retention time that can be expressed by:
𝑡𝑅 = <𝑣>𝑡0
<𝑈𝑧>, (1)
where < 𝑣 > is the average velocity of the mobile phase in the section of the channel, 𝑡0 is the void time and< 𝑈𝑧 >is the average longitudinal velocity of the particles injected.
Figure 1. Schematic formalization of (a) SdFFF instrumentation, (b) parabolic flow of the mobile phase in the channel, and (c) normal and (d) steric modes of elution in FFF; x: transverse axis; z:
longitudinal axis
The average longitudinal velocity depends on the longitudinal velocity in each point 𝑥 of the channel height (due to the laminar flow), the particle concentration at the point 𝑥 (described on the basis of Fick’s second law and Maxwell-Boltzmann distribution), and the particle distribution in the channel height, which lead to:
< 𝑈𝑧 >= −6 < 𝑣 > 𝐷 𝑊𝑈𝑥[ 𝑒−𝑤𝑈𝑥𝐷 +1 𝑒−𝑤𝑈𝑥𝐷 −1 + 2𝐷 𝑤𝑈𝑥], (2)
where 𝐷 is the diffusion coefficient, 𝑤 is the channel height, 𝑈𝑥 is the particle transverse velocity (in the channel height). By replacing (2) in (1), the retention time in normal mode can be generally expressed as: 𝑡𝑅 = 𝑡0 6 𝐷 𝑊𝑈𝑥[ 1+𝑒𝑤𝑈𝑥𝐷 1−𝑒𝑤𝑈𝑥𝐷 −2𝐷 𝑤𝑈𝑥] (3)
The transverse velocity can be expressed specifically according to the nature of the force applied. Thus, in SdFFF,
< 𝑈𝑥 >=𝑉𝐷 𝑘𝑇(𝜌
′− 𝜌)𝑔, (4)
where 𝜌′ is the particle density, 𝜌 is the mobile phase density, 𝑉 is the particle volume, 𝑔 is the centrifugal acceleration, 𝑘 is the Boltzmann’ constant and 𝑇 is the temperature. The retention time in normal mode can be then specifically expressed as:
𝑡𝑅 = 𝑡0 6 𝑘𝑇 𝑤𝑉(𝜌′−𝜌)𝑔{𝑐𝑜𝑡ℎ[ 𝑤𝑉(𝜌′−𝜌)𝑔 2𝑘𝑇 ]− 2𝑘𝑇 𝑤𝑉(𝜌′−𝜌)𝑔} (5)
When there is a significant retention of the particles, the terms in parenthesis in the equations (3) and (5) tends to 1. In addition, the amount 𝑉(𝜌′− 𝜌)𝑔 is defined as the effective mass, noted 𝑚𝑒 (the second part of this expression, 𝑉𝜌𝑔, corresponding to the buoyant mass). Then, equation (5) can be simplified, and re-written as follows:
𝑚𝑒 = 6𝑘𝑇
𝑡0𝑤𝑔𝑡𝑅 (6)
This expression is more useful in analytical sciences since the effective mass can be deduced from the measurement of the retention time. Taking into account the analyte as a population of hard spherical particles, 𝑉 can be expressed according to the particle radius (𝑟𝑝); with the same simplification and rewriting concerning equation (5), one can obtained:
𝑡𝑅 =2𝜋𝑤(𝜌′−𝜌)𝑔𝑡0 9𝑘𝑇 𝑟𝑝
3 (7)
This equation illustrates the strong dependence of retention time on size (as a cubic function of the radius), and also on density of the analyte.
In steric mode, the diffusive force opposing the force induced by the applied field is relatively weak as compared to the repulsive and/or lift forces. Therefore, the position of the particle in the height of the channel, i.e. its distance from the accumulation wall, depends mainly on the size of the particle (or its radius in the case of a sphere). The expression of the retention time can be obtained from equation (3) according to:
𝑡𝑅 = 𝑡0 6(𝑎−𝑎2)+6 𝐷 𝑤𝑈𝑥(1−2𝑎)[ 1+𝑒−𝑤𝑈𝑥𝐷 (1−2𝑎) 1−𝑒−𝑤𝑈𝑥𝐷 (1−2𝑎) − 2𝐷 (1−2𝑎)𝑤𝑈𝑥] (8)
where 𝑎 is the ratio between the particle radius and the channel height (𝑟𝑝⁄𝑤).
Specifically to SdFFF, and also expressing the volume 𝑉 according to the radius of a spherical particle, equation (8) can be rewritten as:
𝑡𝑅 = 𝑡0 6(𝑎−𝑎2)+9 𝑘𝑇 2𝑤𝜋𝑟𝑝3 (𝜌′−𝜌)𝑔(1−2𝑎){𝑐𝑜𝑡ℎ[ 2𝑤𝜋𝑟𝑝3 (𝜌′−𝜌)𝑔 3kT (1−2𝑎)]− 3𝑘𝑇 2(1−2𝑎)𝑤𝜋𝑟𝑝3 (𝜌′−𝜌)𝑔} (9)
This expression also shows that in steric mode, as in normal mode, the retention time strongly depends on the size of the analyte, and also on its density.
1.2.2 Flow field-flow fractionation
It has been already mentioned that flow field flow fractionation is the most versatile subtechnique employing the cross-flow as the external force field. This technique provides a nonspecific hydrodynamic force field along the channel formed by a secondary mobile phase, namely, cross-flow. The particles under separation are migrated by the cross-flow toward the surface of accumulation channel (permeable membrane). The separation is based on the difference in diffusion coefficients which are corresponded to the positions of individual species in the laminar carrier fluid profile. The type of utilization membrane depends on the properties of particles to be separated. The application of flat and smooth membranes is required because any membrane flaws would have impact on separation process. Regenerated cellulose is widely used material for FlFFF membranes. Separation by FlFFF is on the basis of the of the particles effective size, and separation is independent of density. In case of SdFFF, the separation is provided depended on size and density [18,23,39]. Two different types of FlFFF can be highlighted: asymmetric and symmetric flow FFF (Fig. 2).
Figure 2. Schematic view of symmetric (a) and asymmetric (b) flow field-flow fractionation.
In the case of symmetrical FlFFF, the carrier fluid is pumped directly across the channel thought porous frits and formed the cross-flow. Both walls of the channel are permeable, but ultrafiltration membrane impermeable to the analytes covers the accumulation wall [40]. Symmetrical FFF can be applied to separation of samples with various nature such as viruses, dissolved organic matter, colloids, manufactured nanoparticles etc. [18,23,41–43].
In asymmetric FlFFF (also called A4F), the most commonly used FlFFF type, only one channel wall (accumulation wall) is permeable for carrier-fluid, which passing through it formed cross-flow. The channel in A4F technique has a trapezoid shape to avoid losses of axial flow of carrier fluid across the channel [44]. Separation efficiency in A4F significantly depends on the channel geometry [18,23,45]. This technique has widely field of application in characterization of environmental as well as biological and technological samples. It also can be used for the characterization of PSD of PM under study [46–54].
The theory of FlFFF technique has been described in detail in various papers [23,45,55,56]. Therefore, in the present work it is given briefly. The transverse velocity can be expressed in FlFFF can be express as follows[23]:
< 𝑈𝑥 >=𝑄𝑐
𝑉0𝑤, (10)
where 𝑄𝑐 is the cross-flow rate, 𝑉0 is the void volume.
𝑡𝑅 = 𝑡0 6𝐷𝑉0 𝑤2𝑄𝑐{𝑐𝑜𝑡ℎ[ 𝑤2𝑄𝑐 2𝐷𝑉0]− 2𝐷𝑉0 𝑤2𝑄𝑐} (11)
Retention time in steric mode is expressed as follows [23]:
𝑡𝑅 = 𝑡0 6(𝑎−𝑎2)+6𝐷𝑉0 𝑤2𝑄𝑐(1−2𝑎){𝑐𝑜𝑡ℎ[ 𝑤2𝑄𝑐 2𝐷𝑉0(1−2𝑎)]− 2𝐷𝑉0 (1−2𝑎)𝑤2𝑄𝑐} (12)
A4F technique has become highly demanded compared to symmetric flow FFF in environmental studies which are discussed below.
1.2.3 Coiled tube field-flow fractionation
CTFFF can be attributed to the family of FFF techniques as a variation of conventional SdFFF (the latter simply being called SdFFF, thus differentiating from the CTFFF below). Unlike SdFFF, the separation channel in CTFFF is coiled onto the drum of a planetary centrifuge. The coiled column (bobbin) rotates around its axis and at the same time revolves around the central axis of the centrifuge with the aid of a planetary gear. The axes of rotation and revolution are parallel (Fig. 3). It should be noted that planetary centrifuges have been widely applied to countercurrent chromatography[57] As compared to SdFFF, the separation process in CTFFF has two significant differences. Firstly, the sample to be fractionated is not injected into a thin channel but is pumped with the carrier flow through a long rotating coiled tube (inner capacity of common analytical column is about 20-25 mL). Secondly, the separation in CTFFF occurs under the action of the complex asymmetrical force field generated by the planetary centrifugal motion [18,58]. Hence, the behaviour of particles is much more complicated than in the channel for conventional SdFFF.
Figure 3. The planetary centrifugal motion for CTFFF. Photo of the instrument (a) and principal scheme (b).
For the first time the uneven distribution of polymer particles of different sizes in rotating coiled columns was observed by Y. Ito in 1960s.[59] However, the studies on particle separation by CTFFF were continued only in early 2000s by P. Fedotov.[60] The behaviour of particles of different nature and size in CTFFF under controlled operating conditions was systematically studied.[58,61] The particles were fractionated at a constant rotation speed of the column and stepwise increasing of the flow rate of the carrier liquid. As a theoretical background, two hypothetical modes of the motion of particles in rotating coiled columns were suggested: migration of the particles in the mobile phase (carrier liquid) flow and migration of particles along the column walls.[58,61] After the suspended particles are injected into the column, they began to migrate in the carrier liquid flow and the distance covered by a particle before the sedimentation of the column wall can be expressed as follows [61]:
𝐿𝑠 = 𝑈𝑤𝑡𝑠 ≈ [𝑣 − 𝐾𝑣𝑅2𝜔2𝑟𝑝4∆𝜌2 2𝜋𝑟𝜂2 ]
𝑑𝜂 𝑟𝜔2𝑟
𝑝2Δ𝜌, (13)
where 𝑈𝑤 is the speed of a particle relative to the tube walls, 𝑣is the linear velocity of the carrier liquid, 𝑡𝑠 is the time needed for the sedimentation of a particle, 𝐾𝑣 is the shape-dependent coefficient, 𝑅 is the revolution radius, 𝑟 is the column rotation radius, 𝜔 is the column rotational speed, Δ𝜌 is the difference in density between particles and mobile phase (𝜌′− 𝜌), 𝜂 is the dynamic viscosity of the mobile phase; 𝑑 is the inner diameter of the tube.
If the distance covered by a particle before the sedimentation of the column wall is greater than the length of the column, this particle is not retained. The retained particles are distributed along the column wall depending on their radii and other parameters given in Eq. 10. These particles can further migrate along the column walls if the sum of Archimedean (buoyancy, 𝐹𝐴) and hydrodynamic (𝐹ℎ𝑦𝑑) forces is greater than the force of mechanical interaction of particles (𝐹𝑚𝑒𝑐ℎ) with column material (the force “retaining” particles on the walls) [61]:
𝐹𝑎+ 𝐹ℎ𝑦𝑑 > 𝐹𝑚𝑒𝑐ℎ (14)
This expression can be transformed[61]:
𝑣𝜂 > 𝐾𝑟𝜔2Δ𝜌𝑟𝑝𝑛 (15)
where 𝐾 is a constant, 𝑛 = 1 2⁄ ÷ 1 (depending of the shape of particles and/or the smoothness of the column walls).
Theoretical and experimental dependencies of the critical linear velocity of the carrier liquid flow, which is needed for the migration of particles along the column walls, on the particle radius are in agreement [58,61]. This has been demonstrated for the fractionation of reference sample of quartz sand BCR-70 and mixture of silica samples Silasorb-300 and Silasorb-600 at stepwise increasing of the flow rate of the carrier liquid.[58]
On the basis of theoretical modeling it was suggested that modification of geometry of column drum could enable submicron and nanoparticles to be fractionated without a significant increase in the column rotation speed. A conical column and a cylindrical column with two symmetrical protrusions were designed, fabricated, and tested using a series of synthetic and natural samples.[58] However, significant retention of submicron particles was not observed, while the increase in resolution was demonstrated. Taking as example the fractionation of silica standards (150, 390, and 900 nm), it has been shown that the purity of three fractions separated in the cylindrical column with two symmetrical protrusions is 87–98% whereas the fractions separated in the conventional cylindrical column contain only 70–84% of the target particles.[58] In general, despite the insufficiently developed theory, CTFFF has given rise to a series of interesting and promising applications.
1.2.4 Split flow thin cell fractionation
The idea of particle fractionation across in a SPLITT channel came from J. Giddings [31]. Ordinary SPLITT channel is equipped by stream splitters. Thus, the SPLITT system has two inlets at one side of the channel and two outlets at the other side. The fractionation is performed under the combined action of a gravitational force field and flow rates. The sample to be separated is usually introduced into the upper inlet as continuous flow. The injected sample forms a thin layer along the upper wall of the channel; the thickness of this layer is equal to the distance between the upper channel wall and inlet splitting plane. Close to outlets of channel is the outlet plane; its position depends on the ratio of the upper and lower flow rates [18].
The schematic illustration of SPLITT technique is shown in Fig. 4. The theory of SPLITT technique has been described in details in various papers [32,62–64]. In general, the separation of particles in SPLITT system is governed by Stokes’ law. The retention time that correspond to the time required for particles migrating to traverse the transport region of thickness can be expressed as follows:
𝑡𝑅 = 18𝑤𝜂
Δρ𝑔𝑑𝑝2 , (16)
where 𝑤 is the thickness of SPLITT cell, 𝜂 is the viscosity of the mobile phase, Δρ is the difference in density between particles and mobile phase, 𝑔 is the centrifugal acceleration, and 𝑑𝑝 is the diameter of particle.
In turn, in the case of conventional SPLITT fractionation (CSF) mode, when two inlets (inlets 1 and 2) are used, the volumetric flow rate 𝑉(𝑡) coursing through the transport region between the two splitting planes can be expressed in either of two forms.
𝑉(𝑡) = 𝑉(𝑎) − 𝑉(𝑎′) = 𝑉(𝑏′) − 𝑉(𝑏), (17)
where 𝑉(𝑎′) and 𝑉(𝑏′) are volumetric flow rates entering inlets 1 and 2, respectively, while 𝑉(𝑎) and 𝑉(𝑏) are volumetric flow rates exiting outlets 1 and 2.
In the case of using only inlet 1 (full feed depletion SPLITT fractionation (FFDSF) mode), it becomes [65–67]:
𝑉(𝑡) = 𝑉(𝑎′) − 𝑉(𝑏) (18)
Generally, the expression of the volumetric flow rate Δ𝑉 can be given as follows:
Δ𝑉 =𝑏𝐿𝑔Δρ𝑑𝑝2
18𝜂 , (19)
where 𝑏 and 𝐿 are the breadth and length of the SPLITT cell, respectively (and, therefore, 𝑏𝐿 is the working area of the cell in the plane perpendicular to the field). All particles will exit from the outlet 2 when: Inlet 1 Inlet 2 Outlet 2 Outlet 1 Force field Splitter Splitter 𝑉(𝑎′) 𝑉(𝑏′) 𝑉(𝑎) 𝑉(𝑏) Figure 4. Schematic view of SPLITT channel
Δ𝑉 > 𝑉(𝑡) (20)
The fractionation retrieval parameter 𝐹2, which corresponds to the separation efficiency at outlet 2 (fig. 4) for CSF mode, can be given as follows[64]:
𝐹2 = ∆𝑉−𝑉(𝑡) 𝑉(𝑎′) (21) In FFDSF mode it will be 𝐹2 = ∆𝑉−𝑉(𝑡) 𝑉(𝑏) (22)
Depending on study [32,37,64,68–72] the cut-off diameter (𝑑𝑐) can be considered as the diameter at which 50% or 100% of the particles of a mixture to be separated exit outlet 2 (fig. 4) and, thus, 𝐹2 equals 0.5 or 1, respectively. Therefore, for CSF, the cut-off diameter can be calculated by substituted 𝐹2 = 0.5, eq. 14, and 16 in eq. 18 and expressed as follows:
𝑑𝑐 = √
18𝜂[𝑉(𝑎)−0.5 𝑉(𝑎′)]
𝑏𝐿𝑔Δρ (23)
In the case of using 𝐹2 = 1, the eq. 20 is modified into
𝑑𝑐 = √18𝜂[𝑉(𝑎)− 𝑉(𝑎′)]
𝑏𝐿𝑔Δρ (24)
In turn, for FFDSF mode, the cut-off diameter can be expressed depending on the values of 𝐹2 (0.5 or 1) as follows: 𝑑𝑐 = √18𝜂[𝑉(𝑎′)−0.5 𝑉(𝑏)] 𝑏𝐿𝑔Δρ (25) or 𝑑𝑐 = √18𝜂[𝑉(𝑎′)− 𝑉(𝑏)] 𝑏𝐿𝑔Δρ (26)
The SPLITT technique has a niche application in environmental studies.
1.3 Applications to environmental studies
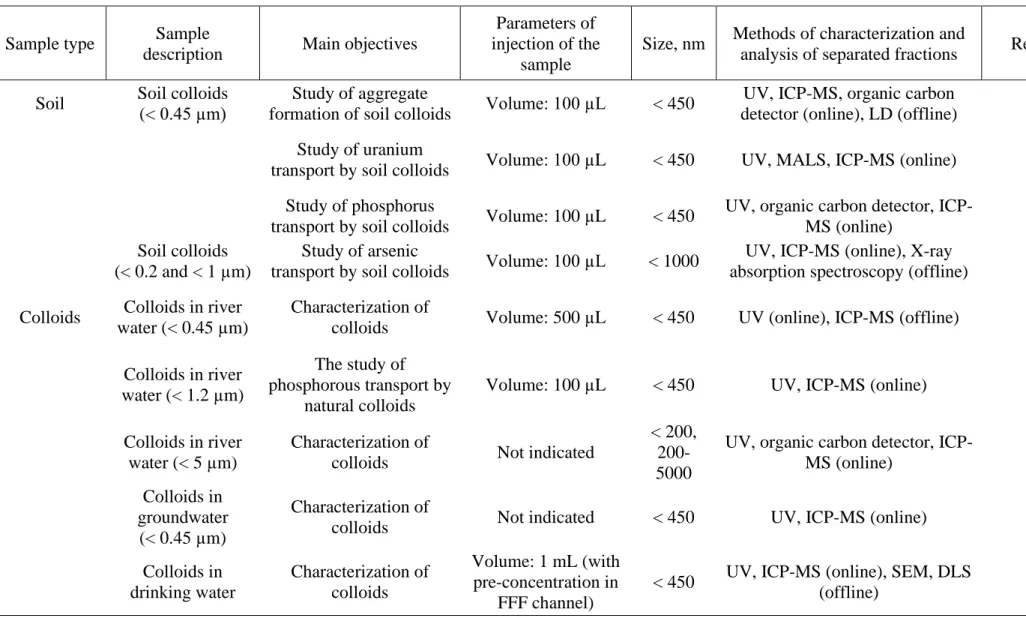
SdFFF, A4F, CTFFF, and SPLITT techniques have been used for fractionation and characterization of complex polydisperse environmental. The main information relative to the applications of SdFFF, A4F, CTFFF, and SPLITT is summarized in Tables 1, 2, 3, and 4, respectively
The fate in the environment, and health effects of nano- and microparticles strongly depend on their size and chemical composition [2,3]. The investigation of nano- and microparticles depending on their size is directly related to their separation from polydisperse environmental samples. In this sense, separation techniques play a crucial role in the study of size-dependent properties of particles in the environment.
Particle size distribution (PSD) is an important characteristic of environmental particulate matter. SdFFF, due to advanced theoretical background, can be used as a tool not only for fractionation of particles, but also for the determination of PSD of environmental samples. For example, SdFFF enabled PSD of fly ash particles (<44 µm) emitted from coal thermo-electric power stations[26] as well as dust particles (10-50 µm) [73] to be characterized. In addition, the size distribution of various elements can be determined by offline or online associating SdFFF with an elemental analysis technique. Offline association involved inductively coupled plasma-atomic emission spectrometry (ICP-AES) for the determination of various elements such as Cu, Zn, Fe, Mn, or, more specifically, cold vapour electrothermal atomic absorption spectroscopy (CV-ETAAS) for the study of mercury. The use of SdFFF associated offline with ICP-AES or CV-ETAAS enabled element size distribution in size fractions less than 2 µm including several submicron fractions to be established.[26,73–75] In clay materials, different fractions starting from 60 nm were investigated; such an approach led to better understanding clay properties such as charge, swelling, delamination, and chemical composition depending on size [75]. Online association of SdFFF with elemental analysis technique was also reported. In environmental studies, such coupling preferentially involved inductively coupled plasma-mass spectrometry (ICP-MS) due to its higher sensitivity. As a typical example, engineered TiO2 nanoparticles were determined in both sea and lake waters [76]. Such study demonstrates that SdFFF-ICP-MS can be considered as a relevant tool for the monitoring of engineered NPs in natural waters, which is challenging due to very low
analyte concentrations in matrices containing many various dissolved and colloidal species possibly in high concentrations.
The A4F as the most popular type of flow field-flow fractionation techniques has wide field of application in characterization of environmental samples. The transport of arsenic [77,78], uranium [79], and phosphorus [80] by soil colloids as well as transport of phosphorus by river colloids [81] have been investigated using offline and online coupling of A4F and ICP-MS techniques. The online coupling of A4F with ICP-MS can be served as reliable tool for the characterization of environmental colloids in natural [81–85] and drinking [86] water. In addition, this approach was successfully used in the study of polymer-coated quantum dots (CdSe/ZnS and Ag2S) in environmental media such as soils and natural waters for understanding their behaviour and prediction of their fate in the environment [51,87,88]. Moreover, in recent studies [89–98] it has been demonstrated the efficiency of relatively new approach based on coupling of A4F and ICP-MS in single particle mode (sp-ICP-MS) applied to the study of engineered and natural nanoparticles. For instance, the Ag [89–93], modified Ag [94,95], Au [96,97] and natural [98] NPs were detected and characterized by the both online and offline coupling of A4F and sp-ICP-MS.
Despite the advantages of SdFFF and A4F, especially in terms of selectivity and fractionation power, there is a limitation, which is related to the weight of handling sample to be separated. Indeed, to avoid overloading of the system, usually mass of the particulate matter does not exceed 10-20 µg, while volume of suspension is less than 100 µL [26,73–76]. This limitation impedes the quantitative or exhaustive offline analysis of separated fractions, especially the determination of trace elements. Moreover, the number of elements determined online can be limited due to the significant dilution induced by the SdFFF as well as the elution process and therefore the continuous introduction of the fractionated particles into the ICP-MS detector. Besides, taking into account the negligible relative content of NPs (about 0.1% or less) and the high polydispersity of the bulk sample, NP detection and characterization can be impossible without a preparation step. Typically this step aims to selectively recover the particles of interest and hence concentrate these particles and narrow down the initial particle size distribution of the bulk sample.
Table 1. Selected applications of “conventional” sedimentation field-flow fractionation in a thin channel
Sample Type
Sample
description Main objectives
Parameters of injection of the
sample
Size Methods of characterization and
analysis of separated fractions Reference Environmen
tal
particulate matter
Clay Determination of swelling and delamination properties of clay particles of different size
Volume: 100 µL Two fractions with mean particle size 60 and 250 nm
ICP-AES (offline) [75]
Fly ash (<44 µm)
Characterization of particle size distribution
Volume: 20-100 µL <10.3 and 10.3-44 μm
ICP-AES (offline) [26]
Soil (<2 µm) Characterization of the colloidal Hg-bearing fractions Weight of particles: 10 µg; Sample volume: 10 µL Five fractions in the range <2 µm CV-ETAAS (offline) [74]
Dust (<53 μm) Characterization of particles size distribution Volume: 20-40 μL 10-50 μm UV (online) [73] Engineered nanoparticle s TiO2 nanoparticles
Separation and detection of TiO2 NPs in natural waters
- Aggregated/agglo
merated fractions with size 250 and 150 nm
Table 2 Selected applications of asymmetric field-flow fractionation in a thin channel
Sample type Sample
description Main objectives
Parameters of injection of the
sample
Size, nm Methods of characterization and
analysis of separated fractions References
Soil Soil colloids (< 0.45 µm)
Study of aggregate
formation of soil colloids Volume: 100 µL < 450
UV, ICP-MS, organic carbon
detector (online), LD (offline) [99]
Study of uranium
transport by soil colloids Volume: 100 µL < 450 UV, MALS, ICP-MS (online) [79]
Study of phosphorus
transport by soil colloids Volume: 100 µL < 450
UV, organic carbon detector,
ICP-MS (online) [80]
Soil colloids (< 0.2 and < 1 µm)
Study of arsenic
transport by soil colloids Volume: 100 µL < 1000
UV, ICP-MS (online), X-ray
absorption spectroscopy (offline) [77,78]
Colloids Colloids in river water (< 0.45 µm)
Characterization of
colloids Volume: 500 µL < 450 UV (online), ICP-MS (offline) [82]
Colloids in river water (< 1.2 µm)
The study of phosphorous transport by
natural colloids
Volume: 100 µL < 450 UV, ICP-MS (online) [81]
Colloids in river water (< 5 µm)
Characterization of
colloids Not indicated
< 200, 200-5000
UV, organic carbon detector,
ICP-MS (online) [83,84]
Colloids in groundwater
(< 0.45 µm)
Characterization of
colloids Not indicated < 450 UV, ICP-MS (online) [85]
Colloids in drinking water Characterization of colloids Volume: 1 mL (with pre-concentration in FFF channel)
< 450 UV, ICP-MS (online), SEM, DLS
Gas condensates Natural nanoparticles from gas condensates Characterization of natural NPs Volume: 50 µL < 1000
UV, MALS, ICP-MS (online),
TEM-EDS, sp-ICP-MS (offline) [98]
Engineered nanoparticels Ag NPs (mean size 20, 30, 40, 50, 60, 70, 80, 100, and 200 nm) in aquatic suspensions Detection, quantification, and characterization of Ag NPs Volume: 20 and 50 µL < 200
UV, MALS, ICP-MS (online), sp-ICP-MS, sp-ICP-MS, TEM-EDS,
DLS, (offline) [89–92] Ag NPs (40, 60, 80, and 100 nm) in aquatic suspensions Characterization of Ag NPs Volume: 20 µL < 120
UV, ICP-MS, sp-ICP-MS
(online), TEM (offline) [93]
Modified Ag nanoparticles (20,
50, and 75 nm)
Characterization of Ag
NPs Volume: 20 µL < 140
UV, MALS, ICP-MS (online),
sp-ICP-MS (offline) [94,95] Au NPs (10, 30, and 60 nm) in soil and sediment extract matrices Characterization of Au NPs Volume: 100 µL < 1000
UV, MALS (online), DLS,
ICP-MS, sp-ICP-MS (offline) [96,97]
Quantum dots CdSe/ZnS (< 10
nm) in soils
Study behaviour of
CdSe/ZnS in soils Volume: 50 µL < 100
UV, MALS, ICP-MS (online),
TEM-EDS (offline) [51] Quantum dots Ag2S and CdSe/ZnS in aqua solutions Characterization of QDs Volume: 20 µL < 220
UV, MALS, ICP-MS (online), X-Ray diffrection, TEM-EDS
(offline)