LETTER • OPEN ACCESS
Reserves and trade jointly determine exposure to
food supply shocks
To cite this article: Philippe Marchand et al 2016 Environ. Res. Lett. 11 095009
View the article online for updates and enhancements.
Related content
What commodities and countries impact inequality in the global food system?
Joel A Carr, Paolo D’Odorico, Samir Suweis et al.
-The past and future of food stocks
Francesco Laio, Luca Ridolfi and Paolo D’Odorico
-Structure and evolution of the global seafood trade network
Jessica A Gephart and Michael L Pace
-Recent citations
Local food crop production can fulfil demand for less than one-third of the population
Pekka Kinnunen et al
-Defining the Nature of the Nexus: Specialization, Connectedness, Scarcity, and Scale in Food–Energy–Water Management
Stephen L. Katz et al
-Simulating the Cascading Effects of an Extreme Agricultural Production Shock: Global Implications of a Contemporary US Dust Bowl Event
Alison Heslin et al
LETTER
Reserves and trade jointly determine exposure to food supply shocks
Philippe Marchand1, Joel A Carr2, Jampel Dell’Angelo1, Marianela Fader3, Jessica A Gephart2,
Matti Kummu4, Nicholas R Magliocca1, Miina Porkka4, Michael J Puma5, Zak Ratajczak2,
Maria Cristina Rulli6, David A Seekell7, Samir Suweis8, Alessandro Tavoni9and Paolo D’Odorico1,2 1 National Socio-Environmental Synthesis Center(SESYNC), Annapolis, MD 21401, USA
2 Department of Environmental Sciences, University of Virginia, Charlottesville, VA 22904, USA
3 International Centre for Water Resources and Global Change(UNESCO), German Federal Institute of Hydrology, PO Box 200253,
D-56002 Koblenz, Germany
4 Water and Development Research Group
(WDRG), Aalto University, FI-00076 Aalto, Finland
5 Columbia University Center for Climate Systems Research, NASA Goddard Institute for Space Studies, New York, NY 10025, USA 6 Department of Hydraulics, Roadways, Environmental and Surveying Engineering, Politecnico di Milano, Milan I-20133, Italy 7 Department of Ecology and Environmental Science, Umeå University, SE-901 87 Ume, Sweden
8 Department of Physics and Astronomy, University of Padova, I-35131 Padova, Italy
9 Grantham Research Institute on Climate Change and the Environment, London School of Economics, London WC2A 2AE, UK
Keywords: food systems, resilience, food crises Supplementary material for this article is availableonline
Abstract
While a growing proportion of global food consumption is obtained through international trade,
there is an ongoing debate on whether this increased reliance on trade benefits or hinders food
security, and specifically, the ability of global food systems to absorb shocks due to local or regional
losses of production. This paper introduces a model that simulates the short-term response to a food
supply shock originating in a single country, which is partly absorbed through decreases in domestic
reserves and consumption, and partly transmitted through the adjustment of trade
flows. By applying
the model to publicly-available data for the cereals commodity group over a 17 year period, we
find
that differential outcomes of supply shocks simulated through this time period are driven not only by
the intensification of trade, but as importantly by changes in the distribution of reserves. Our analysis
also identifies countries where trade dependency may accentuate the risk of food shortages from
foreign production shocks; such risk could be reduced by increasing domestic reserves or importing
food from a diversity of suppliers that possess their own reserves. This simulation-based model
provides a framework to study the short-term, nonlinear and out-of-equilibrium response of trade
networks to supply shocks, and could be applied to speci
fic scenarios of environmental or economic
perturbations.
1. Introduction
Country-scale food availability depends on domestic production, reserves, and trade. About 24% of the food that is consumed worldwide is available through international trade(e.g., D’Odorico et al2014);
like-wise, 24% of the global agricultural land(Weinzettel et al2013) and 23% of the freshwater resources used
for food production(D’Odorico and Rulli2013) are
accessed through trade. Trade dependency has sub-stantially increased in the last few decades and more than doubled since the mid-1980s(Porkka et al2013, D’Odorico et al2014) likely as a result of liberalization
and the associated removal of subsidies and trade protections in developing countries (e.g., Shafaed-din2005). While international food trade increases the
variety of food products available to customers and helps buffer the impact of local supply shocks(e.g., crop failures), the effect of the liberalization of trade on economic development and food security in the developing world is the subject of a vigorous debate (Schanbacher2010, Oliveira and Schneider2016). It
has been argued that it may allow for an influx of cheap subsidized food commodities from more developed countries, thereby displacing smallholder farmers, undermining rural livelihoods, and enhancing trade
OPEN ACCESS
RECEIVED
5 February 2016
REVISED
2 August 2016
ACCEPTED FOR PUBLICATION
26 August 2016
PUBLISHED
14 September 2016
Original content from this work may be used under the terms of theCreative Commons Attribution 3.0 licence.
Any further distribution of this work must maintain attribution to the author(s) and the title of the work, journal citation and DOI.
dependency in the global south(Shafaeddin2005, De Schutter2014, Godar et al 2015), as some countries
increasingly rely on resources they do not control(e.g., Carr et al2013, Suweis et al2013).
Recent studies have stressed the environmental implications of food trade in terms of loss of environ-mental stewardship resulting from the tele-coupling between agricultural production and consumer beha-vior or market volatility(DeFries et al2010, Schmitz et al2012, Meyfroidt et al2013). Other studies hint at
the emergence of patterns of ecological unequal exchange, whereby an unbalanced distribution and flow of resources and environmental impacts perpe-tuates conditions of uneven economic development around the world (e.g., Rice 2007, Martinez-Alier 2014). In particular, the globalization of food
through trade has been associated with the exportation and externalization of environmental impacts (Gallo-way et al2007, O’Bannon et al2014), virtual water and
land trade (Hoekstra and Chapagain 2008, Fader et al2011), and the overall geographic disconnection
between consumers and the environment that supports them(Carr et al2013, MacDonald et al2015).
In contrast with the number of studies on the eco-nomic and environmental impacts of food trade, the joint effects of economic and environmental changes on the resilience of the global food system, i.e., its capacity to meet food demand in spite of supply shocks, remain poorly understood (D’Odorico et al2010, Prakash et al2011, Fader et al2013, Suweis et al2015). In conditions of food crisis, prices
dramati-cally increase, leaving the poor with no or limited access to food(e.g., De Schutter2014). Moreover,
dur-ing the recent food crises(e.g., in 2008 and 2011) the governments of exporting countries have responded to food price spikes by banning food exports, thereby leaving trade dependent countries in a state of insecur-ity(e.g., Fader et al2013, Puma et al2015). Export bans
increase the uncertainty and unreliability of the global food markets, thereby eroding food security in trade-dependent countries.
The impact of the intensification of trade on food security is difficult to evaluate, particularly the short term response of food systems to shocks in production and the way such a response propagates through the global trade network. These effects are hardly captured by state-of the art economic models accounting for changes in supply and pricefluctuations. In fact, such models typically assume (general or partial) equili-brium and market-clearing conditions(e.g., Hatfield et al2013, Gouel2013, Gouel and Jean2015) that are
unlikely attained in the course of a food crisis when hoarding and speculations occur while consumers scramble and suppliers make short-term arrangements (Piesse and Thirtle2009, Headey2011, Jones and Hil-ler2015). A shock to production induces a short-term
out-of-equilibrium condition in which shortfalls in food supply are addressed through either local adjust-ments or trade relationships. From a mass balance
point of view, this shock may be partly absorbed at the country level by tapping on reserves or reducing domestic consumption, and partly transmitted to other countries as affected regions decrease their exports or increase their imports. The outcome of these processes cannot be predicted through a linear stability/reactivity analysis(e.g., Suweis et al2015), as large perturbations
cause nonlinear responses(such as threshold effects) and the system may not recover to its original state.
In this study, we develop a model that simulates the propagation of a food supply shock through the processes described above(changes in reserves, trade and consumption) while preserving mass balance at the country level. We share this approach with other ‘cascading shock’ models applied to specific food commodities (Puma et al 2015, Gephart et al2016), virtual water (Tamea et al2016), industrial
sectors linked by input–output relationships (Con-treras and Fagiolo2014) and aggregate economic
pro-duction (Lee et al 2011). Our model differs from
previous work by its inclusion of food reserves, which empirical research has shown may play a major role in the resilience of food systems(Fraser et al2015).
We apply our model to a major food commodity group(cereals) using publicly-available data on pro-duction, trade and reserves over the last two decades. We make parsimonious assumptions about country-level response to shocks that are consistent with the historical record, and simulate the propagation of shocks under different versions of the trade network to assess:(1) how food reserves and trade patterns inter-act to increase or decrease exposure to supply shocks; (2) how systemic changes in the cereals trade network over the last 20 years affect the risk(frequency and severity) of national food shortages following supply shocks; and(3) which countries may bear a relatively greater risk due to their position in the trade network.
2. Methods
2.1. Simulation model
The model simulates the impact of a shock to the supply of some food commodity on the global trade network for that commodity. The shock is initiated as a drop in production in one country and propagates through the network over multiple iterations of the simulation loop(figure1).
At each iteration, countries affected by a shockfirst tap into their reserves. When reserves are depleted, countries absorb a fraction of the residual shock by reducing domestic consumption, then reduce their trade balance by decreasing exports and increasing imports, with the impact spread to each trade link pro-portionally to the volume on that link10. This 10
The exception to this rule, as illustrated infigure 1, is that countries cannot import more from a partner country that already reduced its trade balance following a shock, i.e.such trade links are ‘blocked’ from further increases.
propagates the shock from affected countries to their trade partners. Finally, any shock that could not be propagated is absorbed by reducing domestic con-sumption. These steps are repeated until all shocks have been absorbed(see the supplementary materials for a detailed description of the model and table1for a list of symbols and variables used in this paper).
As a portion of the shock is absorbed by domestic reserves and consumption at each iteration, the resi-dual shock monotonically decreases towards zero. To avoid arbitrarily small shocks being propagated, coun-tries will absorb (through consumption) any shock smaller than a fractionα of their current supply; we set α = 0.001% for all our simulations. With this adjust-ment, the model converges within 10 iterations for all parameter sets considered in this paper. At conv-ergence, we verify that the mass balance equation: DP + D - D = DI E R + DC is satisfied for
each country, and that the sum ofDRandDCover all countries matches the magnitude of the initial shock (both within a tolerance level of α).
The assumption that production shocks are absor-bedfirst by reserves is supported by the FAO com-modity balance data, showing that interannual changes in cereals production (DP) are most closely associated with changes in R. In contrast, all compo-nents of C, except animal feed, show little interannual
variation and little to no association withDP(see sup-plementary table 3). Both E and I are more variable than C over time, but these changes are mostly uncor-related with DP, as trade dynamics are affected by other factors than immediate changes in production. We further discuss these assumptions and alternatives at the end of the paper.
Figure 1. Simulation modelflow chart. See table1for a list of variables.
Table 1. List of variables and parameters of the shock propagation model.
Symbol Description
Nc Number of countries in network
P Production by country R Reserves by country
F Trade matrix( Fjk= exports from country j to
coun-try k)
E Exports by country i.e.å Fk jk
I Imports by country i.e.å Fk kj
C Domestic consumption by country(for any use) S Net supply,S=P + I-E
α Minimum threshold(as fraction of S) for a shock to be propagated
fc Fraction of residual shock absorbed by C if R is depleted
fr Fraction of actual reserves that are available to absorb
shocks
fp Magnitude of initial shock as a fraction of the affected
2.2. Data
We initialize our model with historical data on the international trade in cereals. As a major component of global food trade and food stocks, cereals provide a natural starting point to study how food security is impacted by the distribution of trade flows and reserves. By focusing our analysis on a commodity group rather than a single commodity, we avoid the need to consider substitution effects between func-tionally-similar crops in that group.
We use cereals production and trade data(detailed trade matrix exports) from the Food and Agricultural Organization of the United Nations’ online database (FAOSTAT,faostat3.fao.org, data acquired in January 2016). Production and trade quantities of individual primary and secondary commodities in the cereals group are converted into kcal equivalents(FAO2001)
and aggregated by country and year(see supplemen-tary table 2 for the list of included crops and conver-sion factors). We use population data from FAOSTAT to subset the network so that only countries with a population exceeding half a million people during the period 1986–2011 are considered. We rectify the data as described in Carr et al (2013) to account for the
merging and splitting of countries between years. We obtain data on countries’ cereals reserves from the Production, Supply and Distribution database of the United States Department of Agriculture’s Foreign Agricultural Service (USDA-PSD,apps.fas.usda.gov/ psdonline/, data acquired in October 2015). End-of-year reserves for nine commodities (barley, corn, millet, mixed grain, oats, rice, rye, sorghum and wheat) were converted in kcal equivalents and aggre-gated by country and year, and political entities were rectified to match the FAO data above. While the USDA-PSD data does not include some minor crops covered by FAOSTAT (including buckwheat, fonio and quinoa), those nine commodities account for over 90% of the total grain production reported by FAO-STAT over the 25 year period. Note that since USDA-PSD reports aggregated reserves for the European Union (pre-1998) and EU-25 (1998 and after), we divide these reserves between EU countries for each year in proportion to their share of the EU cereals production.
For model input, we average the cereals produc-tion, reserves and trade over threefive-year periods (1994–1998, 2001–2005 and 2007–2011), which we refer to by their median years(1996, 2003 and 2009). The set of countries was constant over each period(no merge/split event). The averaging process smooths out annual perturbations in the data and ensures that simulated shocks are applied to a typical state of the network rather than, e.g., one where some countries were already experiencing a shock.
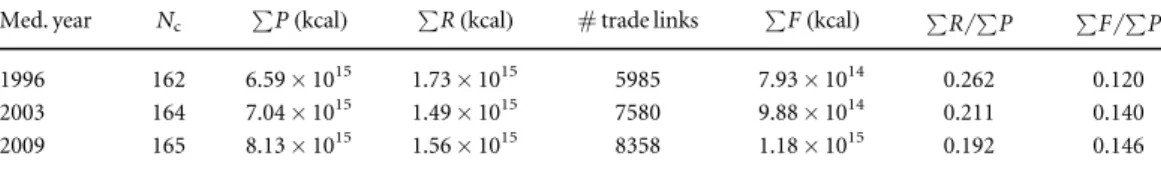
The evolution of the cereals trade across these three time periods shows a decrease of global reserves and an increase in global trade, both expressed as a fraction of total production(table2).
To separate the effects of changes in reserves and tradeflows on model outcomes, we perform two dif-ferent scalings of the 1996 and 2003 reserves:(1) in the R-scaled version, all countries’ reserves are scaled by a common factor so that the ratio of global R to global P matches that of 2009(e.g., from table2, the global R/P
ratio is 0.262 in 1996 and 0.192 in 2009, so the 1996 R-scaling would multiply each country’s reserves by 0.192/0.262); (2) in the R/S-scaled version, each country’s reserves are adjusted so that the ratio of R to the net supply S matches that of 2009 for that country (e.g., the R/S ratio for Australia in 2009 is 0.435, so its actual 1996 reserves would be replaced with 0.435 times its 1996 supply). Comparison between simula-tions based on the original data and results from these scaled versions allow us to identify the impact of(1) changes in global reserves or (2) changes in the distribution of these reserves among countries, respectively.
2.3. Simulation parameters and response variables In this study, we refer to a model run as a set of Nc
simulations, to observe the effect of a production shock initiated (separately) at each country in the dataset. For each run, we select one of the three time periods, a specific scaling of the reserves (see above) and three global parameters: the initial shock magni-tude as a fraction of the target country’s production ( fp), the fraction of reserves that are available to absorb
a shock( fr), as well as the fraction of a shock absorbed
by consumption after reserves are depleted ( fc, as
defined in our model above). In general, we expect <
fr 1 as the reported reserves include not only strategic stocks, but also temporary storage of goods along the supply chain.
For each model run, we report the number of simulations where the initial shock was transmitted (Ns), i.e.excluding those where the target country has
no production or has available reserves that exceed the loss of production. We calculate the following sum-mary metrics for each country: the number of hits, or simulations where the country receives a shock(Nh);
the number of hits where domestic consumption is affected(Nhc); the relative change in net supply (Dsrel) and consumption(Dcrel) over all simulations; and the evenness( J) of impact across simulations (see below).
To compare the average impact of a shock across countries and model runs, the total changes in supply (DSj) and consumption (DCj) for a given country j are
scaled by its initial supply (S0,j) and the simulation
parameter fp, i.e.ifDS( )jk is the impact on Sjof a shock
initiated at country k, then:
å
å
D = D D = D ( ) ( ) ( ) s S f S c C f S and , 1 j k jk j j k jk j rel, p 0, rel, p 0,where the sum is taken over all simulations(initiated at each country) in a given model run. These metrics are always negative, so we usually refer to their
magnitude, e.g.which countries receive a greater shock or impact.
The average of Dsrelfor all affected countries may be less or greater than−1, depending on the covar-iance between Dsreland the initial supply S0. Starting
from equation(1), we obtain (E denotes the expected
value):
å
D = [D ] [ ]+ (D ) ( ) ( ) ⎡ ⎣ ⎢ ⎤ ⎦ ⎥ E S E s E f S cov s ,f S , 2 k k rel p 0 rel p 0å
D = D - D [ ] [ ] [ ] ( ) ( ) ( ) ⎡⎣ ⎤⎦ E s E S f E S E S s S 1 cov , . 3 k k rel p 0 0 rel 0Since the mean supply equals the mean production, both the numerator and the denominator of thefirst term on the right-hand side are equal in magnitude to the mean initial shock over simulations, and thus:
D = - - D [ ] [ ] ( ) ( ) E s E S s S 1 1 cov , . 4 rel 0 rel 0
Based on Pielou’s measure of community evenness in ecology(Pielou1966), J measures the degree to which
the total impact on a country is spread out across multiple simulations. It is calculated as:
å
p p = - ( ) J N 1 log log , 5 j k kj kj cwherepkjis the proportion of the totalDSjthat is due
to a shock initiated at country k:
å
p = D D ( ) ( ) ( ) S S . 6 kj jk l j lNote that terms with p = 0kj are excluded from the
sum in equation (5). When the whole impact on
country j occurs in a single simulation, Jj=0;if it is
due equally to shocks originating from all countries, Jj= 1. Since a single shock is spread out across many
countries through trade, we expect this metric to increase with the number of links and trade volume in the network.
2.4. Model implementation
We performed the simulations and all data processing steps in R(R Core Team2015), using the FAOSTAT
package(Kao et al2015) to facilitate data acquisition
from the FAOSTAT database. The necessary code to reproduce all results in this paper is available on GitHub (http: //github.com/pmarchand1/cereals-network-shocks).
3. Results
3.1. Effects of global changes in the trade network To compare simulation results across different ver-sions of the trade network, wefix the global simulation parameters to fp= 0.2 (20% production decrease in
the country initiating the shock), fr = 0.5 (50% of
reserves available to buffer shocks) and fc= 0.01 (1%
of residual shock absorbed by consumption before it is passed through trade). Our sensitivity analysis (in the supplementary materials) shows that the number of countries to which a shock spreads depends primarily on the ratio of fpto fr, whereas the impact on domestic
consumption is most affected by fp (supplementary
table 1).
Our simulation results indicate that the most recent trade network(2009) has a greater capacity to absorb shocks compared with those of 1996 and 2003, as evidenced by a decrease in hits by country(Nh, Nhc)
and a lesser impact on consumption(Dcrel) (table3). However, this pattern is largely driven by the distribu-tion of reserves rather than increased trade. Despite the total reserves being greater in 1996 and 2003— which explains why the impact metrics are even higher when scaling these total reserves to 2009 levels—they are less evenly distributed, with a few countries(such as China) holding a very large proportion of their net supply in reserve and more countries having no repor-ted reserves. By scaling relative reserves by country to their 2009 values(R/S-scaling), we see that the num-ber of hits by country monotonically increases over time, with a small increase in the mean evenness of the impact across simulations, all factors consistent with an increase of the number and volume of trade connections.
While a more even distribution of reserves lessens the average impact on domestic consumption, it increases the average relative shock felt by countries (Dsrel). To understand this pattern, we note that the mean of Dsrel is greater than −1 for all our model runs, which, based on equation(3), means that
coun-tries with a larger S0receive a proportionally greater
impact from the shocks. This can be in turn related to the structure of the cereals trade network. A few large producers account for most of the net exports and receive more shocks due to their central position in the network(i.e. as each of their many trade partners will increase their imports when affected by a shock). These main producers/exporters also tend to have proportionately higher reserves, allowing them to
Table 2. Summary statistics of the cereals trade data for each time period considered in our analysis(Nc= number of
coun-tries in network, P= production, R = reserves, F = trade volume).
Med. year Nc åP(kcal) åR(kcal) # trade links åF(kcal) åR åP åF åP
1996 162 6.59× 10¹⁵ 1.73× 10¹⁵ 5985 7.93× 10¹⁴ 0.262 0.120 2003 164 7.04× 10¹⁵ 1.49× 10¹⁵ 7580 9.88× 10¹⁴ 0.211 0.140
absorb most of these shocks(see supplementary figure 2). The fact that the mean Dsrelapproaches−1 in 2009 shows that these discrepancies are becoming less important. Once again, a large portion of the change between 1996 and 2009 can be explained by the dis-tribution of reserves, with the residual differences (shown in the R/S-scaled version) reflecting the inten-sification of trade.
Although the previous tables do not indicate the standard deviations for the consumption impact metrics(Nhcand Dcrel), their distributions are highly skewed with most countries receiving little to no impact. As such, we focus on the most impacted coun-tries in the next section.
3.2. Country-level impacts
Figures2and3present the total impact on the supply and consumption (respectively) of each country for three different model runs: original 1996 data, 1996 data scaled with R/S ratios from 2009, and original 2009 data. Once again, results are aggregated over simulated shocks initiated at each country. As stated in the previous section, major exporters tend to absorb a disproportionate share of shocks relative to their base supply(figure2), due to their large reserves and high
number of trade links. However, these large reserves also ensure that the impact on domestic consumption is negligible(figure 3). The larger impact on DS for
Argentina, Australia and Paraguay in 2009(figure2)
reflects the growing relative importance of their exports. Some countries with low production and high trade can also exhibit a high aggregate DS, such as Oman, which increased both its reserves and trade volume between 1996 and 2009.
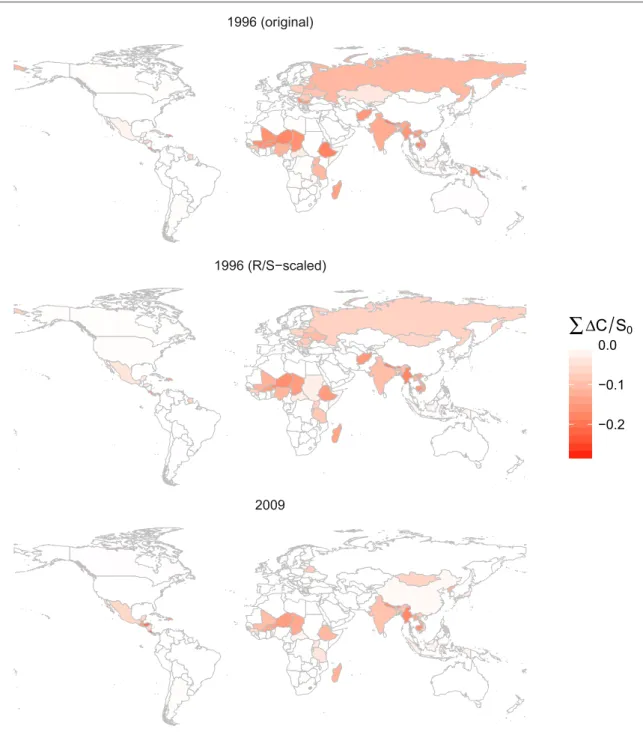
Countries where the simulated shocks produce substantial decreases in domestic consumption are concentrated in a few regions: Central America, the Sahel and East Africa, South and South-East Asia and (in 1996 only) the former Soviet Union (figure3). The
set of most affected countries is not sensitive to varia-tion of the global simulavaria-tion parameters fp, frand fc
(supplementary table 2). Compared with the original
1996 data, simulations using the R/S-scaled reserves led to smaller impacts to consumption overall. Chan-ges in the trade network itself greatly reduced theDC impact on many countries, including most of the for-mer Soviet Union, Afghanistan, Sudan and Tanzania, but led to larger impacts in others, notably in Central America.
We can gain additional insights on these results by separating the share of DC in a country due to the shock initiated at that same country(internal shock) and that which is due to shocks initiated at other coun-tries (external shocks). Figure 4(a) compares the
impact on the 40 countries that experience a>1% decrease in consumption due to an internal shock in at least one model run. Using either the original or R /S-scaled reserve levels, most countries lie above the 1:1 dividing line and are thus less impacted in the 2009 trade network. This is consistent with the additional trade links and volume, which result in a greater capa-city to transfer an internal shock to trade partners.
Conversely, a majority of the 24 countries receiv-ing a substantial(>1% of S0) external shock are more
impacted under the 2009 trade network(figure4(b)),
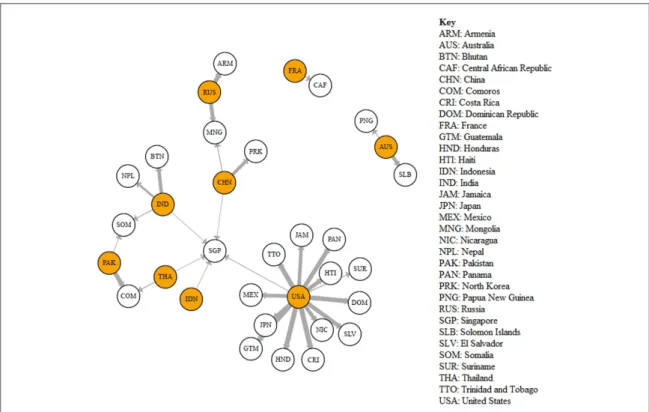
reflecting an increased reliance on food imports from one or a few trade partners. A look at the specific exter-nal shocks causing theseDCshow that they originate from nine source countries(figure5), with 14 of these
shocks—including the four greatest in magnitude— caused by an initial production drop in the United States. While the other target countries in the graph experience this risk from one or two simula-tions, theDCin Singapore is spread overfive sources; it also has the lowest aggregateDC, only slightly above the 1% threshold.
Contrasting with the overall trend towards a more globalized food trade network, our results show that the vulnerabilities to external shocks occur mostly at a regional scale, with American, South Asian/ Indian Ocean and East Asian clusters clearly visible infigure5
(the link from the United States to Japan being a nota-ble exception).
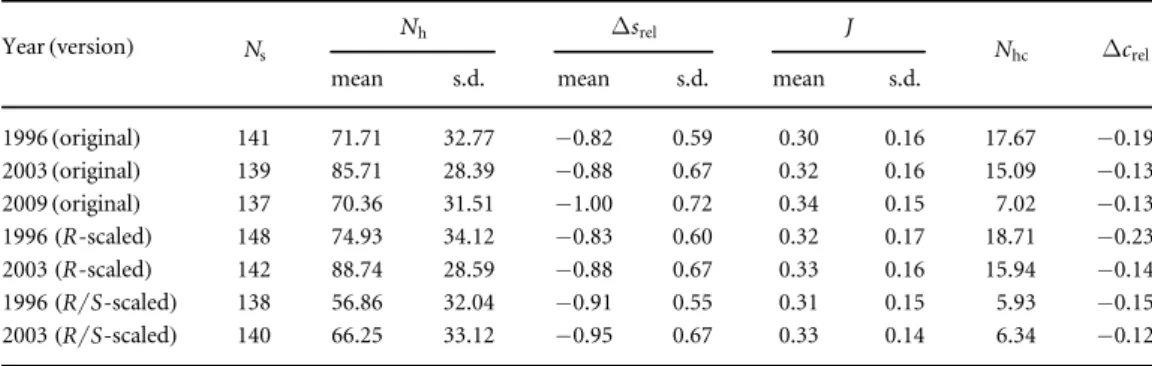
Table 3. Summary statistics by input data version with global parameters set atfp=0.2,fr=0.5andfc=0.01. Each row aggregates results from a set of simulations, each with a shock originating in a different country.Nsis the number of
simula-tions where a shock is passed;Nh(resp.,Nhc) is the number of times a countryʼs supply (resp., consumption) are affected
across simulations;Dsrel(resp.,Dcrel) is a relative measure of the total change in a countryʼs supply (resp., consumption)
across simulations;Jis the evenness of impact between simulations. Means and standard deviations are calculated across affected countries.
Year(version) Ns
Nh Dsrel J
Nhc Dcrel
mean s.d. mean s.d. mean s.d.
1996(original) 141 71.71 32.77 −0.82 0.59 0.30 0.16 17.67 −0.19 2003(original) 139 85.71 28.39 −0.88 0.67 0.32 0.16 15.09 −0.13 2009(original) 137 70.36 31.51 −1.00 0.72 0.34 0.15 7.02 −0.13 1996(R-scaled) 148 74.93 34.12 −0.83 0.60 0.32 0.17 18.71 −0.23 2003(R-scaled) 142 88.74 28.59 −0.88 0.67 0.33 0.16 15.94 −0.14 1996(R S-scaled) 138 56.86 32.04 −0.91 0.55 0.31 0.15 5.93 −0.15 2003(R S-scaled) 140 66.25 33.12 −0.95 0.67 0.33 0.14 6.34 −0.12
4. Discussion and conclusion
In this study, we presented a dynamic simulation model that complements previous approaches aimed at understanding the effect of increasingly globalized trade networks on the resilience of national food supply systems. Initialized with historical food pro-duction and trade data, the model describes how a local production shock is propagated as countries use their reserves and trade links to buffer the loss in food supply.
Based on data for a specific commodity group— cereals and cereal products—spanning a 17 year per-iod from 1994 to 2011, we identified two global trends
affecting the model’s dynamics: an increase in both the number and volume of trade links(relative to produc-tion), but also a decrease and a more even distribution of global reserves(still relative to production). This lat-ter point is particularly relevant to the ongoing discus-sion on the importance of food stocks (Fraser et al2015, Laio et al2016), as our results suggest that
the distribution of reserves matters more than their aggregate quantity in terms of conferring resilience to shocks. Trade and reserves also interact: as more countries have the reserves to absorb production los-ses or the capacity to import more from countries with such reserves, both trends contribute to reducing the number and severity of cases where a local drop in
Figure 2. Total change in net supply(åDS, summed over independent simulations of shocks initiated at each country) as a fraction of the affected country’s initial supply (S0), for three versions of the input data. The middle panel (R/S-scaled) uses the 1996
production and trade data, but scales the reserves to match the 2009 reserves/supply ratio. Global simulation parameters (see table1) are set at fp= 0.2, fr= 0.5 and fc= 0.01.
production forces a decrease in domestic consump-tion. However, a greater reliance on imports increases the risk of critical food supply losses following a for-eign shock, notably in the case of several Central American and Caribbean countries that import grains from the United States.
Since we simulated independent production shocks of the same relative size originating in each country, our aggregated results do not account for variation in the probability of produc-tion shocks across countries, or for the possibility of simultaneous shocks in multiple countries. The latter is of particular significance as, accord-ing to our analysis, the countries most at risk of
food shortages from external shocks tend to be concentrated in regional blocks. Further research on this topic could thus focus on developing more realistic shock scenarios where the impact is distributed across a region.
By focusing on the impact of global reserve dis-tribution and trade network structure, we necessarily ignore the particulars of each country’s domestic poli-cies and trade agreements that may affect the national response to food supply shocks. While our results indicate the relative vulnerabilities of countries along the dimensions considered in the model, this analysis alone cannot serve as an assessment of the actual level of food security in each country.
Figure 3. Total change in domestic consumption(åDC, summed over independent simulations of shocks initiated at each country) as a fraction of the affected country’s initial supply (S0), for three versions of the input data. The middle panel (R/S-scaled) uses the
1996 production and trade data, but scales the reserves to match the 2009 reserves/supply ratio. Global simulation parameters (see table1) are set at fp= 0.2, fr= 0.5 and fc= 0.01.
To avoid introducing too many adjustable para-meters, we chose a parsimonious model of the agents’ (in this case, national economies) behavior: all coun-tries are willing to spend the same proportion of their reserves, and any shock transmitted to trade partners is partitioned equally among all trade links. The latter assumption is shared with other models of‘contagion’ in economic networks (e.g., Lee et al 2011). A few
recent models of shock propagation in food commod-ity networks(Puma et al2015, Gephart et al2016) use
a GDP-weighted partitioning, based on the assump-tion that countries with a higher purchasing power will have a greater ability to sustain their imports from production-stressed countries. A key challenge in the development and parametrization of more complex model versions is the coarse, aggregate nature of avail-able production and trade data, which limits our abil-ity to follow the propagation of individual shocks in the empirical record.
We can contrast our simulation-based approach with previous studies aimed at evaluating the global food trade network’s resilience to supply shocks.
Using an aggregated virtual water trade network, Sar-tori and Schiavo(2015) analyzed the distribution of
historical supply shocks as well as changes in the net-work structure over time, to support the thesis that the global food supply became more stable as the reliance of trade increased. However, the data alone does not suffice to isolate the effect of increased trade from that of other trends present in the historical record, such as a change in the distribution of food reserves. Our model not only differentiates the effect of these two trends, it also highlights the uneven impact of these changes among the most vulnerable countries, show-ing how relative risks may shift from one region to another.
By shedding light on the complex interactions that determine the link between trade and food security, our model also suggests different paths through which national economies can reduce the risk of food shorta-ges, such as diversifying the sources of staple food sup-plies and ensuring that trading partners have the reserves to withstand a shock. We recognize however that these country-level metrics constitute only one
Figure 4. Decrease in consumption(DC) as a fraction of initial net supply (S0) from (a) internal shocks (i.e. shock was initiated at the
target country) and (b) external shocks (initiated at other countries), compared between the 1996 and 2009 trade networks. Two outcomes are given in 1996 based on whether the original reserves or those scaled to the 2009 reserves/supply ratio are used. Each plot includes all countries where the decrease exceeded 1% in at least one simulation. Global simulation parameters(see table1) are set at fp= 0.2, fr= 0.5 and fc= 0.01. Country labels correspond to their ISO alpha-3 codes.
dimension of food security, and that a more complete assessment requires consideration of within-country inequality in income, nutrition and access to food. Furthermore, while patterns of trade-dependency can be studied within the context of specific food com-modity networks, their origin is intrinsically linked to larger socio-environmental issues, including differ-ences in access to water or land, the intensity of their use (Fader et al 2016), and the geographical
distribution of pollution and other environmental externalities.
Acknowledgments
We thank Roberto Patricio Korzeniewicz and Chris-tina Prell for their participation in early discussions on this project. This work was supported by the National Socio-Environmental Synthesis Center (SESYNC) under funding received from the National Science Foundation (NSF) grant DBI-1052875. M Kummu received support from Academy of Finland SRC project Winland and Academy of Finland project SCART. M J Puma is supported by a fellowship from the Columbia University Center for Climate and Life and the Interdisciplinary Global Change Research under NASA cooperative agreement NNX08AJ75A. D A Seekell was supported by the Carl Trygger Founda-tion for Scientific Research. Z Ratajczak received support from NSF grant DBI-1402033. A Tavoni is supported by the Centre for Climate Change Econom-ics and Policy, funded by the ESRC, and the Grantham Foundation for the Protection of the Environment.
References
Carr J A, D’Odorico P, Laio F and Ridolfi L 2013 Recent history and geography of virtual water trade PLoS One8 e55825 Contreras M G A and Fagiolo G 2014 Propagation of economic
shocks in input–output networks: a cross-country analysis Phys. Rev. E90 062812
De Schutter O 2014 The transformative potential of the right to food Report of the Special Rapporteur on the Right to Food A/HRC/ 25/57 United Nations, General Assembly, Human Rights Council
DeFries R S, Rudel T, Uriarte M and Hansen M 2010 Deforestation driven by urban population growth and agricultural trade in the twenty-first century Nat. Geosci.3 178–81
D’Odorico P and Rulli M C 2013 The fourth food revolution Nat. Geosci.6 417–8
D’Odorico P, Carr J A, Laio F, Ridolfi L and Vandoni S 2014 Feeding humanity through global food trade Earth’s Future2 458–69
D’Odorico P, Laio F and Ridolfi L 2010 Does globalization of water reduce societal resilience to drought? Geophys. Res. Lett.37 L13403
Fader M, Gerten D, Krause M, Lucht W and Cramer W 2013 Spatial decoupling of agricultural production and consumption: quantifying dependences of countries on food imports due to domestic land and water constraints Environ. Res. Lett.8 014046
Fader M, Gerten D, Thammer M, Heinke J, Lotze-Campen H, Lucht W and Cramer W 2011 Internal and external green-blue agricultural water footprints of nations, and related water and land savings through trade Hydrol. Earth Syst. Sci. 15 1641–60
Fader M et al 2016 Past and present biophysical redundancy of countries as a buffer to changes in food supply Environ. Res. Lett.11 055008
FAO 2001 Food Balance Sheets: A Handbook(Rome: Food & Agriculture Organization of the United Nations)
Fraser E D, Legwegoh A and Krishna K 2015 Food stocks and grain reserves: Evaluating whether storing food creates resilient food systems J. Environ. Stud. Sci.5 445–58
Figure 5. Graph of countries having to reduce consumption for a shock initiated at source countries(orange nodes). The width of each edge is proportional tologDC S0. Simulations initialized with 2009 input data and global parameters(see table1) are set at fp= 0.2,
Galloway J N et al 2007 International trade in meat: the tip of the pork chop AMBIO: J. Hum. Environ.36 622–9
Gephart J A, BrännströmmÅ, Rovenskaya E, Dieckmann U and Pace M L 2016 Vulnerability to shocks in the global seafood trade network Environ. Res. Lett.11 035008
Godar J, Persson U M, Tizado E J and Meyfroidt P 2015 Towards more accurate and policy relevant footprint analyses: tracing fine-scale socio-environmental impacts of production to consumption Ecol. Econ.112 25–35
Gouel C 2013 Rules versus discretion in food storage policies Am. J. Agric. Econ.95 1029–44
Gouel C and Jean S 2015 Optimal food price stabilization in a small open developing country World Bank Econ. Rev.29 72–101 Hatfield J W, Kominers S D, Nichifor A, Ostrovsky M and
Westkamp A 2013 Stability and competitive equilibrium in trading networks J. Political Econ.121 966–1005 Headey D 2011 Rethinking the global food crisis: the role of trade
shocks Food Policy36 136–46
Hoekstra A Y and Chapagain A K 2008 Globalization of Water: Sharing the Planet’s Freshwater Resources (Malden, MA: Wiley Blackwell)
Jones A and Hiller B 2015 Resilience Taskforce Subreport Annex B: Review of the Reponses to Food Production Shocks UK Global Food Security Programme
Kao M C J, Gesmann M and Gheri F 2015 FAOSTAT: download data from the FAOSTAT database of the Food and Agricultural Organization(FAO) of the United Nations Laio F, Ridolfi L and D’Odorico P 2016 The past and future of food
stocks Environ. Res. Lett.11 035010
Lee K- M et al 2011 Impact of the topology of global macroeconomic network on the spreading of economic crises PloS One6 e18443 MacDonald G K, Brauman K A, Sun S, Carlson K M, Cassidy E S,
Gerber J S and West P C 2015 Rethinking agricultural trade relationships in an era of globalization BioScience65 275–89 Martinez-Alier J 2014 The environmentalism of the poor Geoforum
54 239–41
Meyfroidt P, Lambin E F, Erb K- H and Hertel T W 2013 Globalization of land use: distant drivers of land change and geographic displacement of land use Curr. Opin. Environ. Sustainability5 438–44
Oliveira G de L and Schneider M 2016 The politics offlexing soybeans: China, brazil and global agroindustrial restructuring. J. Peasant Stud.43 167–94 O’Bannon C, Carr J A, Seekell D A and D’Odorico P 2014
Globalization of agricultural pollution due to international trade Hydrol. Earth Syst. Sci.18 503–10
Pielou E C 1966 The measurement of diversity in different types of biological collections J. Theor. Biol.13 131–44
Piesse J and Thirtle C 2009 Three bubbles and a panic: an explanatory review of recent food commodity price events Food policy34 119–29
Porkka M, Kummu M, Siebert S and Varis O 2013 From food insufficiency towards trade dependency: A historical analysis of global food availability PLoS One8 e82714
Prakash A et al 2011 Safeguarding Food Security in Volatile Global Markets(Rome: Food & Agriculture Organization of the United Nations)
Puma M J, Bose S, Chon S Y and Cook B I 2015 Assessing the evolving fragility of the global food system Environ. Res. Lett. 10 024007
R Core Team 2015 R: A Language and Environment for Statistical Computing(Vienna, Austria: R Foundation for Statistical Computing) (http://R-project.org/)
Rice J 2007 Ecological unequal exchange: consumption, equity, and unsustainable structural relationships within the global economy Int. J. Comparative Sociol.48 43–72 Sartori M and Schiavo S 2015 Connected we stand: a network
perspective on trade and global food security Food Policy57 114–27
Schanbacher W D 2010 The Politics of Food: The Global Conflict Between Food Security and Food Sovereignty(Santa Barbara, CA: ABC-CLIO)
Schmitz C, Biewald A, Lotze-Campen H, Popp A, Dietrich J P, Bodirsky B, Krause M and Weindl I 2012 Trading more food: Implications for land use, greenhouse gas emissions, and the food system Glob. Environ. Change22 189–209
Shafaeddin S 2005 Trade liberalization and economic reform in developing countries: structural change or de-industrialization? Discussion paper#179 United Nations Conference on Trade and Development
Suweis S, Carr J A, Maritan A, Rinaldo A and D’Odorico P 2015 Resilience and reactivity of global food security Proc. Natl Acad. Sci.112 6902–7
Suweis S, Rinaldo A, Maritan A and D’Odorico P 2013
Water-controlled wealth of nations Proc. Natl Acad. Sci.110 4230–3
Tamea S, Laio F and Ridolfi L 2016 Global effects of local food-production crises: a virtual water perspective Sci. Rep.6 18803
Weinzettel J, Hertwich E G, Peters G P, Steen-Olsen K and Galli A 2013 Affluence drives the global displacement of land use Glob. Environ. Change23 433–8


![[PDF] Débuter avec le langage Prolog cours pdf | Formation informatique](data:image/gif;base64,R0lGODlhAQABAIAAAP///wAAACH5BAEAAAAALAAAAAABAAEAAAICRAEAOw==)