Plasticité comportementale de l’ours grizzli (
Ursus
arctos horribilis
) dans un contexte de changements
climatiques
Thèse
Karine Pigeon
Doctorat en biologie
Philosophiae Doctor (Ph.D.)
Québec, Canada
© Karine Pigeon, 2015
iii
RÉSUMÉ
L’étude de la plasticité comportementale s’attarde aux réponses physiologiques et comportementales des individus face aux contraintes de leur environnement. Les changements climatiques modifient les conditions du milieu et ont le potentiel d’influencer les composantes biodémographiques des individus. L’étude des liens mécanistiques entre le comportement animal et les conditions du milieu est donc utile à la compréhension des impacts potentiels des changements climatiques sur les individus. Le premier volet de ma thèse s’attarde aux liens entre les conditions du milieu, le comportement d’hibernation et la sélection de tanière de l’ours grizzli, une espèce menacée en Alberta. Ce volet révèle que l’abondance de nourriture à l’automne ainsi que le statut reproducteur des individus sont liés aux variations observées dans les dates d’entrée en tanière tandis que les conditions météorologiques à large échelle et le statut reproducteur des individus expliquent bien les dates de sorties de tanières. Ce volet démontre aussi que les caractéristiques physiques des tanières ne diffèrent pas entre les sexes et que pour creuser leurs tanières, les mâles et les femelles sélectionnent des attributs du paysage similaire. À large échelle, l’ours grizzli évite les zones humides et choisi des peuplements de conifères en haute altitude associés à une grande disponibilité de nourriture de haute qualité au printemps. À l’échelle du domaine vital et à l’échelle locale, l’ours grizzli choisi des peuplements de conifères associés à un fort couvert latéral et vertical, à une faible disponibilité de nourriture de haute qualité à l’automne, à une forte abondance d’Hedysarum spp. ainsi qu’à une faible densité de routes. Le second volet s’attarde à la sélection de l’habitat et à la thermorégulation durant la période active et mets en évidence les contraintes thermiques associées à une augmentation de la température ambiante sur les patrons de sélection de l’habitat. La sélection de l’habitat de l’ours grizzli selon les saisons et durant la journée dépendait de la température ambiante et ce, davantage pour les mâles que pour les femelles. Plus la température ambiante était élevée, plus la sélection de peuplements ouverts qui abondent en nourriture de haute qualité augmentait durant les périodes les plus fraîches de la journée et plus la sélection de ces mêmes peuplements diminuait durant les périodes les plus chaudes de la journée. Ma thèse approfondie les connaissances concernant les facteurs intrinsèques et extrinsèques influençant le comportement d’hibernation et met en évidence l’influence de la thermorégulation sur la sélection de l’habitat chez l’ours. Mes résultats contribuent à une meilleure compréhension des facteurs déterminant la distribution des individus et améliore notre capacité à prédire l’effet des changements climatiques globaux sur les grands mammifères.
v
ABSTRACT
The study of behavioural plasticity aims at understanding the physiological and behavioural responses of individuals to limiting factors. Climate change has the potential to influence the life history of individuals by altering environmental conditions. Thus, studying the mechanistic links between animal behaviour and environmental conditions is necessary to understand the potential impacts of climate change on individuals. The first part of my thesis focuses on the links between environmental conditions, hibernation behaviour, and habitat selection of grizzly bears, a threatened species in Alberta, Canada. The phenology of den entry and exit was driven by sex and reproductive status, food availability in autumn, winter precipitation, and spring temperature. There was no difference in the dimensions and characteristics of dens excavated by male and female grizzly bears, and males and females selected similar landscape attributes to dig their dens. At the broadest scale investigated, grizzly bears avoided wetlands and selected high-elevation dry conifer stands with abundant high-quality spring foods. At the home-range scale and within the den vicinity, grizzly bears selected dense conifer stands associated with little high-quality autumn food and abundant Hedysarum spp. in areas with low road densities. The second part of my thesis focuses on the links between habitat selection and thermoregulation during the active season, and highlights the thermal constraints associated with increasing ambient temperatures on habitat selection patterns. Grizzly bear habitat selection followed a daily and seasonal pattern that was influenced by ambient temperature, with adult males showing a stronger response than females to warm temperatures. With increasing ambient temperatures, male and female grizzly bears increased their selection for open stands with abundant food resources during the coolest periods of the day, and concurrently decreased their selection for these open stands during the warmest periods of the day. My thesis increases our understanding of the role of intrinsic and extrinsic factors on hibernation behaviour, habitat selection, and thermoregulation constraints of grizzly bears. Ultimately, my results enhance our understanding of the factors regulating the distribution of individuals in time and space; improving our ability to predict the potential impacts of climate change on large mammals.
vii
TABLE DES MATIÈRES
RÉSUMÉ... iii
ABSTRACT ... v
TABLE DE MATIÈRES ... vii
LISTE DES TABLEAUX ... xiii
LISTE DES FIGURES... xvii
LISTE DES ANNEXES ... xxi
REMERCIEMENTS ... xxix
AVANT-PROPOS ... xxxiii
CHAPITRE 1 ... 1
INTRODUCTION GÉNÉRALE... 1
Les changements climatiques ... 2
Répercussions sur les populations animales ... 3
La sélection de l’habitat ... 4
La résolution des données influence l’échelle d’analyse... 4
Un compromis ... 5
Le comportement d’hibernation ... 6
La sélection de sites d’hivernage ... 6
La période d’hibernation chez l’ours ... 7
La thermorégulation ... 7
Le maintien de la température corporelle ... 7
La thermoneutralité chez les ours ... 8
Le statut de l’ours grizzli ... 9
La plasticité comportementale de l’ours grizzli ... 9
Statut de l’ours grizzly en Alberta ... 10
Objectifs et structures de la thèse ... 10
Approches méthodologiques ... 11
Domaines vitaux ... 11
Approche statistique ... 12
Données météorologiques – Échelle régionale et échelle du domaine vital ... 13
Présence – absence et abondance de nourriture ... 14
viii
PARTIE 1 – LE COMPORTEMENT D’HIBERNATION ET LA SÉLECTION DE
TANIÈRE ... 19
CHAPITRE 2 ... 21
CLIMATE CHANGE AND HIBERNATION: LINKING FOOD AND WEATHER TO DENNING BEHAVIOUR OF GRIZZLY BEARS ... 21
Résumé... 22
Abstract ... 23
Introduction ... 24
Materials and methods ... 26
Study area ... 26
Den entry and exit dates ... 27
Reproductive status ... 27
Environmental covariates – Regional-scale weather ... 28
Local-scale weather (den-location) ... 28
Berry availability ... 29
Statistical analyses ... 30
Statistical analyses – Regional scale den entry and den exit dates ... 30
Statistical analyses – Effect size ... 32
Statistical analyses – Den entry and berry availability ... 32
Statistical analyses – Den exit and local-scale weather ... 33
Results ... 34
Regional-scale den entry models ... 34
Local-scale den entry models ... 35
Regional-scale den exit models ... 35
Local-scale den exit models ... 36
Discussion ... 36
Acknowledgments ... 40
CHAPITRE 3 ... 51
DEN SELECTION BY GRIZZLY BEARS ON A MANAGED LANDSCAPE ... 51
Résumé... 52
Abstract ... 53
ix
Materials and methods ... 57
Study area ... 57
Den site location data ... 58
Environmental factors ... 58
Sampling intensity ... 59
Sampling scales ... 60
Sex differences ... 60
Den site versus random locations within home ranges ... 61
Resource selection functions ... 62
Results ... 63
Sampling scales ... 63
Sex differences ... 63
Den site versus random locations within home ranges, bivariate model selection ... 64
Den site versus random locations within home ranges, multivariate model selection . 64 Discussion ... 65
Conclusion and management implications ... 68
Acknowledgments ... 68
CHAPITRE 4 ... 83
DETERMINANTS OF DEN SELECTION BY GRIZZLY BEARS IN A CHANGING LANDSCAPE: FINE SCALE SELECTION AND DEN CHARACTERISTICS ... 83
Résumé ... 84
Abstract ... 85
Introduction ... 86
Materials and methods ... 88
Study area ... 88
Den locations ... 89
Den characteristics ... 89
Environmental variables ... 90
Statistical analyses – Sex difference ... 91
Statistical analyses – Home-range and den vicinity ... 92
Results ... 93
x
Den selection ... 94
Home-range scale selection ... 94
Selection at the den vicinity ... 95
Discussion ... 95
Management implications... 98
Acknowledgments ... 99
PARTIE 2 : LA SÉLECTION DE L’HABITAT DURANT LA PÉRIODE ACTIVE ... 109
CHAPITRE 5 ... 111
STAYING COOL IN A CHANGING LANDSCAPE: THE INFLUENCE OF MAXIMUM DAILY AMBIENT TEMPERATURE ON GRIZZLY BEAR HABITAT SELECTION ... 111
Résumé... 112
Abstract ... 113
Introduction ... 114
Material and methods ... 117
Study area ... 117
Grizzly bear data ... 117
Temperature differences amongst landcovers ... 118
Temporal covariates ... 119
Defining availability ... 120
Habitat selection ... 120
Results ... 122
Temperature differences amongst landcovers ... 122
Habitat selection ... 123 Temperature-mediated effects ... 123 Discussion ... 125 Acknowledgments ... 130 CHAPITRE 6 ... 141 CONCLUSION GÉNÉRALE ... 141
Les facteurs intrinsèques et les conditions du milieu influencent le comportement d’hibernation: La durée de la période d’hibernation ... 143
Les facteurs intrinsèques et les conditions du milieu influencent le comportement d’hibernation: Les critères de sélection de tanière ... 146
xi
Limites de l’étude ... 149
Contributions et perspectives futures ... 149
BIBILOGRAPHIE... 153 ANNEXE 1 ... 171 ANNEXE 2 ... 175 ANNEXE 3 ... 177 ANNEXE 4 ... 181 ANNEXE 5 ... 185 ANNEXE 6 ... 199 ANNEXE 7 ... 203 ANNEXE 8 ... 209 ANNEXE 9 ... 213 ANNEXE 10 ... 227
xiii
LISTE DES TABLEAUX
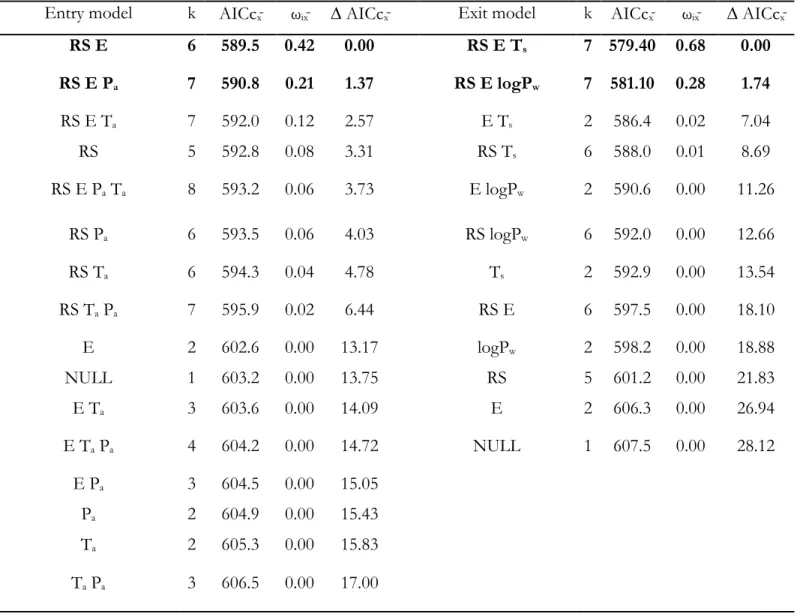
Table 2.1. Covariates used to assess variations in den entry and den exit dates for male and female grizzly bears (Ursus arctos) in the boreal forest and Rocky Mountains of Alberta, Canada between 1999 and 2010 ... 44 Table 2.2. Model selection for the influence of environmental variables at the regional scale and
individual variables on the timing of den entry and den exit for male and female grizzly bears in the boreal forest and Rocky Mountains of Alberta, Canada between 1999 and 2010. Number of parameters (k), average Aikake Information Criterion adjusted for small sample size (AICcx̄), average Akaike weight (ωix̄), average difference in AICc (∆ AICcx̄), Sex and
reproductive status at exit (RS), elevation (E), average maximum temperature in September (entry) or March (exit) in degree Celsius (Ta; Ts), total amount of precipitation in September
in mm (Pa); log of the total winter precipitation in mm (logPw), and individual bears as a
random factor ((Ind.)). Averages are based on the 40 datasets resulting from multiple
imputation. Best models are in bold ... 45 Table 2.3. Model-averaged parameter estimates for the 16 candidate models of the 40 multiple
imputation datasets used to assess the influence of environmental variables at the regional scale and individual variables on the timing of den entry (A) and parameter estimates for the 2 best models of the 40 datasets used to assess the influence of environmental variables at the regional scale and individual variables on the timing of den exit (B) for male and female grizzly bears in the boreal forest and Rocky Mountains of Alberta, Canada between 1999 and 2010. Parameter estimates (β), unconditional standard errors (SE), standard errors (SE), and confidence interval of estimates (Lower and Upper CI). Elevation (E), average
maximum temperature in September in degree Celsius (Ta), total precipitation in September
in mm (Pa), average maximum temperature in March in degree Celsius (Ts), log of the total
winter precipitation in mm (logPw), sex and reproductive status at exit (RS). Male was the
reference category for the RS categorical variable. Statistically significant parameters are in bold ... 46 Table 2.4. Akaike information criteria for small sample size (AICc), delta AICc (Δ AICc), AICc
weights (ωi), and number of parameters (k) for univariate and bivariate candidate models
investigating the influence of local scale variables on the timing of den entry and den exit by male and female grizzly bears in the boreal forest of Alberta, Canada between 2008 and 2010. Best models (≤ 2 AICc) are in bold. Estimate of the number of berries available in home-ranges of individuals (Berry, see Annexe 4 Tables A2.4 and A2.5), home-range size (HR), sex and reproductive status (RS1), average maximum temperature for the month of
March (TmaxL), average maximum solar radiation for the month of March (SmaxL),
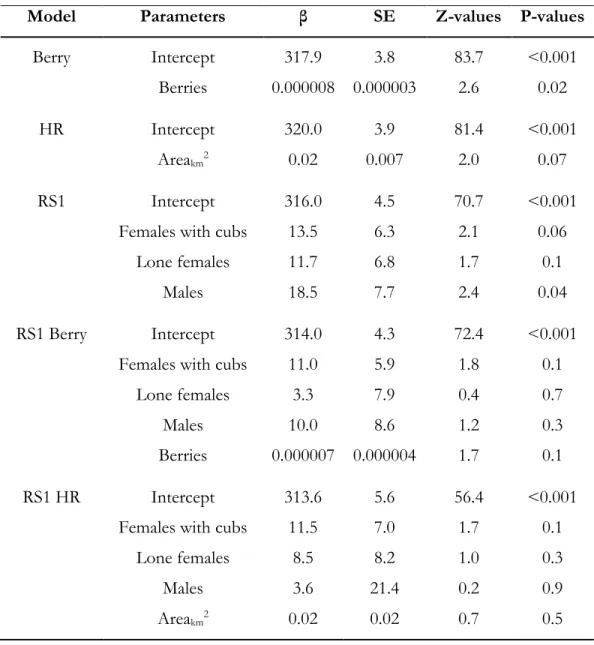
Principal components 1 and 2 of PCA analysis summarizing weather variables (See Annexe 3 Table A2.2). See table 2.1 for a full description of variables. ... 48 Table 2.5. Parameter estimates (β), standard errors (SE), Z-values, and P-values for the local-scale
candidate models explaining timing of den entry for male and female grizzly bears in the boreal forest and Rocky Mountains of Alberta, Canada between 2008 and 2010. Estimates of the number of berries available in home-ranges of individuals (Berry, Annexe 4 Tables A2.4 and A2.5), home-range size (HR), sex and reproductive status (RS1). Female with
xiv
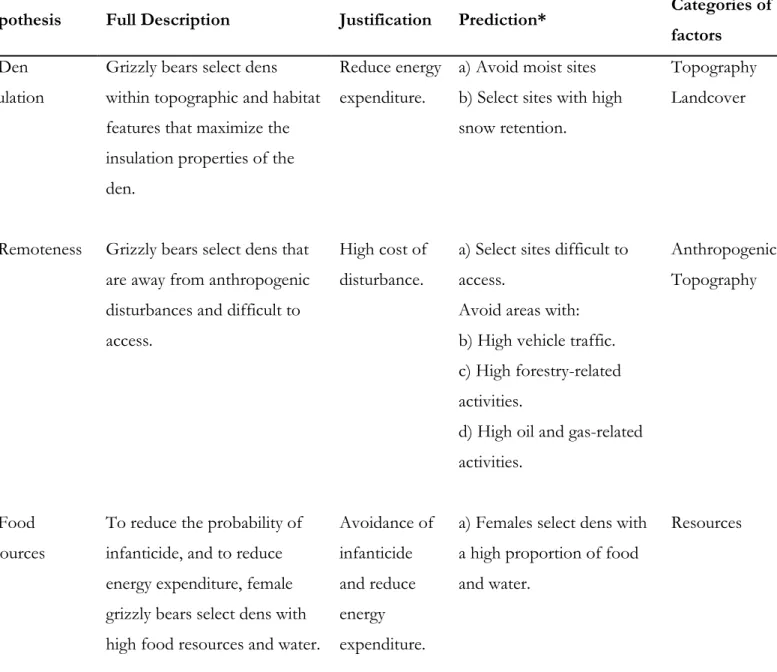
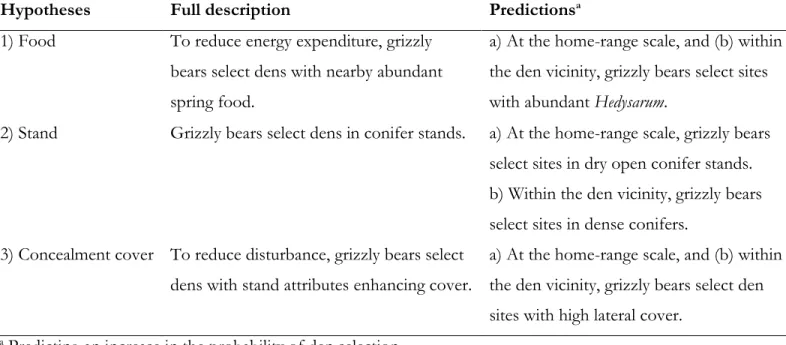
cubs-of-the-year was the reference category for the RS1. See Table 2.1 for a full description of variables ... 49 Table 3.1. Working hypotheses and predictions proposed to identify factors determining den
selection for male and female grizzly bears at multiple spatial scales in the boreal forest and Rocky Mountains of Alberta. For each hypothesis and prediction, we first investigated differences between male and female den selection using univariate logistic regression
(Annexe 5 Table A3.4) and performed a 1st-step model selection on a set of bivariate models
using conditional logistic regression (Table 3.3, and Annexe 5 Table A3.5). Based on the
results from the bivariate model selection, we performed a 2nd-step (and final) model
selection on a set of multivariate models using conditional logistic regression (Table 3.5, and Annexe 5 Table A3.6). Each model is associated with a hypothesis, prediction, and
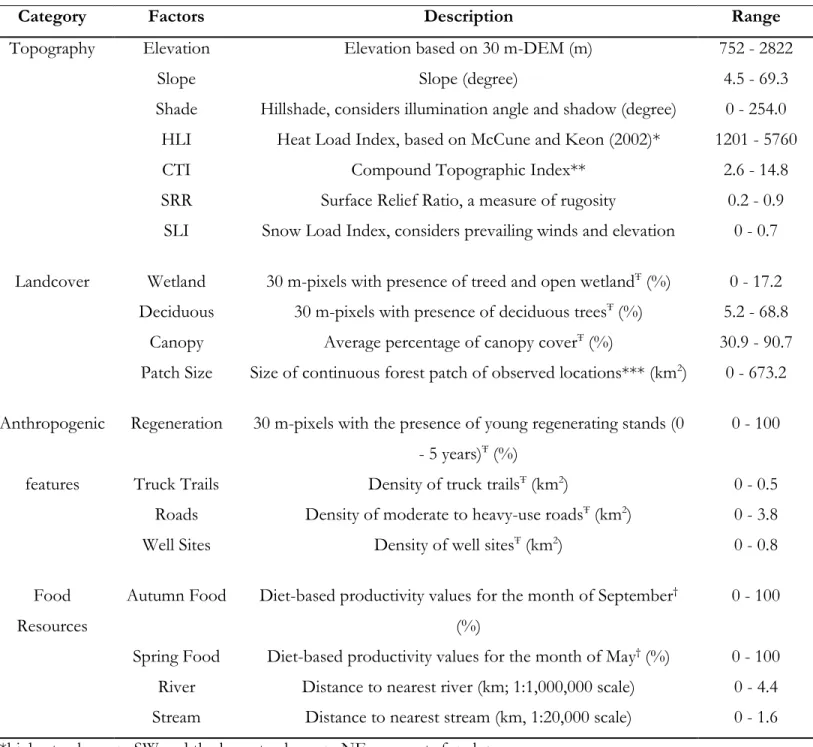
categories of factors ... 73 Table 3.2. Factors used to assess den selection of grizzly bears in the boreal forest and Rocky
Mountains of Alberta, Canada between 2000 and 2011 ... 75
Table 3.3. Quasi-likelihood under the independence model criterion (QICU), delta QICU (∆QICU),
QICU weights (ωί), and k (number of variables) for the most supported (≤10 ∆QICU)
bivariate candidate models per category of factors for the selection of dens by female and male grizzly bears in the boreal forest and Rocky Mountains of Alberta, Canada. Factor categories are (1) Topography, (2) Landcover, (3) Anthropogenic Features, and (4) Food Resources. See Table 3.1 for a full description of hypotheses and predictions, and Annexe 5
Table A3.5 for the complete set of candidate models. Best models (≤ 2 ∆QICU) are in Bold
... 76
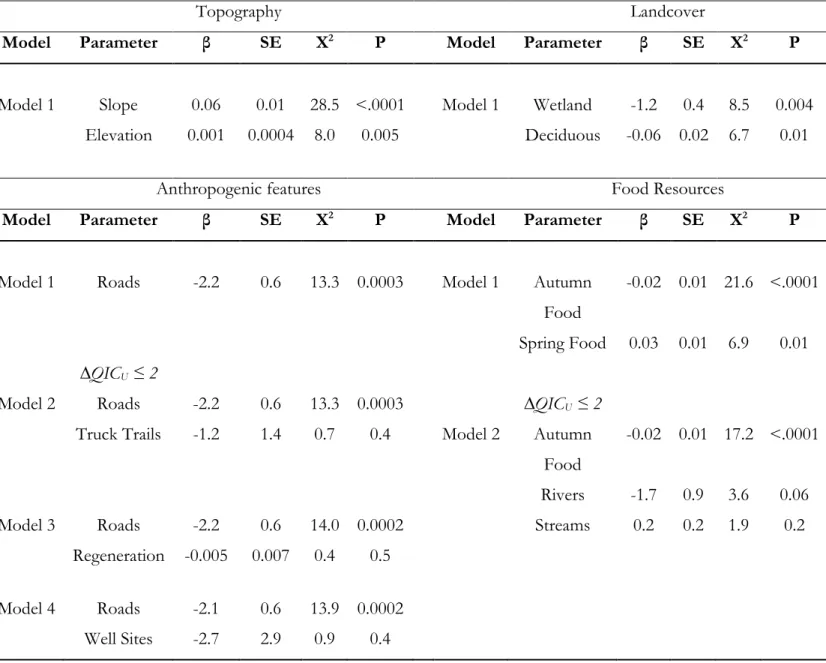
Table 3.4. Parameter estimates (β), standard errors (SE), Chi-square (X2), and P-values for the top
competing bivariate models (≤2 ∆QICU) in the 4 categories of factors for the selection of
dens by female and male grizzly bears in the boreal forest and Rocky Mountains of Alberta, Canada. We only included the variables from the best bivariate models in the multivariate model selection process (2nd-step) ... 77
Table 3.5. Quasi-likelihood under the independence model criterion (QICU), delta QICU (∆QICU),
QICU weights (ωί), and k (number of variables) for the multivariate candidate models
investigating the selection of dens by female and male grizzly bears in the boreal forest and Rocky Mountains of Alberta, Canada using conditional logistic regression. Best model (≤ to
2 ∆QICU) is in bold. Predictions are from hypotheses (1) Den Insulation, (2) Remoteness,
and (3) Resources. See Table 3.1 for a complete description of each hypothesis and prediction. Because of collinearity (variance inflation factor > 3) between Elevation and Spring Food, Elevation (highest variance inflation factor) was removed from models including Spring Food. Models selection using Elevation instead of Spring Food yields similar results (Annexe 5 Table A3.6) ... 78 Table 3.6. Proportions of available area (ai), proportion of dens (ui), selection ratio (w(x)), and risk
ratio (RR) per bin of relative probability of den selection from the best multivariate model for male and female grizzly bears in the boreal forest and Rocky Mountains of Alberta, Canada... 80
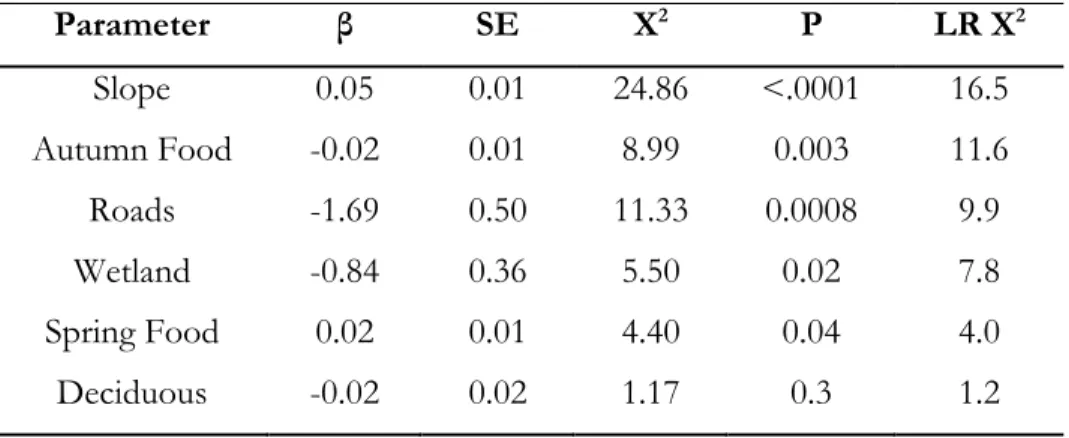
Table 3.7. Standardized parameter estimates (β), standard errors (SE), Chi-square (X2), and
xv
bears in the boreal forest and Rocky Mountains of Alberta, Canada. Parameters are ranked in order of effect size based on likelihood ratio tests (LR X2) ... 81
Table 4.1. Working hypotheses and predictions proposed to investigate the influence of food availability, concealment cover, and stand attributes on the selection of dens by male and female grizzly bears in the boreal forest and Rocky Mountains of Alberta, Canada between 2001 and 2012 at the home-range scale and within the den vicinity (< 0.15 km). For each hypothesis, we used field-based data collected within 20 m x 20 m sample plots and
performed model selection on a set of bivariate models using conditional logistic regression (Table 4.5 and Table 4.7). Each model is associated with a hypothesis and a prediction .... 102 Table 4.2. Category, description, and range of variables measured to assess the characteristics of
male and female grizzly bear dens in the boreal forest and Rocky Mountains of Alberta, Canada between 2001 and 2012 ... 103 Table 4.3. Field-based variables used to assess den selection for male and female grizzly bears in
the boreal forest and Rocky Mountains of Alberta Canada between 2001 and 2012 ... 105 Table 4.4. Average dimensions of dens (means ± SE) for male and female grizzly bears in the
boreal forest and Rocky Mountains of Alberta, Canada between 2001 and 2012.
Measurements are in meters except for den slope and den aspect (degrees). n = sample size. Not all dimensions were measured for all dens because some dens were at least partially collapsed. We compared dimensions between males and females using a 2 sample student’s t-test (t-test), t = t-statistic, df = degrees of freedom calculated from the
Welch-Satterthwaite equation for non-homogeneous variances, P = p-value ... 106
Table 4.5. Parameter estimates (β), standard errors (SE), odds ratio (OR), chi-square (X2), and
P-values for field-based models used to investigate den selection by male and female grizzly bears in the boreal forest (foothills) of Alberta, Canada at the home-range scale using field-based data collected within 20 m x 20 m sample plots. See Table 3 for a full description of variables included in models. Influential variables are in boldface type ... 107
Table 4.6. Parameter estimates (β), standard errors (SE), odds ratio (OR), chi-square (X2), and
P-values for the field-based models used to investigate den selection by male and female grizzly bears in the boreal forest and Rocky Mountains of Alberta, Canada within the den vicinity (< 0.15 km). Data collected at dens and at 4 adjacent sample plots within 20 m x 20 m sample plots. See Table 4.3 for a full description of variables included in models. The best models are in boldface type ... 108 Table 5.1. Covariates used to assess the influence of ambient temperatures on habitat selection
patterns for male and female grizzly bears in the boreal forest of Alberta, Canada between 2005 and 2011 using case-control logistic regression... 137
Table 5.2. Quasi-likelihood under the independence model criterion (QICU), delta QICU (∆QICU),
and QICU weights (ωί), for the most supported (≤10 ∆QICU) candidate models for the
selection of conifer stands, 0 – 20 year old cutblocks, 21 – 40 year old cutblocks, and
shrublands in relation to summer seasons (S), period of the day (P), daily maximum ambient temperature (T), and landcover (L) for male and female grizzly bears in the boreal forest and Rocky Mountains of Alberta, Canada using case-control logistic regression. Because of the intrinsic nature of case-control logistic regression, values for the summer season (S), period of the day (P), and temperature (T) covariates are necessarily identical for observed and random locations. Each of these covariates are therefore included as interactions with
xvi
the presence (1) or absence (0) of the landcover investigated in each model (SAS Institute Inc. 2011). To simplify the notation, the landcover*covariate interaction is denoted by the use of L*(covariates). As an example, the model L L*(P S P*S) includes landcover as a single term and the interactions landcover*period, landcover*season, and
landcover*period*season. Best models (≤2 ∆QICU) are in bold. Models with a ΔQICu >10
have essentially no empirical support and for clarity, we only present models with ΔQICu
xvii
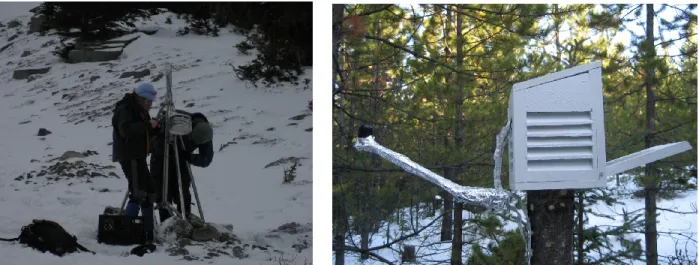
LISTE DES FIGURES
Figure 1.1. Exemples de stations météorologiques installées à moins de 700 m de tanières dans les Montagnes Rocheuses et la forêt boréale (piedmonts) de l’Alberta entre décembre et janvier 2007 à 2011 ... 16 Figure 1.2. Exemples de capteurs de température opérante installés à l’intérieur de peuplements de
conifères matures (A) et de coupes forestières en régénération de 0 à 20 ans (B et C), et de 21 à 40 ans (D) entre 2008 et 2010 dans la forêt boréale (piedmonts) des Montagnes
Rocheuses de l’Alberta ... 16 Figure 1.3. Exemples de placettes permanentes installées dans la forêt boréale (piedmonts) des
Montagnes Rocheuses de l’Alberta entre 2008 et 2010; (A) placette permanente pour l’espèce Vaccinium vitis-idea, (B) placette permanente pour l’espèce Vaccinium membranaceum, (C) placette permanente pour les espèces Vaccinium myrtilloides et Vaccinium vitis-idea ... 17 Figure 2.1. Ordinal date of den entry for 2 male and 11 female grizzly bears in the boreal forest
(foothills) of the Rocky Mountains, Alberta, Canada as a function of berry availability within their respective home-range between 2008 and 2010 from the most-supported (Food) model (Tables 2.4 and 2.5; Annexe 4 Tables A2.4 and A2.5). Open circles are observed data ... 42 Figure 2.2. Den exit day (Ordinal days) for male and female grizzly bears in the boreal forest and
Rocky Mountains of Alberta, Canada between 1999 and 2011 as a function of the average maximum daily temperature in March (°C), elevation (m), and log-winter precipitation (m)
from the most-supported (RS E Ts) and 2nd most-supported (RS E LogPw; Δ AICC: 1.74)
models (Tables 2.2 and 2.3). Each predictor variable is plotted within its observed range while other variables are held constant at their respective mean. Open diamonds are
observed data. RS: Reproductive status, E: Elevation, Ts: Average maximum daily
temperature in March (°C), LogPw: log-winter precipitation (m) ... 43
Figure A2.1. Schematic representation of analyses conducted at the regional and local scales. LMM: Linear mixed-model, LM: Linear model, ZINB: Zero-inflated negative binomial model, GLMM: generalized linear mixed-model, PCA: Principal component analysis. Variables are defined in Table 2.1. Dash-line arrows refer to the absence of an effect while solid arrows refer to the presence of an effect. ... 176
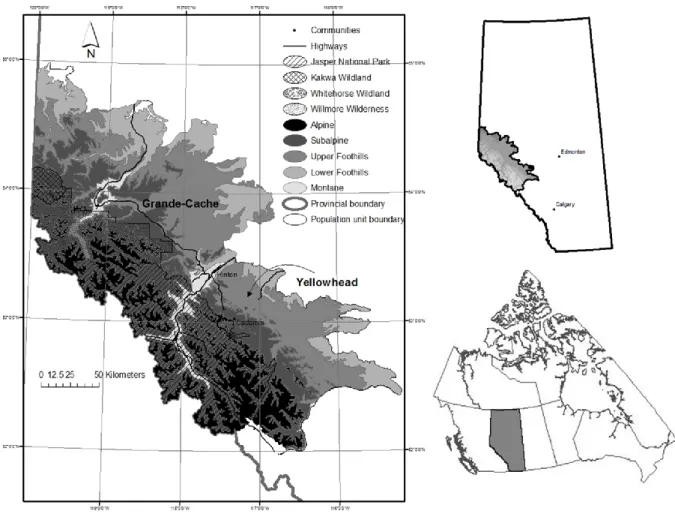
Figure3.1.Overview of the study area in Alberta, Canada showing elevation, the Grande-Cache
provincial grizzly bear population unit (North), the Yellowhead provincial grizzly bear population unit (South), and general location within Alberta. Jasper National Park is
delineated by the hatched area ... 70
Figure.3.2. Relative probability of den selection of the most supported multivariate model (Table
3.7) of den selection by grizzly bears in the boreal forest and Rocky Mountains of Alberta,
Canada between 2000 and 2011. A) Road Density (km2) at the 0.6 km scale, B) Slope
(degree), C) percent Wetland at the 9.6 km scale, D) percent Autumn Food at the 0.15 km scale, and E) percent Spring Food at the 9.6 km scale. Each predictor variable is plotted within its observed range while other variables are held constant at their respective mean.. 69 Figure. 3.3. Relative probability of den selection based on the most supported multivariate model
(Table 7 of den selection by female grizzly bears in the boreal forest and Rocky Mountains of Alberta, Canada between 2000 and 2011 ... 72
xviii
Figure 4.1. Overview of the study area in Alberta, Canada, showing natural subregions, the Grande-Cache provincial grizzly bear (Ursus arctos) population unit (north), the Yellowhead provincial grizzly bear population unit (south), Jasper National Park, Kakwa Wildland, Whitehorse Wildland, Willmore Wilderness, and general location within Alberta ... 100 Figure 4.2. Relative probability of den selection of the influential variables (Tables 4.5 and 4.6) at
the home-range and den vicinity scales by male and female grizzly bears (Ursus arctos) in the boreal forest and Rocky Mountains of Alberta, Canada between 2001 and 2012. A)
Standardized PC2, the 2nd-axis of the Principal Component Analysis used to describe
concealment cover (PCA; Annexe 6 and Annexe 6 Table A4.1 and Table A4.2) at the home-range scale, B) Standardized canopy cover (%) at the home-home-range scale, C) standardized
Hedysarum spp. cover (%) at the home-range scale, and D) Standardized canopy cover (%)
within the den vicinity ... 101 Figure 5.1. Overview of the Weyerhaeuser Grande Prairie Forest Management Agreement study
area in Alberta, Canada showing weather station and operative temperature sensor locations. Natural Subregions, communities, rivers and streams are shown for reference ... 130
Figure 5.2. Average weekly operative temperatures (Te) and 95 % confidence limits as a function
of the period of the day for the main landcovers selected by male and female grizzly bears in boreal forest of Alberta, Canada, during July and August 2008, 2009, 2010. Results and 95% confidence limits are from mixed model ANOVAs and letters indicate significant
differences amongst landcovers following a Stepdown Bonferroni multiple comparison procedure, α = 0.05 ... 131 Figure 5.3. Relative change (odds ratio) for the selection of conifer stands (upper graph) and
shrublands (lower graph) by male and female grizzly bears throughout the day and summer in the boreal forest of Alberta, Canada between 2005 and 2011. Odds ratios and 95% confidence limits were estimated from the best-selected candidate model using case-control
logistic regression. See Table 5.2 for the list of most supported models (≤10 Δ QICu). MT:
Morning twilight, M: Morning, MD: Midday, E: Evening, ET: Evening twilight, N: Nighttime. Season was not selected in the best model for males (Table 5.2). The best selected models for females included period of the day and season (Table 5.2) and odds ratios for each period of the day are shown for early summer, midsummer, and late summer. See Table 5.1 for a description of all covariates. Dash lines emphasize changes in the odds ratios ... 132 Figure 5.4. Relative change (odds ratio) for the selection of 0 – 20 year old (upper graph) and 21 –
40 year old (lower graph) cutblocks by male and female grizzly bears throughout the day and summer in the boreal forest of Alberta, Canada, between 2005 and 2011. Odds ratios and 95% confidence limits were estimated from the best-selected candidate model using
case-control logistic regression. See Table 2 for the list of most supported models (≤10 Δ QICu).
MT: Morning twilight, M: Morning, MD: Midday, E: Evening, ET: Evening twilight, N: Nighttime. The best selected models included period of the day and season (Table 5.2). Odds ratios for each period of the day are shown for early summer, midsummer, and late summer. See Table 5.1 for a description of all covariates. Dash lines emphasize changes in the odds ratios ... 133 Figure 5.5. Relative change (odds ratio) for the selection of 0 – 20 year old cutblocks during
morning twilight, morning, midday, evening, evening twilight, and nighttime as a function of daily maximum ambient temperature by male and female grizzly bears in the boreal forest of
xix
Alberta, Canada, between 2005 and 2011. Dotted lines are 95% confidence intervals and the dash-line indicates even odds. Odds ratios and 95% confidence limits were estimated from the best-selected candidate model using case-control logistic regression. See Table 5.2 for
the list of most supported (≤10 ΔQICu) models and Annexe 9 Table A5.5 for parameter
estimates and standard errors ... 135 Figure 5.6. Relative change (odds ratio) for the selection of 21 – 40 year old cutblocks as a
function of daily maximum ambient temperature by male and female grizzly bears in the boreal forest of Alberta, Canada, between 2005 and 2011. There was no interaction between period of the day and temperature for the best selected models (Table 5.2). For males, odds ratios varied with season (Table 5.2) and confidence intervals are represented in different shades of grey (1) early summer, (2) midsummer, and (3) late summer. Dotted lines are 95% confidence intervals and the dash-line indicates even odds. Odds ratios and 95% confidence limits were estimated from the best-selected candidate model using case-control logistic
regression. See Table 2 for the list of most supported (≤10 ΔQICu) models and Annexe 9
xxi
LISTE DES ANNEXES ANNEXE 1
Materials and methods describing the berry-productivity models and the berry presence-absence models generated to estimate the total number of berries within the autumn home-ranges of 13 male and female grizzly bears in the boreal forest of Alberta, Canada between 2008 and 2010 (Berry; Figure 2.3, Tables 2.4, and 2.5). See table 2.1 for a full description of variables ... 171 Table A2.1. Covariates used to estimate the production of berries and the presence – absence of
Vacc. membranaceum, Vacc. myrtilloides, Vacc. caespitosum, Vacc. vitis-idea, and Shepherdia canadensis
berry-producing shrubs in the boreal forest and Rocky Mountains of Alberta, Canada
between 2008 and 2010 ... 174
ANNEXE 2
Figure A2.1. Schematic representation of analyses conducted at the regional and local scales. LMM: Linear mixed-model, LM: Linear model, ZINB: Zero-inflated negative binomial model, GLMM: generalized linear mixed-model, PCA: Principal component analysis. Variables are defined in Table 2.1. Dash-line arrows refer to the absence of an effect while solid arrows refer to the presence of an effect. ... 176
ANNEXE 3
Table A2.2. Proportional and cumulative variance explained by each axis of the principal
component analysis performed on local-scale weather data obtained at 14 locations within 237 - 639 m of grizzly bear dens in the boreal forest and Rocky Mountains of Alberta, Canada. Covariates: Daily maximum, average, and minimum temperatures during the months of February and March, daily maximum and average solar radiation during the months of February and March, daily average relative humidity and dew point during the months of February and March. SD is standard deviation ... 178 Table A2.3. Proportional and cumulative variance explained by each axis of the principal
component analysis performed on local-scale weather data including all covariates described in Table A2.2 and the daily maximum and average wind speed in March. Data was obtained from weather stations installed at 14 locations within 237 - 639 m of grizzly bear dens in the boreal forest and Rocky Mountains of Alberta, Canada. SD is standard deviation ... 179
ANNEXE 4
Table A2.4. Parameter estimates (β), standard errors (SE), Z-values, and P-values for the best berry-productivity models for Vaccinium membranaceum (VAME), Vaccinium myrtilloides (VAMY), Vaccinium vitis-idea (VAVI) Vaccinium caespitosum (VACA), and Shepherdia canadensis (SHCA) in the boreal forest and Rocky Mountains of Alberta, Canada between 2008 and 2010. Percent cover of focal species (FSppCo), elevation (Elev), year (Year), regenerating
xxii
stand (Regen01), percent pine (PctPine), and Topographic position index (TPI). Annexe 1 for a full description of variables ... 182 Table A2.5. Parameter estimates (β), standard errors (SE), Z-values, and P-values for the best
berry presence-absence models for Vaccinium membranaceum (VAME), Vaccinium myrtilloides (VAMY), Vaccinium vitis-idea (VAVI), and Vaccinium caespitosum (VACA) in the boreal forest and Rocky Mountains of Alberta, Canada between 2008 and 2010. Elevation (Elev), percent pine (PctPine), and Compound topographic index (CTI). See Annexe 1 for a full description of variables ... 184 ANNEXE 5
Table A3.1. Parameter estimates for a subset of factors used to evaluate the sensitivity of
conditional logistic regressions (PROC PHREG, SAS Institute Inc., 2011) to compare dens of grizzly bears in the boreal forest and Rocky Mountains of Alberta, Canada using different numbers of random locations within home ranges of individuals. We evaluated the
sensitivity of coefficients to a sampling intensity ranging from 25 to 400 random locations per den using an exponential scale ... 186 Table A3.2. Scales of factors selected for male and female grizzly bear dens in the boreal forest
and Rocky Mountains of Alberta, Canada between 2000 and 2011. Deciduous, Canopy, Wetland, Regeneration, Autumn Food, and Spring Food are percentages of 30 x 30 m pixels with positive values within the respective scales. Truck Trails and Roads are densities (per
km2). Parameter estimates: β ± SE, Chi-square test: X2, and P-values are shown for each
factor. The scale was chosen based on best QICU value. See APPENDIX I Table A3 for all
scale-based model ranks ... 187
Table A3.3. Quasi-likelihood under the independence model criterion (QICU), delta QICU
(∆QICU), QICU weights (ωί), parameter estimates (β), Standard error (SE), Chi-square test
(X2), and P-values for scale-based candidate models proposed to identify factors
determining the selection of dens for grizzly bears in the boreal forest and Rocky Mountains of Alberta, Canada. Scales range from 0.15-km to 9.60-km using an exponential scale and were generated using a moving window analysis. We used a conditional logistic regression approach in SAS 9.3 (PROC PHREG with the STRATA and ID statements, and the COVSANDWICH (aggregate) and TYPE=breslow options, SAS Institute Inc. 2011) to compare each den with 100 random locations. Autumn Food, Canopy, Deciduous, Wetland, Regeneration (Regen), Roads, Spring Food, Truck Trails, Well Sites, and Wetlands are percentages of 30 m x 30 m pixels with positive values within the respective scales. Truck Trails and Roads are densities (per km2). Best models are in bold ... 188
Table A3.4. Estimated coefficients of univariate logistic regressions used to determine differences in the selection of den factors between male (0) and female (1) grizzly bears in the boreal forest and Rocky Mountains of Alberta, Canada between 2000 and 2011. Parameter estimates: β ± SE, Z-scores (Z) and P-values are shown for each factor. The probability of being a female (1) is modeled. See table 2 for a full description of factors and abbreviations ... 191
Table A3.5. Quasi-likelihood under the independence model criterion (QICU), delta QICU
(∆QICU), QICU weights (ωί), and k (number of variables) for the bivariate candidate models
xxiii
male grizzly bears in the boreal forest and Rocky Mountains of Alberta, Canada. Factor categories are (1) Topography, (2) Landcover, (3) Anthropogenic Features, and (4) Food Resources. Each model is associated with a hypothesis and prediction. Full hypotheses are
described in Table 1 and variables are described in Table 2. Best models (≤2 ∆QICU) are in
Bold ... 192
Table A3.6. Quasi-likelihood under the independence model criterion (QICU), delta QICU
(∆QICU), QICU weights (ωί), and k (number of variables) for the multivariate candidate
models assessing the selection of den sites by female and male grizzly bears in the boreal forest and Rocky Mountains of Alberta, Canada using conditional logistic regression. Best
model (≤ 2 ∆QICU) is in bold. Predictions are from hypotheses (1) Den Insulation, (2)
Remoteness, and (3) Resources. See Table 1 for a complete description of each hypothesis and prediction. Variables are described in Table 2. Because of collinearity (VIF > 3)
between Elevation and Spring Food variables, the Spring Food variable was removed from models including elevation ... 195 Table A3.7. Estimated coefficients for univariate logistic regressions used to determine differences in the selection of elevation for den sites between male (0) and female (1) grizzly bears in the boreal forest and Rocky Mountains of Alberta, Canada between 2000 and 2011. Parameter estimates: β ± SE, Z-scores (Z) and P-values are shown. The probability of being a female (1) is modeled ... 197 ANNEXE6
Details on the Principal Component Analysis summarizing concealment cover included in the conditional logistic regressions built to quantify variations in den selection at the home-range scale and at the den vicinity using field data from 42 dens, 168 adjacent plots, and 345 random locations in the boreal forest and Rocky Mountains of Alberta, Canada.. ... 199 Table A4.1. Proportional and cumulative variance explained by the first 2 axes of the principal
component analysis performed on field-data related to concealment cover within 20 m x 20 m sample plots at 42 dens, 168 adjacent plots, and 345 random locations in the boreal forest and Rocky Mountains of Alberta, Canada. ... 200 Table A4.2. Eigenvectors explained by the first 2 axes of the principal component analysis
performed on field-data related to concealment cover within 20 m x 20 m sample plots at 42 dens, 168 adjacent plots, and 345 random locations in the boreal forest and Rocky
Mountains of Alberta, Canada ... 201 Table A4.3. Estimated coefficients of univariate logistic regressions used to determine differences
in the selection of den variables between female (0) and male (1) grizzly bears in the boreal forest and Rocky Mountains of Alberta, Canada between 2001 and 2012. Parameter estimates: β ± standard error (SE), Z-scores (Z), and P-values are shown for each variable. The probability of being a male (1) is modeled. See Table 3 for a full description of variables and abbreviations ... 202
xxiv
ANNEXE 7
Table A5.1. Male and female grizzly bear observed GPS and paired random locations per season and period of the day from 2005 and 2011 in the boreal forest of Alberta, Canada. Use: Observed bear locations; Rand: Random locations; n: total number of locations ... 204 Table A5.2. Landcovers used by 11 male and 12 female grizzly bears between June 16 and
September 15 2005 to 2011 in the boreal forest of Alberta, Canada ... 206 Table A5.3. Average hourly movement rates and standard errors of male and female grizzly bears
in the boreal forest of Alberta, Canada, between June 16 and September 15 2005 to 2011. Movement rates were calculated using hourly locations for all movements and for the upper quartile per sex and reproductive status (lone females: Lone, cubs of the year: COY, cubs ≥ 1 year old: CUBS). Numbers in brackets refer to sample size ... 207 ANNEXE 8
Details on the operative temperature sensors installed within 0 – 20 year old cutblocks, 21 – 40 year old cutblocks, mature conifer stands, and shrublands in the boreal forest of the Rocky Mountains in Alberta, Canada between 2008 and 2010 ... 209 Figure A5.1. Average hourly temperatures recorded by operative temperature sensors (Te) and
station data loggers in a) 0 - 20 year old cutblocks and b) conifer stands. Symbols represent average hourly temperatures recorded between 1 July and 31 August 2008, 2009, and 2010 in the boreal forest of Alberta, Canada. Error bars represent 95% confidence intervals .... 211 Figure A5.2. Overview of the Weyerhaeuser Grande Prairie Forest Management Agreement study area in Alberta, Canada showing weather station and operative temperature sensor locations, and grizzly bear collar locations used to investigate the influence of ambient temperature on the selection patterns of conifer, shrublands, 0 – 20 year old cutblocks, and 21 – 40 year old cutblocks for male and female grizzly bears in the boreal forest of Alberta, Canada between 2005 and 2011. Natural Subregions, communities, rivers and streams are shown for reference. ... 212 ANNEXE 9
Table A5.4. Quasi-likelihood under the independence model criterion (QICU), delta QICU
(∆QICU), and QICU weights (ωί), for the most supported (≤10 ∆QICU) candidate models for
the selection of 0 – 20 year old cutblocks and 21 – 40 year old cutblocks in relation to summer seasons (Season), period of the day (Period), daily maximum ambient temperature (Temp), and landcover (Land) for female grizzly bears with no dependent offspring in the boreal forest and Rocky Mountains of Alberta, Canada using case-control logistic regression. To simplify the notation, the landcover*covariate interaction is denoted by the use of
Land*(covariates). Best models (≤2 ∆QICU) are in bold ... 215
Table A5.5. Odds ratio (OR), 95% lower confidence limit (95% LCL), and 95% upper confidence
limit (95% UCL) for the best selected models (ΔQICu ≤ 2) investigating the selection of
conifer stands, 0 – 20 year old cutblocks, 21 – 40 year old cutblocks, and shrublands in the boreal forest of Alberta, Canada, between 2005 and 2011 using case-control logistic
xxv
regression. Period of the day: Evening twilight (E twilight), Morning twilight (M twilight). Significant parameters and interactions are shown in bold ... 216
Table A5.6. Parameter estimates (β), standard errors (SE), Chi-square test (X2) and P-values for
the best selected models (ΔQICu ≤ 2) investigating the selection of conifer stands, 0 – 20
year old cutblocks, 21 – 40 year old cutblocks, and shrublands in the boreal forest of Alberta, Canada, between 2005 and 2011 using case-control logistic regression. In the Sex
column, numbers in ( ) indicate the rank of the model according to QICu when there was
more than one model with a ΔQICu ≤ 2. Landcover categories 0 – 20, 21 – 40, and Shr
respectively refer to 0 – 20 year old cutblocks, 21 – 40 year old cutblocks, and shrublands. Model parameters: Landcover (L), period of the day (P), summer season (S), and maximum daily ambient temperature (T). Covariate categories: Evening twilight (E twilight), Morning twilight (M twilight). Significant parameters and interactions are shown in bold ... 221 ANNEXE 10
Table A5.7. Spearman rank correlation (rs) and standard deviation (SD) of the candidate models
with the lowest QICu within each landcover and sex classes using a modified k-fold cross
validation method to assess model performance based on Fortin et al (2009). Candidate models describe the selection of conifer stands, 0 – 20 year old cutblocks, 21 – 40 year old cutblocks, and shrublands in relation to summer seasons, period of the day, daily maximum ambient temperature, and landcover for male and female grizzly bears in the boreal forest and Rocky Mountains of Alberta, Canada between 2005 and 2011 using paired logistic regression. Used locations (Use), random locations (Rand), Conifer stands (Conif), 0 – 20 year old cutblocks (0 – 20), 21 – 40 year old cutblocks ( 21 – 40), and shrublands (Shr) .... 228
xxvii
..."Like people, animal frequently disclose by their action, what they decline to divulge in words" Aldo Leopold (1887 – 1948)
« Dans connaître, il y a naître. » Victor Hugo (1802 – 1885)
À papa, pour ton courage, ta force et ta détermination. À maman, pour ton courage, ta tendresse et ton amour.
xxix
REMERCIEMENTS
Je tiens à remercier le Conseil de Recherches en Sciences Naturelles et en Génie du Canada (CRSNG), le Foothills Research Institute et leurs nombreux partenaires, Alberta Conservation Association Grants in Biodiversity (ACA) et Y2Y Sarah Baker Memorial Fund pour avoir fourni le soutien financier indispensable à ce projet. Le Centre d’études nordiques (CEN), Les Offices jeunesse internationaux du Québec (LOJIQ), International Association for Bear Research and Management Travel Grants (IBA), le Bureau international de l’Université Laval et l’Association des Étudiants Chercheurs (ACCEBUL) ont aussi soutenu mes travaux et financé ma participation à de nombreuses conférences.
En plus du support financier, la réussite de ce projet n’aurait pu être possible sans le support et l’aide de nombreuses personnes qui m’ont suivi tout au long de cette aventure. Je tiens d’abord à remercier Gordon Stenhouse, mon employeur et mentor au Foothills Research Institute depuis maintenant 11 ans. “Gord, thank you for the opportunity to work as part of the Foothills Research Institute Grizzly Bear Program team, thank you for your trust and constant support. The many years spent working under your supervision were a unique, challenging, and inspiring experience. I consider myself extremely privileged to be part of your team”. Je dois également remercier mon directeur, le Dr Steeve Côté, sans qui ce projet n’aurait pu voir le jour. Steeve,
merci d’avoir accepté de superviser ce projet, d’avoir cru en mes capacités et d’avoir été patient durant ces nombreuses années. Faire partie de ton labo fut une expérience enrichissante et j’en
garde de nombreux souvenirs. Je tiens aussi à remercier le Dr Scott Nielsen pour m’avoir accueillie
dans son laboratoire durant un stage de 3 mois. “Scott, I am grateful for your participation in this project. My time in your lab at the University of Alberta was highly motivating and enriching. I look forward to the opportunity for more learning, more discussions, and potential collaborations”.
Je tiens aussi à remercier mon comité d’encadrement. Merci au Dre Nathalie Barrette et au Dr
Jacques Larochelle. Un merci spécial à Jacques pour ta passion et ton intérêt constant en ce projet. Merci au comité d’évaluation, Dr Daniel Fortin, Dr Christian Dussault, Dr Steeve Côté et Dr David
xxx
Ce projet a nécessité plusieurs années de terrain et je remercie ceux et celles qui m’ont accompagnée durant les nombreuses journées passées à braver les pentes abruptes sous la pluie, la neige, le froid, les canicules et les millions de maringouins et de mouches: Rachel Théoret-Gosselin, Mary Smulders, Robin Strong, Erin Rodger, Valerie Evans, Etienne Cardinal, Benita Kaytor, Krystal Dixon, Terry Larsen, Bernie Goski, Karen Graham, Paul Stenhouse, Amy Stenhouse, Alexandre Auger, Cally Curle, and Alexandra Francis. Un merci spécial à Karen Graham et Julie Duval pour avoir été victimes de mes nombreuses questions reliées à la planification du travail de terrain et de bases de données, à Terry Larsen pour son dévouement inspirant et pour m’avoir transmis ses connaissances quant aux captures de grizzli, ainsi qu’à John Saunders et Steve Wotton de Peregrine Helicopters pour avoir été des pilotes exceptionnels durant les nombreux vols nécessaires pour accéder aux tanières.
Merci aux nombreux étudiants du laboratoire de Steeve Côté, les anciens (Ariane, Anouk, Vanessa, Marie-Andrée, Joëlle, Sandra, Marianne, Gaëlle, Rachel, Émilie, Julie, Yolande, Alex, François, Maël, William, Léon, Julien, Antoine, Glenn et Bert) avec qui j’aurais aimé passer plus de temps et les nouveaux que j’aurais aimé apprendre à connaitre davantage. Merci aussi aux étudiants de Scott Nielsen. Merci à Caroline Hins, Sonia de Bellefeuille et Émilie Champagne pour leur aide en tant que professionnelles de recherche. Un merci particulier à Rachel Théoret-Gosselin, Etienne Cardinal, Terry Larsen, Laura Finnegan, Karen Graham, Tracy Mckay et Doug MacNearny pour les discussions portant sur l’écologie et les statistiques de même que pour avoir lu et commenté certaines sections de cette thèse. Caroline Hins, Zoë Avner et Marie-eve Lenghan merci pour votre intérêt à commenter et réviser certaines des sections de cette thèse rédigées en français. “More specifically, I’d like to thank Laura Finnegan, Karen Graham, Tracy Mckay, and Terry Larsen for the many work-related discussions, for the numerous comments and feedback, for the work opportunities, and for sharing our unique and invaluable friendship at work and outside of work”.
Comme il est impossible de réussir un doctorat sans l’appui de ses proches, je tiens à remercier amis et famille qui ont su me supporter tout au long de ce trajet. Rachel Théoret-Gosselin, je ne pourrai jamais te remercier assez, merci pour ta complicité, ta bonne humeur et ton sourire. Merci d’avoir partagé tout ces moments de folie durant ces longues journées à compter des petits fruits et amasser des données pendant que les maringouins et les mouches noires nous envahissaient, et
xxxi
ensuite durant les nombreuses heures passées devant les ordinateurs au labo. Merci pour les fameux soupers et toutes les confidences. “Greg Adams, thank you for your support and encouragement. Thank you for your listening ear and invaluable advice, and thank you for your companionship during the many sanity breaks spent on outdoor adventures and not working on my PhD! The happiness that surrounds you and Tara Johnson is a constant inspiration. Tara, thank you for all the fun moments! I hope there will be many more”. Etienne Cardinal, merci de m’avoir supportée durant les moments les plus difficiles. Sans toi je n’aurai pu passer au travers et je t’en serai toujours reconnaissante. “Jennifer Moore, you have been a part of my life for over 15 years now. Thank you for reminding me what the real priorities are and thank you for helping me appreciate all the wonderful little moments of our lives”.
“Paul Kuchma, thank you for all the laughs and wonderful moments at the bottom of ice walls and at home, thank you for being so good at helping me forget the constant weight and stresses of writing a PhD thesis. Thank you for all the surprises and silliness”. Je tiens aussi à remercier ma merveilleuse famille de Edmonton-Hinton-Brûle pour les nombreux « potlucks » et les heures passées à grimper, faire du vélo, du ski ou autre activité en votre compagnie. Votre amitié a été indispensable à ma survie durant cette thèse! Zoë Avner, Ian Scriver et Sheelah Griffith, Anthony Zeberoff et Emily Moss, Claire Ellick, Alex Riedel, Veronica Sutherland, Devin Goodsman, Matt Chegus, Wallace Currie, Jacqueline Kingston, Victor Dombrowski, Mark Weaden, Scott Hiller, Jon Kirsch, François Laplante, Paul Kuchma, Jolene Albrecht, Aaron Jones, Jennifer Russel, Megan Jones, Terry Larsen, Rex and Fiona Hsieh, Karen Graham, Julie Duval, Laura Finnegan, Justin Davidson et Lena Greening. Un merci particulier à Jennifer Russel pour tes fous rires constants et ta motivation à la vie, et à Zoë Avner et François Laplante pour les jours de grimpes inspirants et les Camomille-party! Merci aussi à mes « bear-friends » du International Bear Association. Les nombreuses heures passées durant les conférences du IBA ont été plus que motivantes pour ma carrière. Özgün Emre Can, merci de m’avoir donné le dernier coup de pousse indispensable pour mettre à terme ce long et difficile projet qu’est une thèse de doctorat.
J’ai la chance d’avoir une famille exceptionnelle sans qui je n’aurais jamais accompli la moitié de ce que j’ai accompli jusqu’à maintenant. Maude Lebond, merci de m’avoir accompagnée de près et de loin durant toutes ces années. Ton support a toujours été d’une importance indescriptible. Jean Leblond et Esther Pigeon, merci pour votre support et merci pour avoir cru en moi durant ce long
xxxii
trajet. Benoit Pigeon, Robin Pigeon, Valérie Pisano, Corinne D’anjou, Alexis Pigeon, Cloé Pisano, Olivier Pigeon, Emma Pisano, Jade Pisano et Anabelle Pigeon : Merci de tout mon cœur pour avoir été à mes cotés, de près ou de loin, durant ce séjour et merci de me rappeler les aspects les plus importants de nos vies. En terminant, j’aimerais remercier Pierre Pigeon et Rita Labrecque, mes parents. Merci de m’avoir transmis votre goût de vivre, votre passion pour l’aventure, votre courage ainsi que votre motivation et dévouement à la vie. Vous ne cesser de m’épater et mon admiration pour vous a toujours été une source d’énergie indispensable à l’accomplissement de mes projets. Merci de m’avoir appris qu’avec assez de motivation et de détermination, nos rêves deviennent réalité.
xxxiii
AVANT-PROPOS
Ma thèse examine les liens entre les composantes de l’environnement et le comportement de l’ours grizzli. Plus précisément, j’examine comment les facteurs anthropiques, les conditions environnementales et les conditions météorologiques affectent la plasticité comportementale de l’ours grizzli en évaluant le comportement d’hibernation et de sélection de l’habitat de cette espèce. Ma thèse comprend six chapitres : quatre chapitres écrits en anglais sous forme d'articles scientifiques ainsi qu’un chapitre d’introduction et un chapitre de conclusion rédigés en français. Je suis l'auteure principale de tous les chapitres et ma contribution à chacun d’eux est majeure puisque je suis l’instigatrice principale de toutes les étapes nécessaires à leur réalisation. J’ai effectué la revue de littérature, la planification des questions de recherche, la planification du travail terrain nécessaire à l’acquisition des données, l'analyse et l'interprétation des données ainsi que la rédaction des articles.
Le premier chapitre de ma thèse est une introduction générale des aspects théoriques liés à mon projet de recherche. J'y fais une revue des connaissances liées aux changements climatiques ainsi qu’une revue de la littérature sur le comportement d’hibernation, le comportement de sélection de l’habitat et la thermorégulation des mammifères. J’aborde ensuite la plasticité comportementale de l’ours grizzli ainsi que son statut en Amérique de Nord. Pour terminer ce chapitre, je présente les objectifs de ma thèse, les populations à l'étude et les approches méthodologiques utilisées. Les chapitres 2 à 5 constituent le noyau de ma thèse. La première partie inclut les chapitres 2 à 4 et s'intéresse à l'influence de l’abondance de nourriture, des conditions météorologiques et des facteurs anthropiques sur le comportement d’hibernation de l’ours grizzli en considérant plusieurs échelles spatiales et temporelles. Le chapitre 2 a été rédigé en collaboration avec Gordon Stenhouse, chef de projet pour le programme de recherche sur l’ours grizzli au Foothills Research
Institute basé à Hinton en Alberta, et le Dr Steeve D. Côté, directeur de ma thèse et professeur au
département de biologie de l'Université Laval. Ces derniers ont commenté et révisé tous les chapitres de ma thèse. Ce chapitre intitulé « Climate change and hibernation: Linking food and weather to denning behaviour of grizzly bears » démontre qu’une combinaison de facteurs intrinsèques et extrinsèques expliquent les variations observées dans les dates d’entrée et de sortie de tanière de l’ours. L’abondance de nourriture à l’automne ainsi que le statut reproducteur des individus sont liés aux variations observées dans les dates d’entrée en tanière tandis que les conditions météorologiques à large échelle et le statut reproducteur des individus expliquent bien
xxxiv
les dates de sortie de tanières. Ce chapitre sera sous peu soumis à la revue scientifique Ecology. Le chapitre 3 intitulé « Den selection by grizzly bears on a managed landscape » a été rédigé en
collaboration avec le Dr Scott Nielsen, professeur à l’Université de l’Alberta, Gordon Stenhouse et
le Dr Steeve D. Côté. Pour ce chapitre, j’utilise des données de télédétection analysées à partir d’un
Système d’Information Géographique (SIG) pour mettre en évidence l’importance de considérer la sélection de tanière à plusieurs échelles spatiales. Par le fait même, j’identifie l’influence des facteurs anthropiques, de la disponibilité de nourriture et des facteurs associés aux types de peuplement sur le comportement de sélection de tanière de l’ours grizzli dans les piedmonts et les montagnes rocheuses de l’Alberta. Ce chapitre a été publié dans la revue scientifique Journal of
Mammalogy en 2014. Le 4e chapitre intitulé « Determinants of den selection for grizzly bears in a
changing landscape: Fine scale selection and den characteristics » se concentre davantage sur la sélection de tanière à très fine échelle ainsi que sur la sélection de tanière à l’échelle du domaine vital, cette fois-ci en utilisant des données amassées sur le terrain. Une meilleure compréhension du comportement de sélection de tanière à fine échelle est obtenue en considérant la sélection de tanière à l’aide de données terrain en plus des observations obtenues à l’aide de données de télédétection. Je prévois soumettre ce chapitre d’ici peu à la revue scientifique Journal of Wildlife
Management.
La deuxième partie de ma thèse (chapitre 5) explore les relations entre les contraintes associées à la thermorégulation et la sélection d’habitat de l’ours grizzli. Elle comporte un article rédigé en collaboration avec Etienne Cardinal, stagiaire de recherche au Foothills Research Institute au
moment de la rédaction de la première version de ce chapitre ainsi que Gordon Stenhouse et le Dr
Steeve Côté. Ce chapitre intitulé « Staying cool in a changing landscape: The influence of maximum daily ambient temperature on grizzly bear habitat selection » démontre l’importance de considérer les contraintes associées à la thermorégulation lors de l’étude de la sélection d’habitat. Dans le cadre de son stage, Etienne Cardinal a joué un rôle clé dans le traitement des données et des analyses ainsi que pour la rédaction de la première version de ce chapitre sous la forme d’un rapport remis au Foothills Research Institute. Ce chapitre est maintenant soumis à la revue scientifique Oecologia. En conclusion de ma thèse (chapitre 6), je résume les principales conclusions et contributions de ce projet de recherche, les limites de l’étude ainsi que les perspectives de recherche.
1
CHAPITRE 1
INTRODUCTION GÉNÉRALE
2
La plasticité comportementale englobe l’étude des réponses comportementales et physiologiques des organismes face aux contraintes de leur environnement (Willmer et al. 2000). Les individus doivent continuellement faire des compromis afin de minimiser les dépenses énergétiques pour répondre aux contraintes environnementales. Puisque l’accès aux ressources et l’énergie des individus sont limités, ils varient l’allocation de l’énergie envers les différentes composantes biodémographiques telles que la croissance, la thermorégulation et la reproduction afin de maximiser leur aptitude phénotypique (Williams 1966; Willmer et al. 2000; Danchin et al. 2005). Les individus d’une population se répartissent dans l’environnement (réponse comportementale) en fonction de plusieurs facteurs dont l’abondance de la nourriture, la disponibilité de sites de mise bas, la densité de compétiteurs et de prédateurs et les conditions climatiques locales (Fretwell et Lucas 1969; Lima et al. 1985; Hall et al. 1997). La présence d’infrastructures humaines telles que des routes ou des villes peuvent aussi restreindre ou modifier les mouvements ou la sélection de l’habitat d’un individu dans l’espace (Dussault et al. 2012; Meisingset et al. 2013). De plus, puisque les mammifères génèrent leur propre chaleur corporelle, ils répondent à leur environnement thermique en ajustant leur posture, leur sélection de l’habitat et leur taux d’activité afin de réduire les coûts énergétiques associés à la thermorégulation (Dussault et al. 2004; Long et al. 2005). Les mammifères répondent aux variations des conditions environnementales saisonnières (ex. quantité de neige) et journalières (ex. température ambiante) dans lesquelles ils se trouvent en modifiant
leur comportement (Huey 1991; Godvik et al. 2009; McLoughlin et al. 2010).
LES CHANGEMENTS CLIMATIQUES
Les études démontrant l’influence des gaz à effet de serre sur l’augmentation de la température moyenne globale sont maintenant nombreuses (ex. Ruddiman 2003; Kauffmann et al. 2009; IPCC-IPCC-GIEC 2013). Avant la fin du 21e siècle, on envisage une augmentation de la température
moyenne globale d'au moins 1,5°C, et pour les régions tempérées une augmentation plus prononcée de la température en hiver et au printemps (Bonsal et al. 2001; IPCC-GIEC 2013). Dans la forêt boréale du Canada, on prévoit une augmentation de la température entre 3,6 à 5°C
d'ici la fin du 21e siècle (Price et al. 2013). Pour les régions tempérées de l’hémisphère Nord, on
envisage aussi une diminution de l'étendue du couvert de neige au printemps (IPCC-GIEC 2013). Finalement, on prévoit une augmentation de la fréquence et de l’intensité d’événements extrêmes tels que les précipitations fortes et les canicules (Meehl et al. 2007; Hansen et al. 2012). Le
3
réchauffement de la forêt boréale affectera une gamme de fonctions associées à cet écosystème telles que la phénologie des plantes et leur biomasse ainsi que la distribution et la chronologie des précipitations annuelles (Price et al. 2013). De plus, malgré un niveau d’incertitude plus élevé relié aux prédictions portant sur les précipitations, la plupart des modèles de précipitations envisagent une réduction du degré d'humidité dans cet écosystème (Price et al. 2013; IPCC-GIEC 2013).
Répercussions sur les populations animales.— Les changements climatiques affectent déjà plusieurs
systèmes biologiques en modifiant les aires de répartition géographique des espèces, la structure de certaines communautés et la phénologie d’événements saisonniers tels que l’arrivée du printemps, la migration et la reproduction (Root et al. 2003; Parmesan 2006; Boutin et Lane 2014). En réponse aux changements climatiques, certaines modifications dans les budgets d’activité et les aires de répartition des animaux ont déjà été observées ainsi qu’une réduction de la condition corporelle, de la survie et du recrutement des individus (Walther et al. 2002; Post et Forchhammer 2008; Molnár et al. 2011). Entre autres, Visser et al. (2006) attribuent la diminution du succès reproducteur de la mésange charbonnière (Parus major) à un découplement entre les dates de ponte et le pic annuel de la biomasse de chenilles, la principale source de nourriture de ces mésanges au printemps.
Un important défi associé à l’étude des répercussions causées par les changements climatiques sur les populations animales est de générer des modèles prédictifs basés sur des données quantitatives. En effet, il est difficile d’obtenir la quantité et l’intervalle d’observations comportementales nécessaires pour générer des modèles prédictifs sur les grands mammifères en raison des défis associés à la collecte de données (Boutin et Lane 2014). De plus, les incertitudes associées aux modèles climatiques mondiaux engendrent des prévisions imprécises et ces modèles ne peuvent être utilisés au-delà de la gamme de conditions climatiques observées (Berteaux et al. 2006). Par conséquent, l’étude des liens entre les conditions environnementales et certains comportements animaux ayant des répercussions sur les facteurs démographiques tels que le succès de reproduction et la survie est une priorité pour comprendre l'impact des changements climatiques sur les populations à risque (Williams et al. 2008; Boyles et al. 2011; van Beest et Milner 2013; Garcia et al. 2014).
Pour les animaux, les répercussions causées par les changements climatiques sont plus prononcées durant certaines périodes critiques telles que le rut, la migration et l’hiver puisque les dépenses
4
énergétiques associées à ces périodes sont déjà plus élevées et qu’il est donc plus probable que certains individus d’une population atteignent ou dépassent leurs limites énergétiques (Visser et Both 2005). Évidement, certaines populations ou espèces peuvent résister, s’accommoder ou s’adapter plus facilement que d’autres aux changements survenant dans leur environnement (Visser et Both 2005; Williams et al. 2008; Garcia et al. 2014). Pour les populations ou espèces déjà menacées par des facteurs anthropiques tels que la surexploitation et la fragmentation de leur habitat, les changements climatiques ont le potentiel d’engendrer des coûts énergétiques additionnels et donc d’avoir un effet négatif sur l’aptitude phénotypique des individus (McCarty 2001; Walther et al. 2002; Huey et al. 2012; Mantyka-Pringle et al. 2012).
LA SÉLECTION DE L’HABITAT
L’habitat est défini comme un ensemble de ressources physiques et biologiques nécessaires à la survie, la croissance et la reproduction d’un individu (Hall et al. 1997). Le processus de sélection de l’habitat peut donc être défini comme l’utilisation disproportionnée d’un ensemble de ressources biotiques et abiotiques par rapport à leur disponibilité (Johnson 1980; Manly et al. 2002). Puisque les observations résultant de l’étude de la sélection de l’habitat dépendent de l’échelle d’investigation, différentes échelles spatiales et temporelles doivent être définies et prises en compte lors de l’étude des patrons de sélection d’habitat (Garshelis 2000; Boyce 2006; Ciarniello et al. 2007). De plus, la sélection de l’habitat à large échelle est généralement perçue comme un des facteurs limitant la sélection de l’habitat à fine échelle (Rettie et Messier 2000). L’identification des échelles auxquelles les individus d’une population perçoivent leur milieu est donc nécessaire à une juste identification des facteurs affectant les patrons de sélection (Hobbs 2003; Mayor et al. 2009).
La résolution des données influence l’échelle d’analyse.— Les résultats découlant des études de la sélection
de l’habitat sont couramment utilisés pour délimiter des zones prioritaires et générer des aires de conservation où les activités anthropiques sont limitées ou interdites et où les efforts de restauration sont concentrés (Garshelis 2000; Gibson et al. 2004; Johnson et al. 2004). Récemment, les avancées associées aux technologies de télédétection et au Système d’information Géographique (SIG), à la télémétrie et aux techniques de modélisation ont grandement amélioré notre capacité d’étude de la sélection de l’habitat puisque l’utilisation de données numériques facilite l’étude des préférences individuelles pour les animaux suivis (Boyce et al. 2003; Fieberg et