OATAO is an open access repository that collects the work of Toulouse
researchers and makes it freely available over the web where possible
Any correspondence concerning this service should be sent
to the repository administrator:
[email protected]
This is an author’s version published in: http://oatao.univ-toulouse.fr/ 26698
To cite this version:
Bacchin, Patrice
and Snisarenko, D. and Stamatialis, D. and Aimar,
Pierre
and Causserand, Christel
Combining fluorescence and
permeability measurements in a membrane microfluidic device to study
protein sorption mechanisms. (2020) Journal of Membrane Science, 614.
118485. ISSN 0376-7388
Official URL :
https://doi.org/10.1016/j.memsci.2020.118485
Combining fluorescence and permeability measurements in a membrane
microfluidic device to study protein sorption mechanisms
P. Bacchin
a,*
, D. Snisarenko
a, D. Stamatialis
b, P. Aimar
a, C. Causserand
aaLaboratoire de G�enie Chimique, Universit�e de Toulouse, CNRS, INPT, UPS, Toulouse, France
b(Bio)Artificial Organs, Department of Biomaterials Science and Technology, TechMed Centre, Faculty of Science and Technology, University of Twente, Drienerlolaan 5, 7500, AE Enschede, Netherlands
Membrane fouling by proteins is an important problem in hemodialysis or hemofiltration (artificial kidney). The mechanisms leading to fouling are still not fully understood and then predictable. In this paper we describe a microfluidic chip fitted with a filtration membrane which allows the real time in situ fluorescent analysis of labelled proteins and the measurement of the membrane permeability. The apparent kinetics rates of adsorption derived from the changes in fluorescence signal are combined with permeability measurements. This allows to discriminate two clearly distinct fouling mechanism by Bovine Serum Albumin (BSA) and α-lactalbumin (LALBA). The fouling kinetics of BSA is very rapid, independent of the flow conditions and can then be viewed as a protein monolayer adsorption controlled by protein-membrane interactions. In contrast, the fouling kinetics by LALBA is slower and very sensitive to flow conditions. We also describe a fluorescence quenching induced by protein aggregation and compression at high permeation rate. The fouling mechanism can then be viewed as a flow induced aggregation followed by a deposition of aggregates on the membrane. The complexity of sorption mechanisms on membrane during cross-flow filtration can be unraveled with this experimental set-up.
1. Introduction
Though membrane filtration now covers a wide range of application, hemodialysis [1,2] remains one of the most important in terms of market share. The success of blood dialysis relies on the capacity of an artificial kidney to achieve the transmission of uremic toxins while the total rejection of larger blood components, especially serum albumin (67 Da). Blood compatibility [3] of the material used is essential. The trans-mission of middle-sized uremic toxins sur as beta-2-microglobulin (B2M 11 kDa) remains an issue [4] since after several years, patients on hemodialysis begin to develop complications from B2M accumulation, that aggregate into amyloidal fibers deposited in joint spaces. This dis-ease known as “dialysis-related amyloidosis” can cause very serious joint-inflammation in the vertebral column and shoulders. The process must ensure a differential protein transmission between albumin which must be retained and uremic toxins which should be eluted. One of the major factors which hinder the transmission of middle sized uremic toxins is the fouling of the membrane by other larger blood components, especially proteins. Adsorption of proteins on the membrane material may lead to biocompatibility issues such as blood coagulation,
complement activation or blood cells adhesion [5]. In addition, the build-up of proteins on the membrane surface alters its selective prop-erties compared to those of a pristine membrane. The deposit creates an additional resistance to the transfer of toxins through the membrane, which leads to a decrease in the overall efficiency of the hemodialysis [6].
Membrane fouling by proteins is controlled by the hydrodynamics and the physico-chemical interactions between proteins (aggregation) or between protein and membrane [7] (adsorption), these interactions being controlled by pH [8], ionic strength and presence of divalent cations [9,10]. Such phenomena have been quite extensively studied over the years. As for an example, the description of the protein sorption kinetics using first [11,12] or second [13,14] order models is still under debate [15,16]. In membrane systems such a those used in hemodialysis, the membrane material heterogeneity and the presence of a cross-flow along the membrane and a flow through the membrane add a level of complexity.
Today our understanding of fouling phenomena based on macro-scopic observations remains rather limited. Adsorption and particle deposition have been extensively studied and commented in the * Corresponding author.
E-mail address: [email protected] (P. Bacchin). https://doi.org/10.1016/j.memsci.2020.118485
transparent materials and thin walls) and of membrane processes [19]. The originality of the device is to embark into a microfluidic device, a retentate and a permeate channels separated by a membrane able to filter solutions flowing through the channels. Only few designs taking advantage of the gas permeability of PDMS [20] or by in situ photo-patterning [21] have been reported to integrate a membrane in a microfluidic device for separation purposes, and none of them used commercial membranes, as proposed in this study.
2.2. Membrane and fluorescent protein solution
The membrane used in this study is a commercially available poly-ethersulfone (PES) membrane (product code: 14 650-47-D) of 50 kDa molecular weight cut-off (MWCO) and a thickness of 120 μm (Sartorius
AG, France). The permeability of the virgin membrane to PBS buffer was found to be 541 � 37 L m 2 h 1 bar 1 (SI 2). This ultrafiltration
membrane has been chosen because its material is the same as the one used in hemodialysis applications and its cut-off is well adapted for the removal of unbound small (urea and creatinine) and middle (leptin, endothelin, β2-microglobulin) uremic toxins that could be present in blood in the case of end stage renal disease [17].
Experiments are run using fluorescent proteins of two different sizes: bovine serum albumin (BSA - MW ¼ 66 kDa) well larger than the membrane nominal MWCO and α-lactalbumin LALBA a smaller albumin
(MW ¼ 14.2 kDa) that has the dimensions of a middle-sized uremic toxin. The protein concentrations in solutions are 1 g L 1 and 50 mg L 1
for BSA (the major protein in blood) and LALBA respectively. The latter concentration is clinically relevant as it is very close to the mean/me-dian uremic concentration of β2-microglobulin (MW ¼ 12 kDa) [22]. Protein solutions were prepared from concentrated 10x PBS bulk solu-tions purchased from Fisher BioReagents, France. Ultrapure water was supplied by an ELGA PURELAB Classic water purification system (final minimum resistivity of 18 MΩcm).
LALBA from bovine milk (Type III, calcium depleted), Atto 647 N Protein Labeling Kit and Bovine Serum Albumin–fluorescein isothiocy-anate conjugate (BSA-FITC) were purchased from Sigma-Aldrich, France. LALBA was labelled by adsorption of the zwitterionic fluo-rophore Atto 647 N according to the protocol suggested by the supplier (Sigma-Aldrich. Atto 647 N Protein Labeling Kit). The protein was first dissolved in a sodium bicarbonate buffer to obtain the concentration of 10 g L 1. Then, the reactive dye was dissolved in 20 μL DMSO (provided
in the labeling kit). The protein solution was then transferred to the vial containing the reactive dye. Finally, the reaction mixture was incubated for 2 h under gentle stirring. Gel filtration columns were then used in order to achieve good separation of the protein-dye-conjugates from excess free dye (size exclusion limit: 5 kDa). The dye-protein conjugate (first band) was collected, the free dye (second band) was trapped inside
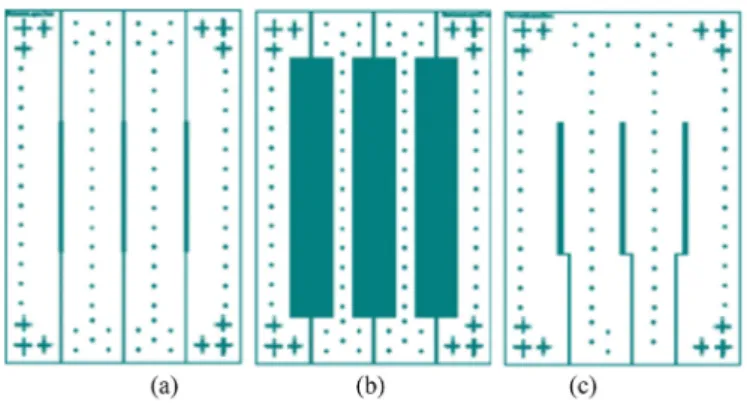
Fig. 1. 2D structure of the retentate (a) and the permeate (c) microchannel
systems along with membrane layer (b). The total size of the rectangle (between the center of the external cross used for the alignment) are 30*48 mm.
Fig. 2. Fabricated microchip with PES membrane inside (50 kDa, Sartorius).
The flow of dye allows to check the absence of leaks. literature, but the interplay between cross-flow or the flow through the
membrane (filtration) and these phenomena have received limited attention so far. The microfluidic device described in this paper, used in combination with a fluorescence microscope and more standard pres-sure and flow controllers, is a mean to provide “in situ” data on such interplays. The study reported in the next section is an illustration of the improved understanding of fundamental mechanisms which can be gained when using such devices.
2. Materials and methods 2.1. Membrane chips development
For the fabrication of the microfluidics device [17] the following materials were used: dry film photoresist (WBR2100, DuPont, USA), hydrophobic agent NovecTM (3 M, USA), NOA 68 (Norland Optical Adhesive 68, Norland Products, USA), Polydimethylsiloxane (PDMS, SylgardR 184 silicone elastomer, Dow Corning, USA), HSW Fine-Ject hypodermic needles (Sigma-Aldrich, France), K2CO3 with purity over
99% (Fisher Scientific, France). The connective Teflon tubings with in-ternal diameter of 250 μm were purchased from Cluzeau Info Labo,
France.
The design of the microchip was guided by the idea of constructing a device made of transparent material and composed of two micro-channels (retentate and permeate) with the membrane sandwiched in between, thus mimicking a real crossflow membrane filtration system. For this, three systems (Fig. 1) were designed using CleWin4, a software which enables high precision drawing (up to 1 μm). The membrane is
embedded in a cavity the depth of which is approximately equal to the membrane thickness (Fig. 1b).
The part of the retentate channel where the filtration through the membrane occurs is 630 μm wide (equal to the internal wetted
circumference of a hemodialysis fiber), 20 mm long and 300 μm high.
The hydraulic diameter of the filtrate channel is then 406 μm. The
section of the feed and collecting channels is 300 � 300 μm. The channel
collecting the permeate (Fig. 1c) is shifted in order to avoid permeation through the membrane in the feed channels. The effective membrane area for filtration is then around 12.6 mm2.
The various parts were printed on the transparent film using a high- resolution printer (TecPhotoGravure, France). We used a standard soft lithography procedure for the fabrication. The description of the different steps is given in the supplementary information section (SI 1). The resulting microchip has a multilayered structure, where a mem-brane is sandwiched between two shells and their channels printed in the UV-curable adhesive NOA 68. Fig. 2 shows an example of a micro-chip, with the PES membrane inside and the metal capillaries in place. The microfluidic device developed in this study combines then the advantages of microfluidics (with in situ monitoring thanks to
PRI ¼ 1 Jpost
J0 (1)
2.5. Analysis of the hydrodynamic conditions during cross flow via a peclet number
Experiments run at different cross-flow conditions are compared in term of their filtration P�eclet number. The filtration P�eclet number is defined as the ratio of the permeate flux, J, over the mass transfer co-efficient, k, and is tightly linked to the concentration polarization phe-nomenon (Equation (2)): Pe ¼J k¼ln � cm cp cb cp � (2) where cm, cb and cp are the concentrations at the membrane, in the bulk
and in the permeate respectively. The P�eclet number accounts for the opposite effects of the permeate flux, J, and of the tangential velocity. It is then an index of the potential mass accumulation (Cm, that has an
impact on the adsorption kinetics) at the membrane surface.
To calculate the P�eclet number it is necessary to estimate the mass transfer coefficient, k, or the boundary layer thickness, δ; (these two parameters are directly linked, k ¼ D
δ). The estimation of the mass
transfer coefficient in the channel along the membrane was performed using the classical Leveque’s equation for laminar condition. The main parameters describing the hydrodynamics and the mass transfer are given in Table 1 for BSA and LALBA, the diffusion coefficient are 6.1 � 10 11 m2 s 1 and 1.07 � 10 10 m2 s 1 respectively [27].
In the case of clinical hemodialysis, the range of standard Reynolds number, Re, in an individual fiber inside the module (artificial kidney) is estimated to be 0.5–2.1 depending on the number of fibers in the module (7000–14 000 fibers) and on the blood flow rate (200–400 mL min 1).
The Re conditions selected in the present study are then in and above the range found in clinical hemodialysis.
The selected TMP values (0–180 mbar) are in the range applied in hemodialysis/hemofiltration, i.e. from 0 to 270 mbar.
2.6. Protocol for the microscopy and the fluorescence – image analysis The fluorescence on the membrane surface (validation of the pro-cedure SI 2) in the retentate compartment of the microchip was also monitored. The light source for fluorescence is a metal halide lighting unit of 120 W (ZEISS HXP 120C). Images of the whole channel were acquired every 5 min with the filter set 38 (beam splitter at 495 nm) for BSA-FITC (excitation at 502 nm and emission at 518 nm) and with the filter set 50 (beam splitter at 660 nm) for the LALBA with Atto 647 N (absorption at 647 nm and emission at 667 nm). Since the length of each channel is larger than the image acquired by the camera, the camera was automatically moved along the channel to collect the set of images. The exposure time was chosen between 15 ms and 60 ms to have a significant signal and to avoid overexposure for the duration of the filtration.
The images were exported as.tiff files and analyzed using ImageJ [28]. The fluorescence signal was turned into gray values, so that the brighter fluorescence is reflected by the whiter pixels (higher gray value). In other words, zero corresponds to a pure dark body and 255 to a pure white body. The mean gray value is the sum of the gray values of all the pixels in the zone of interest divided by the number of pixels.
Table 1
Cross-flow velocity and transmembrane pressure, TMP, for the different exper-iments and the flow characteristics in terms of Reynolds, Re, and, P�eclet, Pe, numbers.
Cross-flow velocity (μL.min 1) TMP (mbar) Re Pe (BSA) Pe (LALBA)
35 90 1.3 – 4.43 75 90 2.7 – 3.45 180 11.56 7.20 130 45 4.7 – 1.58 90 4.19 2.88 250 180 9.0 6.75 –
the column. The obtained solution of conjugate was characterized by calculations of the dye to protein ratio (according a formula provided by the supplier Sigma) and of the final protein concentration. For this, the absorbance of the conjugates at 280 nm and 647 nm were measured using a cuvette of 1 cm in thickness, using a Libra S12 UV Spectropho-tometer (Biochrom, UK).
2.3. Experimental set-up for filtration and fluorescence monitoring Intrinsic fluorescence of protein has already been used to identify structural changes in proteins due to the permeation through mem-branes by comparing the intrinsic fluorescence of the proteins in the retentate and in the permeate [23] or due to mechanical stress in a UF loop [24]. Proteins labelled with different fluorophore have also been used to evaluate the fractionation of a protein mixture or to investigate the fouling by proteins after membrane autopsy [25]. Here, the main idea is to follow the live fluorescence on the membrane surface during the filtration in order to assess the dynamics of proteins sorption and accumulation.
Filtration experiments were monitored using two systems: a Zeiss Axio Observer.Zlm inverted microscope equipped with fluorescence (details in 2.6) and an automated microscope stage. The microscope, controlled by the Zeiss Axio Vision Software, makes it possible to scan the surface over time in order to have a live mapping of the membrane surface during filtration. This technique thus has advantages over other techniques such as FTIR [26] which can only be performed ex situ on dried membrane samples. The other equipment was the Fluigent MFCS-Flex pressure controller, combined with a FLOWELL flow-controller. There are a total of three pressure and three flow con-trollers. Two pressure controllers can supply a pressure of up to 1000 mbar, while the other one goes up to 350 mbar. As for the flow con-trollers, one can operate at a maximum flow of 8 μL min 1, the other one
at a maximum flow of 55 μL min 1 and the last one at a maximum flow
of 1100 μL min 1. The pressure-flow system is controlled via a
MAES-FLO software. The microfluidic chips are connected to the tubes of the pressure-flow controller and placed under the microscope right before the experiments are started.
2.4. Protocol for the filtration and the permeability measurement Before starting with the filtration process, the membrane was com-pacted until a stable flux was achieved (around 1 h). For this, pure PBS was flown through the microchip retentate channel at 130 μL min 1 in the absence of any pressure applied on the permeate side (corresponding then to a TMP of 90 mbar). The initial membrane permeability was then measured with pure PBS.
In a second step, protein solutions were filtered in a single pass mode: the retentate is not returned to the feed reservoir. The control over the cross-flow velocity and transmembrane pressure was achieved by adjustment of the pressures at the inlet, the retentate, and the permeate reservoirs. The inlet and permeate flow rates were measured every 10 s, whereas the retentate flow rate was calculated from the flow rates difference.
After the filtration procedure, pure PBS was again flown through the system for at least 15 min in order to evaluate the final permeability of the fouled membrane. For experiments at zero transmembrane pressure (TMP), the post-fouling flux, Jpost, was compared to the pre-fouling flux
(through a virgin membrane) J0. For this, a permeability reduction index
4
In order to evaluate the spatial distribution of fouling along the membrane, signal was monitored and analyzed at different places in the channel: the inlet, the middle, and the outlet (Figs. S2–1 in SI 2). The software measures the gray value on each pixel along the red line in
Figs. S2–1, yielding to a mean gray value.
For specific cases when dark zones appear on the membrane during filtration (Fig. 3 (A) - discussed in section 3.2.1), the protocol was modified. The analysis of the gray values at the inlet, the middle, and the outlet was performed not along the line, but over a rectangular zone. For each rectangular image a specific threshold gray value was defined to discriminate the bright background zones (gray value above the threshold) and the dark zones (gray value below the threshold). Once the threshold value is selected, the image is converted into a binary black and white system, where the black parts represent the zones below the threshold and the white ones those above the threshold. The per-centage of the black parts (later on called dark zones or Aggregation- Caused fluorescence Quenching ACQ) can be determined together with the mean gray value in the remaining zones.
3. Results
3.1. Fluorescence tracking during BSA filtration
Preliminary experiments were conducted in the absence of trans-membrane convection. The pressure in the retentate side was balanced by application of the same pressure on the permeate side in order to minimize the net permeate flow.
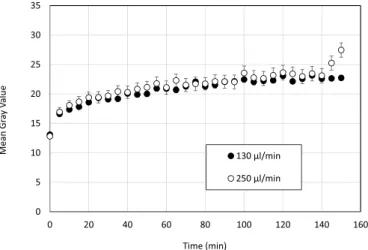
Fluorescent images were collected every 5 min, shown in Fig. 4 as gray values for feed flow rates of 130 μL min 1 and 250 μL min 1.
The change in fluorescence over time was quite similar for both feed flow rates. During the first 5 min, a sharp increase in fluorescence was observed, corresponding to the rapid formation of protein layers on the membrane surface. Moreover, no apparent difference was observed between the inlet, the middle and the outlet of the channel (results not shown). Such result suggests a uniform initial coverage of the membrane by the protein layer. It suggests that the cross-flow velocity in this range of conditions did not control the process. In other words, the process was not controlled by diffusion within the boundary layer but was reaction limited (heterogeneous reaction). Jones and O’Melia [12], showed in static adsorption experiments that the adsorption of BSA on a regener-ated cellulose ultrafiltration membrane is reaction-limited and not diffusion-limited. It seems that in our conditions, with a PES membrane and a very low cross flow velocity, a similar conclusion can be drawn.
Fig. 3. Image processing for the determination of the surface coverage by dark zones and evaluation of the fluorescent intensity of the background. (A – original
image, B – image converted into a binary system, C – result of subtraction of image B from A).
Fig. 4. Evolution of Mean Gray Value at middle position in the microchannel at
different cross flow velocities and TMP�0.
Fig. 5. The changes on fluorescent signal from the membrane surface (middle
position in the channel) during the filtration of BSA at different hydrodynamic and trans-membrane pressure conditions with the modeling (full lines; see section 4 about sorption kinetics modeling).
been evidenced with change in intrinsic fluorescence after permeation through membrane with different pore size [35].
On the other hand, BSA is considered as relatively rigid or “stiff” protein [36]. Based on this, we assumed that during filtration in our conditions, BSA did not undergo conformational changes whereas LALBA could form aggregates thus inducing ACQ.
3.2.2. Fluorescence and quenching under tangential flow (PTM ¼ 0) A first set of experiments with fluorescent LALBA was conducted in the absence of permeation through the membrane, i.e. in the absence of drag forces pulling the solute towards the membrane surface. The fluorescence was recorded at different positions along the membrane (results given in supplementary information S4). The fluorescence signal was rather homogeneous over the membrane for the lower flow rate 35
μL/min. When the flow rate was increased, noticeable difference in gray
values were observed along the membrane with a brighter fluorescence at the inlet of the channel. This could be due to the pressure drop across the channel that could induce a slight positive permeate flux at the channel entrance and a negative one at the outlet. To illustrate these results, Fig. 7 compares the evolution of the signal at the middle of the channel (where the permeate flux should be zero) for different flow conditions.
As can be concluded from Fig. 7, the flow rate of 130 μL min 1
resulted in the most intensive fouling (the most intense fluorescence), while at two other cross-flow velocities the fluorescence signals were rather similar. The final gray values at the inlet, the middle and the outlet of the microchannel obtained at 130 μL min 1 were almost twice
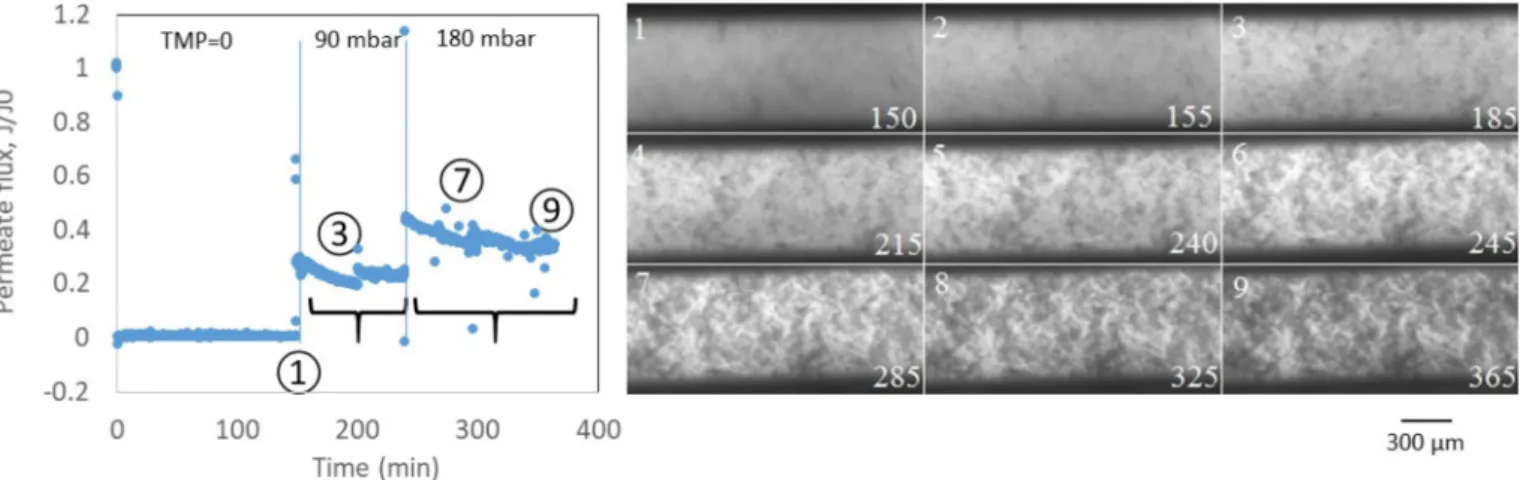
Fig. 6. Illustration of the appearance of fluorescence quenching zone induced by the filtration. The time is given in minutes in the images.
Fig. 7. Evolution of Mean Gray Value at middle position in the microchannel at
different cross flow velocities and TMP�0. After 5 min, the change in fluorescence levels off, reflecting a slower
protein deposition on the membrane surface.
Fig. 5 shows the change in fluorescence during filtration at various hydrodynamic conditions. On this figure, three regimes were observed in terms of fluorescence evolution. These regimes correspond to those observed on the flux versus time curves (Figure in supplementary in-formation SI 3). The initial drop in membrane permeability corresponds to the sharp initial increase in fluorescent signal. Then, during the sec-ond period, a slower flux decline echoed the increase in gray values followed by a pseudo-stabilization. Therefore, the comparison of changes of the fluorescence throughout the course of the filtration process to the variation in membrane permeability demonstrates a suf-ficient consistency, meaning that the fluorescence signal is a relevant parameter to monitor the development of fouling. No difference be-tween the inlet, the middle and the outlet regions of the channel was observed on the fluorescence vs time profile (results not shown). This suggests a uniform coverage of the membrane surface by the protein layer.
3.2. Fluorescence tracking during LALBA filtration
In preliminary experiments performed with BSA (section 3.1), we found that the surface fluorescence depended on the operating condi-tions but was homogeneous over the whole surface for given condicondi-tions. With LALBA, the results were quite different. A first sub-section presents the quenching phenomenon and its occurrence during filtration. 3.2.1. Fluorescence quenching induced by the filtration
During the LALBA adsorption experiments without permeation, the fluorescence was rather homogeneous over the whole membrane sur-face. However, when a transmembrane pressure was applied, we observed the formation of dark zones on the membrane surface. Fig. 6
shows that the dark zones became more and more frequent and large when the trans-membrane pressure was increased. Such zones were not observed with BSA (at any TMP). This observation may be explained by the so called aggregation-caused fluorescence quenching (ACQ) [29], which has been reported already [30,31] and is explained by a specific intermolecular interaction of the fluorescent moieties. Briefly, in tightly packed states, the fluorescent tags of neighboring molecules may have
π–π electron interactions, which in turn lead to the quenching of their
light emission [32,33]. Assuming that the formation of discussed dark zones is governed by ACQ, we further denote these structures as aggregates.
The structural properties of the proteins could be at the origin of the different behavior observed with BSA and LALBA. According to Greene et al. [34] LALBA can adopt alternative conformations and remain stable at partially denatured states. Modifications of LALBA structure have
The variation in surface coverage with time was more gradual at low P�eclet numbers. For a filtration P�eclet number of 3.45 (the trans-membrane pressure was two times lower than in the previously dis-cussed conditions) the ACQ zones started to appear after 2000 s of filtration only and the coverage at the end of the filtration ranged be-tween 20 and 60%.
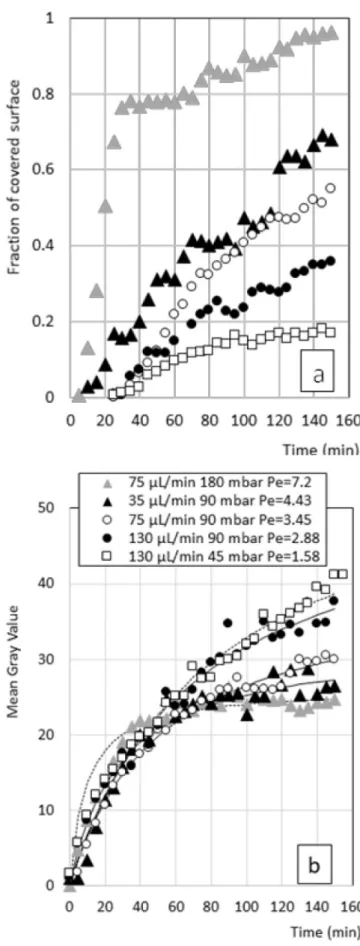
Fig. 8. a) Evolution of surface coverage by ACQ zones and of b)Mean Gray
Value of non-ACQ zone during the filtration of LALBA at different feed flow rate and transmembrane pressure with the modeling (full lines in b), see section 4). greater than at 75 μL min 1 and 35 μL min 1. For example, the gray
values at the inlet were 54.8 � 8.9, 27.6 � 2.5, and 23.4 � 4.8 respec-tively (results given in supplementary information S4). The tendency of greater protein accumulation at higher feed flow rate may be related to the sensitivity of LALBA to the hydrodynamic conditions. As previously reported, at greater velocity, i.e. higher shear stress, proteins have a higher propensity to unfold [37,38]. Such change in conformation leads to the enhanced interaction between hydrophobic parts of the proteins adsorbed on the membrane surface and the ones flowing in solution. As a result, the more protein unfolding the greater the fouling (Fig. 7). This effect was more noticeable at flow rate above 75 μL min 1: a threshold
flow seemed to exist between 75 and 130 μL min 1 corresponding to a
Reynolds number of 4.7 and a wall shear stress of 0.33 Pa.
The cross-flow velocity had an influence on the spatial distribution of fouling along the membrane. At larger flow rates one can clearly see the discrepancy between the gray values obtained at the inlet, the middle, and the outlet of the microchannel at every time point (Figures S4-1 and S4-2 in supplementary information S4). This observation is ascribed to the pressure drop along the membrane and the concept of internal filtration. The latter concept dictates that even if the overall trans-membrane flux is nearly equal to zero, due to the axial pressure drop along the retentate channel, the local pressure at the inlet of the channel is greater than the one at the outlet. Therefore, a local filtration flux occurs near the channel entrance and a reverse filtration (permeation from the permeate side back to the retentate compartment) can take place near the end of the channel. Eventually, such distribution of flow resulted in the gradual reduction of local gray value from the inlet to-wards the outlet, as observed in Figures S4-1 and S4-2. In parallel, no difference in gray values along the membrane was observed at a feed flow rate of 35 μL min 1 (Figs. S4–3). Such result suggests that below
certain cross-flow velocity, the pressure drop along the channel (0.12 mbar for 35 μL min 1 to 0.44 mbar for 130 μL min 1) became too small
to have a noticeable impact on the local transmembrane pressure con-ditions inside the microsystem. Another important finding on fluores-cent signal evolution is that at all three analyzed flow rates, the plateau was not reached even after 9000 s of experiment. This means that the buildup of LALBA continues for such long periods of time, unlike what was observed with BSA-FITC at no convection conditions, where a plateau was reached within the duration of the experiment (Fig. 4). This difference might be ascribed to the significant difference in protein concentration: 1 g L 1 in case of BSA-FITC and only 50 mg L 1 in case of
LALBA. Besides, the ability of LALBA to form aggregates with time (Fig. 6) could also explain the continuous accumulation of LALBA, re-flected by the increase in gray values throughout the entire duration of the experiments.
3.2.3. Fluorescence and quenching under cross-flow
The evolution of surface coverage with Aggregation-Caused fluo-rescence Quenching (ACQ) zones (section 2.7) obtained at different feed flow rates and transmembrane pressures is shown in Fig. 8 a). As further discussed in section 3.3.3, the percentage of quenched zone was quite well correlated to the filtration P�eclet number: the surface coverage by ACQ zone increases quicker and to higher values when the P�eclet number increases.
For a filtration P�eclet number of 7.2, 80% of the surface was covered by ACQ zones after 2000 s, i.e. more than the maximum coverage in any other experiment. From here on, the quenched zones expand but at a much slower rate and cover 90–95% of the surface after 8000 s. Fig. 9
shows a view of the membrane after 9000 s of filtration (end of the experiment).
7
As for the growth of the quenched zones, the mean gray value in the non-ACQ zones increased from zero to almost the maximal value within the first 2000 s at high P�eclet number (Fig. 8 b)). Beyond this time point, a plateau was observed until the end of the process. For lower P�eclet numbers, the signal increase was more gradual and did not reach a plateau by the end of the experiments.
3.3. Analysis of correlation between permeate flux, fluorescence and cross-flow conditions
This section presents the correlation that can been established be-tween the direct local analysis of fluorescence, the permeate flux mea-surement and the filtration conditions.
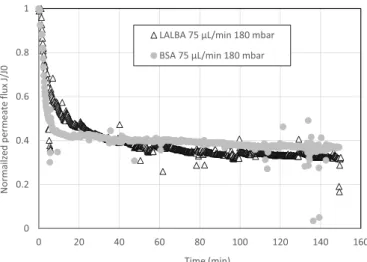
3.3.1. Comparison of the permeate flux reduction with time during the filtration of BSA and LALBA
The microfluidic rig allows to measure the evolution of the permeate flux of the membrane with time at constant transmembrane pressure. The flux evolution is plotted in Fig. 10 for BSA (1g.L 1) and LALBA (50
mg L 1) for the same hydrodynamic conditions of 75 μL min 1 - 180
mbar.
The flux reduction was faster for BSA and lead to a quasi steady state. For LALBA, the behavior was slightly different with an initial drop fol-lowed by a slow decrease. This difference could be due to the difference in protein size. Due to its larger size, BSA could lead to membrane pore blockage either by pre-existing protein aggregates [10,39] or by adsorption from the supersaturated solution close to the pore mouths [40]. This mechanism is able to change a lot the permeability in the first
instants of filtration, especially at the relatively high concentration used for BSA. The subsequent reduction in permeate flux is associated to the build-up of a protein deposit on the surface either by deposition of new protein layers or by formation of a “gel” layer. Concerning LALBA, its smaller size may allow some molecules to enter the pores and lead to an internal adsorption. This mechanism would assume a slower kinetics than superficial adsorption and take place on a higher surface area. Such mechanisms together with the gradual aggregation evidenced in Fig. 8
could explain a slower decrease in flux during the filtration of LALBA without stabilization within the experiment duration.
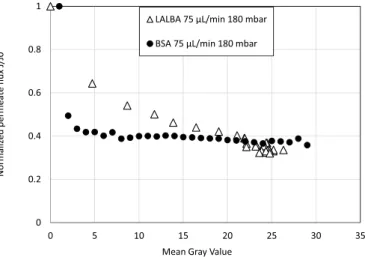
3.3.2. Correlation between fluorescence and permeate flux
It is interesting to compare the evolution of the fluorescence with the permeate flux decrease. For a given protein (LALBA in Fig. 11), the re-sults obtained under different operating conditions collapse on a single band. This shows that a given value of fluorescence corresponds to a permeate flux loss irrespective of the operating conditions. The fluo-rescence signal therefore seems to be a relevant index of the additional resistance induced by the protein build-up on and in the membrane.
The permeate flux loss is plotted versus the gray values for both proteins and for a same operating condition in Fig. 12. The behavior was slightly different for the two proteins. For BSA, after a sharp decrease in flux for low gray values, the increase in gray value during the experi-ment did not induce a noticeable change in permeate flux. For LALBA, the increase in gray value was responsible of a gradual and continuous decrease in permeate flux. These differences are discussed in section 4.3. 3.3.3. Correlation between the fluorescence and the p�eclet number
Fig. 13 shows the surface coverage (percentage) by quenched pro-teins (ACQ zones) and the gray values of the non-ACQ zone versus the filtration P�eclet number. In order to provide a fair comparison of the data, the values reported correspond to values recorded at the moment when the filtrate volume reached 0.5 mL. For BSA, the level of fluo-rescence was always the same whatever the operating conditions. It means that the fluorescence of adsorbed layers did not depend on the operating conditions (Pe ranging from 4.2 to 11.6). With LALBA, the Peclet number has a strong influence of the onset of the quenched zone. The percentage of the quenched zone varied from 0% when there was only a tangential flow (filtration P�eclet number ¼ 0) to 20% during filtration with low P�eclet number (Pe around 2) and up to 85% for the largest P�eclet number (Pe ¼ 7.2). In parallel, the gray value of the non- quenched zone decreased with the increase in P�eclet number until 4.4 and seemed to stabilize for higher values. This is probably due to the
Fig. 9. Fluorescent image of the membrane surface fouled by LALBA-Atto647
N at 75 μL min 1 and TMP ¼ 180 mbar. Magnification: x50.
Fig. 10. Comparison of the permeate flux reduction during the filtration of
LALBA (50 mg L 1) and BSA (1g.L 1) for the same hydrodynamic conditions of
75 μL min 1 and 180 mbar.
Fig. 11. Correlation between the permeate flux reduction and the Mean Gray
Value of non-ACQ zones during the filtration of LALBA for different oper-ating conditions.
onset of quenching in these regions that can induce a decrease in the mean gray value.
There was then a strong correlation between Pe and the aggregation- caused quenching zones for LALBA. The quenching of the labelled LALBA could then be a good indicator of the compression and/or ag-gregation of the protein induced by the filtration. The mechanisms can
be sketched as in Fig. 14.
This section analyzed the results obtained at a pseudo steady state of the filtration; the next section will now analyze the kinetics of adsorp-tion with a modeling approach.
4. Sorption kinetics analysis by modeling
The experiments described in the previous section shed light on the dynamics of the accumulation of the labelled protein during filtration. These dynamics can be the result of an adsorption process modified by concentration polarization induced by filtration. The increase in fluo-rescence at the membrane is controlled both by the advection-diffusion balance in the boundary layer and by the adsorption reaction at the membrane. However, these two mechanisms have two different char-acteristic times. The dynamics for the establishment of the polarization layer is very rapid (usually estimated at several seconds) compared to the duration of the experiments (several hours).
As a first approximation, one can then consider that polarization will change quickly the concentration at the surface and that the concen-tration at the surface affects the adsorption apparent kinetics rate. In this section, the methodology used to interpret the data will then be the following.
The fluorescence will be analyzed under the light of the adsorption kinetics and the parameter obtained from fitting the experimental gray values to kinetic models will be correlated to the filtration operating parameters.
First the order for the adsorption kinetics will be determined (section
4.1), then the kinetics constant will be calculated and correlated to the operating parameters (section 4.2). In a last section (section 4.3), the analysis of these data will allow to discuss the mechanisms leading to the accumulation of the two proteins.
4.1. Modeling of the adsorption kinetics: first and second order models The modeling of adsorption has been reviewed in recent papers [11,
13,15,16] and the kinetics models are always under debate.
Adsorption is usually based on the model originally proposed by Langmuir: dΓ dt¼kac � 1 Γ Γm � kd Γ Γm (3)
Where c (g.m 3) is the concentration of solute in solution over the
sur-face, Γ is the adsorded quantity on the surface (for example in g.m 2)
and Γm is the maximum adsorbed quantity. ka and kd are the adsorption
and desorption rate constants.
If the concentration of the solute in solution is considered constant with time and the adsorption rather irreversible ( kd ¼0), it is possible to derive pseudo-first-order models.
To derive different kinetics orders, it is proposed [11,15] to consider that the concentration of solute over the surface, c, can also vary with time. Several authors link this concentration to the concentration of occupied site. It is considered that the adsorption of solute from the solution leads to a decrease of the concentration of solute in the solution (The bulk is not a perfect source):
c ¼ c0 Γ
S
V (4)
If considering the mass balance related to the adsorption, c0 c c0 ce ¼
Γ Γe, the ratio S/V can be defined as a function of the equilibrium concen-tration of solute, ce, and the equilibrium-adsorbed quantity, Γe :
S V¼
c0 ce
Γe (5)
It is then possible to derive various kinetic models. The pseudo first order model is obtained when ΓS
V→0 and c ¼ c0. It corresponds to a Fig. 12. Comparison of the correlation between the permeate flux reduction
and the Mean Gray Value during the filtration of LALBA (50 mg L 1) and BSA
(1g.L 1) for the same hydrodynamic conditions of 75 μL min 1 and 180 mbar.
Fig. 13. Dependence of surface coverage by ACQ zones and Mean Gray Values
at the same filtrate volume (500 μL) on the Pe number during filtration of LALBA and BSA.
Fig. 14. Illustration of the fluorescence quenching induced by important
filtration P�eclet number. The importance of the flux through the membrane and a low tangential flow can induce a more important accumulation. This can result in the compression and/or aggregation of the protein that can lead, in turn, to the fluorescence quenching.
Γ ¼ Γm 1 e k1t
�
(6) The pseudo second order model (so called Ho model [13]) is derived when ΓS
V>0 so-called “solid dominated” when the surface is significant
compared to the volume i.e. almost all of the adsorbate is removed from the solution during the experiment. The sorption kinetics should follow the general differential equation:
dΓ dt¼ka � c0 c0 ce Γe Γ �� 1 Γ Γm � kd Γ Γm (7)
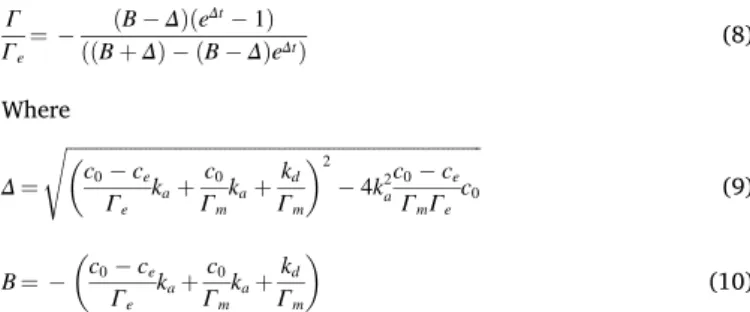
An analytical general solution can be found for this equation (the full derivation is given in supplementary information S5 according the development proposed by Refs. [15]).
Γ Γe ¼ ðB ΔÞðe Δt 1Þ ððB þ ΔÞ ðB ΔÞeΔtÞ (8) Where Δ ¼ ffiffiffiffiffiffiffiffiffiffiffiffiffiffiffiffiffiffiffiffiffiffiffiffiffiffiffiffiffiffiffiffiffiffiffiffiffiffiffiffiffiffiffiffiffiffiffiffiffiffiffiffiffiffiffiffiffiffiffiffiffiffiffiffiffiffiffiffiffiffiffiffiffiffiffiffiffiffiffiffiffiffiffiffi � c0 ce Γe kaþ c0 Γm kaþ kd Γm �2 4k2 a c0 ce ΓmΓe c0 s (9) B ¼ � c0 ce Γe kaþ c0 Γm kaþ kd Γm � (10) when Δt is small (corresponding to slow adsorption), the exponential terms can be linearized:
Γ ¼ Γe
ðB ΔÞt
ð2 ðB ΔÞtÞ (11)
The parameters of the kinetics can then be determined by plotting t Γ as a function of t t Γ¼ t Γe 2 ðB ΔÞΓe (12)
The classical second order kinetics is usually defined: t Γ¼ t Γe þ 1 k2Γ2e (13) where the apparent second order rate constant k2 is ðB ΔÞ2Γe and is then intricately connected (eqs. (9) and (10)) to the initial concentration of solute, c0.
Since in the present study we use fluorescence microscopy to quan-tify the protein adsorption by gray values, the equation for the first and second order sorption kinetics (eqs. (6) and (13) respectively) will be modified by substituting the level of gray value (GV) to Γ, to make it applicable for our case.
Both equations for the first order (eq. (6)) and for the pseudo-second order (eq. (13)) have been used to fit the experimental data. The best fit of the experimental data (so the lowest residue for this model with the same number of fitting parameters) has been obtained with the pseudo second order kinetics (the residue after curve fitting are given in SI 6 for all the experiments presented in the previous sections). The analysis of the residue shows that the second order model is significantly better to describe the BSA (c0 ¼1 g L 1) experiments and is slightly better for the LALBA (c0 ¼50 mg L 1).
It has been discussed [15] that the sorption kinetics could be described by a pseudo-first-order kinetics at high initial concentration of solute and by a pseudo-second-order kinetics model at lower initial concentration of solute. The results obtained here show that the second order is always the best fitting model even for BSA at a concentration of
1 g L 1.
This discrepancy can be explained by the large ratio S/V of our microfluidic system (eq. (4)). A quick adsorption kinetics especially of BSA can explained this observed pseudo-second order [13]. However, as discussed by Ref. [16], this is not a reason for considering that the as-sumptions needed in the mathematical development are fully satisfied. Several different physical mechanisms could be responsible of a second order like kinetics.
4.2. Effect of operating conditions on the second order kinetics parameters All fluorescence results have been fitted to a second order kinetics model (Eq. (13)) (the fitting is represented by the full line in Figs. 5 and 8). The fitting parameters are given in Tables s7-1 and S7-2 in the supplementary information SI7.
The apparent kinetics rate constant k2 is plotted as a function of the
P�eclet number for BSA and LALBA in Fig. 15 a). The apparent kinetics constant for BSA is always higher than the one for LALBA. At zero P�eclet
Fig. 15. a) Pseudo-second order apparent kinetics rate constant (s-1) and b)
Equilibrium adsorbed quantity (GV) obtained from the fitting of the adsorption kinetics (Figs. 6 and 11) with Eq. (13).
system where the volume is large compared to the adsorption surface “volume dominated” system: the concentration of solute is very high compared to the one consumed by adsorption. The first order kinetics [12] is then given by the following relationship:
(tangential flow without filtration), the average adsorption constant is 1.3 � 10 4 s 1 for BSA and 3.9 � 10 6 s 1 for LALBA. For BSA, when the
P�eclet number increases (i.e. when the accumulation due to filtration increases), the apparent adsorption constant shows a slight increase which is qualitatively in agreement with the theoretical approach that shows that the adsorption kinetics is an increasing function of the con-centration near the interface. For LALBA, the evolution of the apparent kinetics constant with the Pe number reveals two different regimes. After a slight increase similar to the one noted for BSA at low Pe number corresponding to a reversible adsorption regime, a change in behavior is observed beyond a Pe number around 3 with a noticeable increase in the apparent adsorption kinetics rate with Pe. The behavior in this zone can be ascribed to an irreversible adsorption of aggregated LALBA.
Fig. 15 b) presents the adsorbed amount at equilibrium, Γe, obtained
by fitting equation (13) to the adsorption kinetics (Figs. 6 and 11). The equilibrium-adsorbed quantity in gray value is similar for all the oper-ating conditions with BSA. However, for LALBA one observes a decrease in the equilibrium gray value when the P�eclet increases. This is corre-lated to the discussion in section 3.3.3: the quenching can lead to a decrease in gray value even in the non-fully quenched zone.
4.3. Discussion on the protein fouling mechanisms
The cross-analysis of the fluorescence and permeate flux data, shows two well different fouling behaviors by BSA and LALBA. The close monitoring of the adsorption kinetics of both proteins allowed by the microfluidics systems used in this work, allow to show that they obey the pseudo-second order law (eq. (13)) but the variations of the two pa-rameters with operating conditions of filtration (P�eclet number) are very different (Fig. 15). This model proves to be adapted to describe solute- surface interactions in systems characterized by large surface area to fluid volume ratio sur as a HD hollow fiber. In addition, the direct observation of the membrane surface during filtration shows that in conditions for which one of the proteins (BSA) remains stable, the other one (LALBA) may remain stable or be destabilized depending on the filtration conditions (Pe). Such a detailed analysis would not be possible in a macroscopic system.
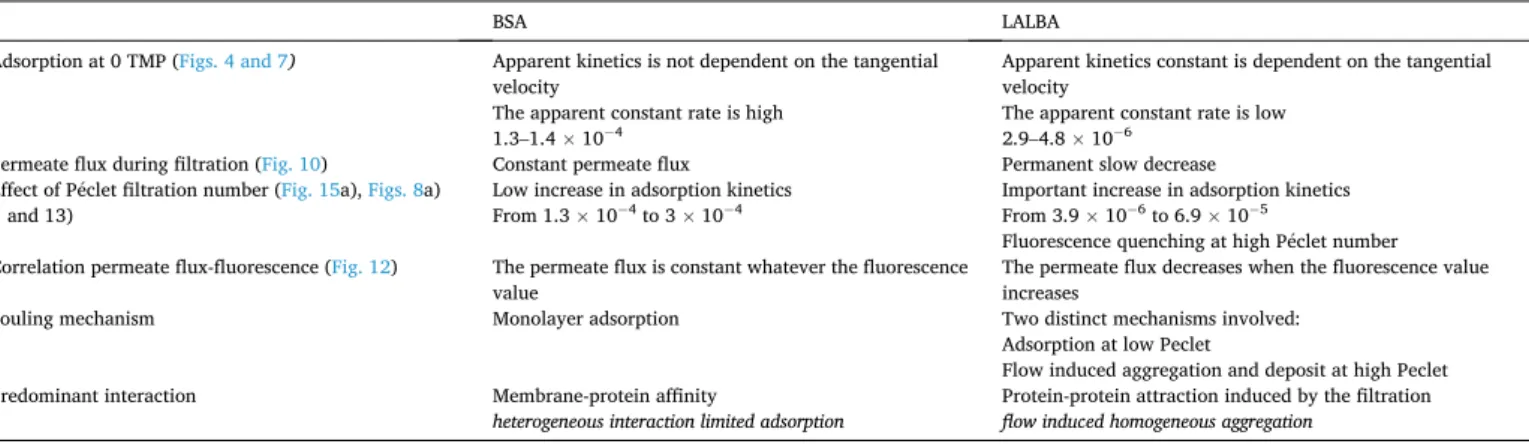
The main differences that have been experimentally determined are summarized in Table 2.
The adsorption kinetics is much faster for BSA and the apparent ki-netics rate does not vary a lot with the filtration flux. At the opposite, LALBA adsorption rate is slow and the apparent rate constant is sensitive to the cross flow at low TMP and increases a lot when the permeate flux (or the TMP) is increased. This picture is supported by a constant permeability when the layer is established. On the other hand, fouling by LALBA is more complex, as it corresponds to adsorption at low P�eclet,
changing to the deposition of proteins aggregates as soon as the P�eclet value increases. This is confirmed by the permanent flow decrease observed during filtration [41] and the fluorescence quenching that appears for high filtration rate. The fouling is then controlled by the membrane-protein interaction in the case of BSA [18] and by the protein-protein interactions for the LALBA (induced by the flow) [42]. 5. Conclusion
The microfluidic chip such as the one described in this paper allows the in situ monitoring of the deposition of labelled protein on a mem-brane and the measurement of the permeation flux over a range of conditions relevant to hemodialysis.
Thanks to this device, details can be obtained on the distribution of the proteins built-up on the membrane surface as a function of the dis-tance to the channel entrance. The most interesting advantage of this microchip device over standard bench scale filtration rigs is that it gives access to the dynamics of proteins accumulation on the membrane surface.
We showed that the fluorescence signal of labelled proteins attached to the membrane surface was well correlated to the flux decline. At high filtration rate however, a fluorescence quenching that can be attributed to the aggregation of labelled proteins was observed.
For the purpose of the present study, we could adjust the trans-membrane pressure and hydrodynamics to be relevant to those found in hemodialysis hollow fibers and performed a detailed study of the dy-namics of membrane fouling by two different proteins.
In those conditions, (low Re, low transmembrane pressure) we found that the interactions of BSA with a PES membrane lead to adsorption of the monolayer type, controlled by the affinity between the membrane material and the protein but quite independent on the hydrodynamics. The adsorption kinetics was found rapid compared to LALBA.
In the same range of conditions, we found that fouling by LALBA was controlled by the aggregation of proteins induced by the flow along the channel. This is why fouling by LALBA can be viewed as a flow induced aggregation and deposition on the membrane. The adsorption kinetics was slower than the BSA one and dependent on the filtration conditions. Authors statement
D.Sn. did the experiments. P.B. did the analysis by modeling. P.B. and C.C prepared the main manuscript text and figures. C.C., P.A. and D. St supervised the project. All authors reviewed the manuscript.
Table 2
Differences in fouling behavior observed for BSA and LALBA with a combined fluorescence-permeate flux analysis in a membrane microfluidic device. These dif-ferences allow to consider a main fouling mechanism controlled by monolayer adsorption for BSA and by flow induced aggregation and deposit for LALBA.
BSA LALBA
Adsorption at 0 TMP (Figs. 4 and 7) Apparent kinetics is not dependent on the tangential velocity
The apparent constant rate is high 1.3–1.4 � 104
Apparent kinetics constant is dependent on the tangential velocity
The apparent constant rate is low 2.9–4.8 � 106
Permeate flux during filtration (Fig. 10) Constant permeate flux Permanent slow decrease Effect of P�eclet filtration number (Fig. 15a), Figs. 8a)
and 13) Low increase in adsorption kinetics From 1.3 � 10 4 to 3 � 104 Important increase in adsorption kinetics From 3.9 � 10 6 to 6.9 � 105
Fluorescence quenching at high P�eclet number Correlation permeate flux-fluorescence (Fig. 12) The permeate flux is constant whatever the fluorescence
value The permeate flux decreases when the fluorescence value increases Fouling mechanism Monolayer adsorption Two distinct mechanisms involved:
Adsorption at low Peclet
Flow induced aggregation and deposit at high Peclet Predominant interaction Membrane-protein affinity Protein-protein attraction induced by the filtration
[1] R. van Reis, A. Zydney, Membrane separations in biotechnology, Curr. Opin. Biotechnol. 12 (2001) 208–211, https://doi.org/10.1016/S0958-1669(00)00201- 9.
[2] S.M. Morti, A.L. Zydney, Protein-membrane interactions during hemodialysis: effects on solute transport, ASAIO J. Am. Soc. Artif. Intern. Organs 44 (1992) 319–326, https://doi.org/10.1097/00002480-199807000-00015, 1998. [3] O. ter Beek, D. Pavlenko, M. Suck, S. Helfrich, L. Bolhuis-Versteeg, D. Snisarenko,
C. Causserand, P. Bacchin, P. Aimar, R. van Oerle, R. Wetzels, P. Verhezen, Y. Henskens, D. Stamatialis, New membranes based on polyethersulfone – SlipSkinTM polymer blends with low fouling and high blood compatibility, Separ.
Purif. Technol. 225 (2019) 60–73, https://doi.org/10.1016/j.seppur.2019.05.049. [4] D. Snisarenko, D. Pavlenko, D. Stamatialis, P. Aimar, C. Causserand, P. Bacchin,
Insight into the transport mechanism of solute removed in dialysis by a membrane with double functionality, Chem. Eng. Res. Des. 126 (2017) 97–108, https://doi. org/10.1016/j.cherd.2017.08.017.
[5] R.D. Frank, J. Weber, H. Dresbach, H. Thelen, C. Weiss, J. Floege, Role of contact system activation in hemodialyzer-induced thrombogenicity, Kidney Int. 60 (2001) 1972–1981, https://doi.org/10.1046/j.1523-1755.2001.00009.x.
[6] S. Sun, Y. Yue, X. Huang, D. Meng, Protein adsorption on blood-contact membranes, J. Membr. Sci. 222 (2003) 3–18, https://doi.org/10.1016/S0376- 7388(03)00313-2.
[7] I.H. Huisman, P. Pr�adanos, A. Hern�andez, The effect of protein–protein and protein–membrane interactions on membrane fouling in ultrafiltration, J. Membr. Sci. 179 (2000) 79–90, https://doi.org/10.1016/S0376-7388(00)00501-9. [8] S.P. Palecek, A.L. Zydney, Intermolecular electrostatic interactions and their effect
on flux and protein deposition during protein filtration, Biotechnol. Prog. 10 (1994) 207–213, https://doi.org/10.1021/bp00026a010.
[9] H. Mo, K.G. Tay, H.Y. Ng, Fouling of reverse osmosis membrane by protein (BSA): effects of pH, calcium, magnesium, ionic strength and temperature, J. Membr. Sci. 315 (2008) 28–35, https://doi.org/10.1016/j.memsci.2008.02.002.
[10] S.T. Kelly, A.L. Zydney, Mechanisms for BSA fouling during microfiltration, J. Membr. Sci. 107 (1995) 115–127, https://doi.org/10.1016/0376-7388(95) 00108-O.
[11] W. Rudzinski, W. Plazinski, Studies of the kinetics of solute adsorption at solid/ solution interfaces: on the possibility of distinguishing between the diffusional and the surface reaction kinetic models by studying the pseudo-first-order kinetics, J. Phys. Chem. C 111 (2007) 15100–15110, https://doi.org/10.1021/jp073249c. [12] K.L. Jones, C.R. O’Melia, Protein and humic acid adsorption onto hydrophilic
membrane surfaces: effects of pH and ionic strength, J. Membr. Sci. 165 (2000) 31–46, https://doi.org/10.1016/S0376-7388(99)00218-5.
[13] Y.-S. Ho, Review of second-order models for adsorption systems, J. Hazard Mater. 136 (2006) 681–689, https://doi.org/10.1016/j.jhazmat.2005.12.043. [14] V. Vadivelan, K.V. Kumar, Equilibrium, kinetics, mechanism, and process design
for the sorption of methylene blue onto rice husk, J. Colloid Interface Sci. 286 (2005) 90–100, https://doi.org/10.1016/j.jcis.2005.01.007.
[15] S. Azizian, Kinetic models of sorption: a theoretical analysis, J. Colloid Interface Sci. 276 (2004) 47–52, https://doi.org/10.1016/j.jcis.2004.03.048.
[16] J.-P. Simonin, On the comparison of pseudo-first order and pseudo-second order rate laws in the modeling of adsorption kinetics, Chem. Eng. J. 300 (2016) 254–263, https://doi.org/10.1016/j.cej.2016.04.079.
[17] Y. Vitry, S. Teychen�e, S. Charton, F. Lamadie, B. Biscans, Investigation of a microfluidic approach to study very high nucleation rates involved in precipitation processes, Chem. Eng. Sci. 133 (2015) 54–61, https://doi.org/10.1016/j. ces.2015.01.062.
[18] L. Nurdin, A. Venancio-Marques, S. Rudiuk, M. Morel, D. Baigl, High-throughput photocontrol of water drop generation, fusion, and mixing in a dual flow-focusing
J
microfluidic device, Compt. Rendus Chem. 19 (2016) 199–206, https://doi.org/ 10.1016/j.crci.2015.07.012.
[19] J. de Jong, R.G.H. Lammertink, M. Wessling, Membranes and microfluidics: a review, Lab Chip 6 (2006) 1125–1139, https://doi.org/10.1039/B603275C. [20] J.C.T. Eijkel, J.G. Bomer, A. van den Berg, Osmosis and pervaporation in polyimide
submicron microfluidic channel structures, Appl. Phys. Lett. 87 (2005), https:// doi.org/10.1063/1.2046727, 114103.
[21] J. Decock, M. Schlenk, J.-B. Salmon, In situ photo-patterning of pressure-resistant hydrogel membranes with controlled permeabilities in PEGDA microfluidic channels, Lab Chip 18 (2018) 1075–1083, https://doi.org/10.1039/C7LC01342F. [22] R. Vanholder, R. De Smet, G. Glorieux, A. Argil�es, U. Baurmeister, P. Brunet,
W. Clark, G. Cohen, P.P. De Deyn, R. Deppisch, B. Descamps-Latscha, T. Henle, A. J€orres, H.D. Lemke, Z.A. Massy, J. Passlick-Deetjen, M. Rodriguez, B. Stegmayr, P. Stenvinkel, C. Tetta, C. Wanner, W. Zidek, For the European uremic toxin work group (EUTox), review on uremic toxins: classification, concentration, and interindividual variability, Kidney Int. 63 (2003) 1934–1943, https://doi.org/ 10.1046/j.1523-1755.2003.00924.x.
[23] C.A.M. Portugal, J.G. Crespo, J.C. Lima, Monitoring the structural alterations induced in β-lactoglobulin during ultrafiltration: learning from chemical and thermal denaturation phenomena, J. Membr. Sci. 300 (2007) 211–223, https://doi. org/10.1016/j.memsci.2007.05.027.
[24] J. Belmejdoub, M. Rabiller-Baudry, D. Delaunay, G. G�esan-Guiziou, Structural modifications of globular proteins in an ultrafiltration loop as evidenced by intrinsic fluorescence and reverse-phase liquid chromatography, Separ. Purif. Technol. 96 (2012) 274–288, https://doi.org/10.1016/j.seppur.2012.06.010. [25] J.P.S.G. Crespo, M. Trotin, D. Hough, J.A. Howell, Use of fluorescence labelling to
monitor protein fractionation by ultrafiltration under controlled permeate flux, J. Membr. Sci. 155 (1999) 209–230, https://doi.org/10.1016/S0376-7388(98) 00309-3.
[26] L. Benavente, C. Coetsier, A. Venault, Y. Chang, C. Causserand, P. Bacchin, P. Aimar, FTIR mapping as a simple and powerful approach to study membrane coating and fouling, J. Membr. Sci. 520 (2016) 477–489, https://doi.org/10.1016/ j.memsci.2016.07.061.
[27] W.R. Clark, W.L. Macias, B.A. Molitoris, N.-H.L. Wang, Plasma protein adsorption to highly permeable hemodialysis membranes, Kidney Int. 48 (1995) 481–488, https://doi.org/10.1038/ki.1995.317.
[28] C.A. Schneider, W.S. Rasband, K.W. Eliceiri, NIH Image to ImageJ: 25 years of image analysis, Nat. Methods 9 (2012) 671–675, https://doi.org/10.1038/ nmeth.2089.
[29] M.R. Eftink, Fluorescence techniques for studying protein structure, in: Methods Biochem. Anal, John Wiley & Sons, Ltd, 2006, pp. 127–205, https://doi.org/ 10.1002/9780470110560.ch3.
[30] F. Bergstr€om, I. Mikhalyov, P. H€aggl€of, R. Wortmann, T. Ny, L.B.-Å. Johansson, Dimers of Dipyrrometheneboron Difluoride (BODIPY) with light spectroscopic applications in chemistry and biology, J. Am. Chem. Soc. 124 (2002) 196–204, https://doi.org/10.1021/ja010983f.
[31] N. Marm�e, G. Habl, J.-P. Knemeyer, Aggregation behavior of the red-absorbing oxazine derivative MR 121: a new method for determination of pure dimer spectra, Chem. Phys. Lett. 408 (2005) 221–225, https://doi.org/10.1016/j.
cplett.2005.04.008.
[32] X. Ma, R. Sun, J. Cheng, J. Liu, F. Gou, H. Xiang, X. Zhou, Fluorescence aggregation-caused quenching versus aggregation-induced emission: a visual teaching technology for undergraduate chemistry students, J. Chem. Educ. 93 (2016) 345–350, https://doi.org/10.1021/acs.jchemed.5b00483.
[33] M. Huang, R. Yu, K. Xu, S. Ye, S. Kuang, X. Zhu, Y. Wan, An arch-bridge-type fluorophore for bridging the gap between aggregation-caused quenching (ACQ) and aggregation-induced emission (AIE), Chem. Sci. 7 (2016) 4485–4491, https:// doi.org/10.1039/C6SC01254J.
[34] L.H. Greene, J.A. Grobler, V.A. Malinovskii, J. Tian, K.R. Acharya, K. Brew, Stability, activity and flexibility in α-lactalbumin, Protein Eng. Des. Sel. 12 (1999) 581–587, https://doi.org/10.1093/protein/12.7.581.
[35] M. Van Audenhaege, S. Pezennec, G. Gesan-Guiziou, Ultrafiltration membrane cut- off impacts structure and functional properties of transmitted proteins: case study of the metalloprotein α-lactalbumin, Separ. Purif. Technol. 114 (2013) 73–82, https://doi.org/10.1016/j.seppur.2013.04.038.
[36] A.C. M Franken, J.T.M. Sluys, V. Chen, A.G. Fane, Role of protein conformation on membrane characteristics, in: Fifth World Filtr. Congr, 1990. Nice, France. [37] M. Meireles, P. Aimar, V. Sanchez, Albumin denaturation during ultrafiltration:
effects of operating conditions and consequences on membrane fouling, Biotechnol. Bioeng. 38 (1991) 528–534, https://doi.org/10.1002/bit.260380511. [38] R. Chan, V. Chen, Protein transport, aggregation, and deposition in membrane
pores, in: Supramol. Struct. Confin. Geom, American Chemical Society, 1999, pp. 231–246, https://doi.org/10.1021/bk-1999-0736.ch016.
[39] S.T. Kelly, W. Senyo Opong, A.L. Zydney, The influence of protein aggregates on the fouling of microfiltration membranes during stirred cell filtration, J. Membr. Sci. 80 (1993) 175–187, https://doi.org/10.1016/0376-7388(93)85142-J. [40] K.J. Jim, A.G. Fane, C.J.D. Fell, D.C. Joy, Fouling mechanisms of membranes
during protein ultrafiltration, J. Membr. Sci. 68 (1992) 79–91, https://doi.org/ 10.1016/0376-7388(92)80151-9.
[41] P. Aimar, P. Bacchin, Slow colloidal aggregation and membrane fouling, J. Membr. Sci. 360 (2010) 70–76, https://doi.org/10.1016/j.memsci.2010.05.001. [42] P. Bacchin, A. Marty, P. Duru, M. Meireles, P. Aimar, Colloidal surface interactions
and membrane fouling: investigations at pore scale, Adv. Colloid Interface Sci. 164 (2011) 2–11, https://doi.org/10.1016/j.cis.2010.10.005.
Declaration of competing interest
The authors declare that they have no known competing financial interests or personal relationships that could have appeared to influence the work reported in this paper.
Acknowledgements
The authors acknowledge Dr. Sebastien Teychene, Dr. Isaac Rodriguez-Ruiz and Dr. Nhat Pham for the help in the development and the fabrication of the microfluidic chips integrating a membrane. The authors thank the Marie Skłodowska-Curie foundation (Project BIOART: grant no.316690, EU-FP7-PEOPLE-ITN-2012) for the financial support of this project.
Appendix A. Supplementary data
Supplementary data to this article can be found online at https://doi. org/10.1016/j.memsci.2020.118485.