Open Archive TOULOUSE Archive Ouverte (OATAO)
OATAO is an open access repository that collects the work of Toulouse researchers and
makes it freely available over the web where possible.
This is an author-deposited version published in :
http://oatao.univ-toulouse.fr/
Eprints ID : 18526
To link to this article :
DOI: 10.14356/kona.2018017
URL :
http://dx.doi.org/10.14356/kona.2018017
To cite this version :
Bourgeois, Florent and Teychene, Sébastien
and Biscans, Béatrice Applicability of Probabilistic Nucleation
Modelling for the Analysis of Microfluidics Data. (2017) Kona
Powder and particles. ISSN 0288-4534
Any correspondence concerning this service should be sent to the repository
administrator:
[email protected]
Applicability of Probabilistic Nucleation Modelling
for the Analysis of Microfluidics Data
†
Florent Bourgeois
*, Sébastien Teychené and Béatrice Biscans
1 Laboratoire de Génie Chimique, Université de Toulouse, CNRS, INPT, UPS, Toulouse, France
Abstract
Microfluidics tools have been developing rapidly over the past decade, as they offer unparalleled ability for controlling nucleation and tracking crystallisation events inside very large numbers of individual nanolitre-size droplets. They have demonstrated a significant potential for screening protein crystallization conditions and for the direct determination of inorganic products solubility curves. The accepted basis for analysing microfluidics data is the probabilistic nucleation model originally proposed by Pound and La Mer (1952). Given the significance of this model for the purpose of analysing microfluidics data, the paper conducts a review of its hypotheses, usage and applicability. A step-by-step derivation of the model equations confirms that the time variation of the proportion of empty droplets which microfluidics experiments can provide with high accuracy is indeed the recommended method for estimation of nucleation kinetic parameters from microfluidics experiments. The paper shows that, depending on its implementation, the model predicts different rates of appearance of crystals inside individual droplets. The paper focuses on two distinct implementation modes, referred to as constant supersaturation and single nucleation event modes. By confronting model prediction with microfluidics measurements for eflucimibe in octanol, the paper finds that both modes yield different model predictions, shedding light on the potential and limits of the probabilistic nucleation model for the analysis of microfluidics data.
Keywords: microfluidics, nucleation, modelling
1. Introduction
Microfluidics devices have become key research tools in recent years for the screening of the crystallization conditions of proteins (Selimović et al., 2009), the deter-mination of crystallization kinetics (Laval et al., 2009; Teychené and Biscans, 2012) and precipitation kinetics (Vitry et al., 2015). The principle of this method is to di-vide the volume of the studied solution into a large number of small, independent droplets in an inert oil. These drop-lets can be produced in specific microfluidics geometries and their volume and chemical composition can be fixed in a controlled way. In addition, microfluidics devices al-low a rapid mixing of the different compounds, help pre-vent hydrodynamic dispersion and cross-contamination, and the droplets can be stored in microchannels.
For nucleation studies, this experimental technique generates a great deal of data that permit reliable access
to the kinetics of nucleation. Typically, the frequency of nucleation events is obtained by counting over time the number of drops without crystals (Laval et al., 2009). When the number of droplets is larger than the number of impurities initially present in the solution, one can ob-serve homogeneous nucleation in some droplets. More-over, when all the droplets have the same volume V and for a small enough V, it is in principle possible to relate the probability that a droplet contains a crystal to the nucleation rate (Kashchiev et al., 1994). Measurements of the temporal evolution of the fraction of droplets that con-tain crystals thus permit an estimation of the nucleation kinetics.
The processing of the data generated by such tech-niques remains limited, however. Indeed, because of the presence of a surfactant, an interface as well as some dust or impurities, the majority of published experimental studies show that the appearance of crystal nucleation in these systems is due to two concomitant mechanisms, namely heterogeneous and homogeneous nucleation. In general, nucleation data that originate from such experi-ments are treated either by neglecting the first instance of nucleation (Dombrowski et al., 2010), by treating the nucleation process in a comprehensive manner without
differentiating between possible nucleation mechanisms (Goh et al., 2010) or by averaging the influence of impu-rities on the crystallization process (Laval et al., 2009; Teychené and Biscans, 2011). In addition to the models developed by Goh et al. (2010) in the case of protein crys-tallization by evaporation, we propose a probabilistic model of the nucleation process that allows us to have ac-cess to the different nucleation kinetics that are observed experimentally, to deduce the temporal evolution of the number of crystals within the droplets, and also to trace the influence of “active sites” on nucleation.
2. Probabilistic nucleation model for analysis
of microfluidics experiments
2.1 Nucleation model derivation
The nucleation process inside individual droplets can be analysed using a probabilistic nucleation model. Such an approach appears in a number of published studies in the context of microfluidics systems, albeit through differ-ent forms and uses. It is revisited here in some detail with the objective of establishing a sound basis for its applica-bility and usage in the context of microfluidics nucleation analysis.
The model first considers two distinct types of droplets, namely droplets with active nucleation sites and droplets without any nucleation site. Only homogeneous nucleation events can occur inside droplets devoid of nucleation sites, whereas both homogeneous and heterogeneous nu-cleation events can possibly take place inside droplets that bear active nucleation sites.
The nucleation model that results, whereby the first ac-count of the probabilistic nucleation model is credited to Pound and La Mer (1952), uses only 3 macroscopic pa-rameters, all of which have solid theoretical bases.
The first model parameter m is the mean number of active nucleation sites inside the system’s droplets. Con-sidering that active nucleation sites are identical in all re-spects and that they nucleate independently of each other inside a droplet, the probabilistic model considers that ac-tive nucleation sites have the same nucleation kinetic rate
k (time–1), the model’s second parameter. The third model
parameter is the homogeneous nucleation kinetic rate k0
(time–1), which applies to all droplets devoid of nucleation
sites, and also to droplets with active nucleation sites if they undergo homogeneous nucleation.
To avoid any ambiguity, the term “homogeneous nucle-ation” that is used throughout this paper was chosen to keep consistent with the original definition by Pound and La Mer (1952). It refers to nucleation that occurs in the volume of the droplet, as opposed to “heterogeneous nu-cleation” which is understood to take place on the surface
of nucleation sites. The nucleation mechanism associated with the term k0 is therefore not to be mistaken for the
ho-mogeneous nucleation rate defined in Classic Nucleation Theory (CNT). This point, which has already been pointed out by several authors (Laval et al., 2009; Akella et al., 2014) in relation to probabilistic nucleation model-ling, will be further discussed in section 3 of the paper.
Since we have no reason to expect interdependence of the droplets inside our microfluidics system – the system is designed so that two droplets have no interaction with each other – then a Poisson process is a suitable candidate for describing the statistics of nucleation events that occur within individual droplets. This simple statement justifies application of the Poisson statistics, as initially proposed by Pound and La Mer (1952) to model the nucleation pro-cess in microfluidics systems.
Considering a system with NT droplets in total, the
number Np of droplets with p active nucleation sites is predicted by the Poisson distribution with mean m such that:
T ( , ) where 0, p
N N dpois p m p (1)
where dpois() denotes the probability density function of
the Poisson distribution. Since ( , ) e
! p m m dpois p m p , the
expected fraction of droplets without active nucleation sites is therefore e–m and the number of droplets with
ac-tive sites is 1 – e–m. Sear (2014) indicates that m should lie
in the range 0.1 to 1. This means that the maximum num-ber of active nucleation sites per droplet that can be ex-pected, with a confidence level of 99 %, is in the range 1 to 4. These values correspond to the 99 % quantiles of the Poisson distribution with mean m = 0.1 and m = 1, respec-tively. Given that k0t is the mean number of nucleation
events to occur inside a droplet without active nucleation sites during time period t, the probability that r nucleation events take place inside such a droplet during time period
t is:
0
( , ) where 0,
dpois r k t r (2)
Such a droplet may produce any number r of nuclei. Thus, the number of droplets without nucleation sites that contain r crystals at time t is:
0( , ) T (0, ) ( , )0 where 0, N r t N dpois m dpois r k t r (3)The nucleation event that takes place inside a droplet that carries p active nucleation sites is a Bernoulli random variable with probability 0
0 k q k pk for homogeneous nucleation and 0 1 q pk k pk
for heterogeneous
The probability of homogeneous nucleation is expected to be significantly lower than that of heterogeneous nucle-ation, typically one or two orders of magnitude lower. This explains why Pound and La Mer (1952) neglected the possibility that a droplet with active nucleation sites may nucleate homogeneously. Akella et al. (2014) corrected this assumption and justly accounted for this possibility in their work. Finally, the probability that r nucleation events take place inside such a droplet during time period
t is:
0 0 0 ( , ) 0 ( , ) where 0, k dpois r k t pk dpois r pkt k pk k pk r (4)The second Poisson density distribution dpois(r, pkt) could be upper truncated at p, if one assumes that one ac-tive nucleation site can produce one nucleus only. The au-thors chose not to truncate this distribution, assuming that a nucleation site can produce any number of nuclei. The number of droplets with p nucleation sites that contain r crystals at time t is therefore:
T 0 0 0 0 ( , ) ( , ) ( , ) ( , ) where 0, p N r t N dpois p m k dpois r k t k pk pk dpois r pkt k pk r (5)Finally, the total number of droplets with r crystals at time t is given by:
T 0 0 0 0 T 1 0 ( , ) (0, ) ( , ) ( , ) ( , ) ( , ) where 0, p N r t N dpois m dpois r k t k dpois r k t k pk N dpois p m pk dpois r pkt k pk r
(6)and the number fraction fr(t) of droplets that bear r crys-tals at time t is:
0 0 0 0 1 0 (0, ) ( , ) ( , ) ( , ) ( , ) where 0, r p f t dpois m dpois r k t k dpois r k t k pk dpois p m pk dpois r pkt k pk r
(7)This equation is the main equation for predicting the state of the microfluidics system at any time t. For all practical uses, there is no need to use the analytical ex-pression of the probability density function (PDF) of the Poisson distribution since it is easily computed by
numer-ical software programs.
However, in order to relate this expression to the ana-lytical expressions that can be found in the literature, some of which are referred to in the following section, equation (8) gives the analytical equivalent for the number fraction fr(t) of droplets that bear r crystals at time t.
0 0 0 0 0 0 1 0 e e ! e ! e ! e ! where 0, r m k t r r k t p m r p pkt k t f t r k k t k pk r m p pk pkt k pk r r
(8)2.2 The case of empty droplets
The time variation of the fraction of empty droplets is well accepted as a means of estimating nucleation param-eters m, k0 and k from microfluidics experimental data.
This section reviews this important practical issue. From equation (7), the number fraction f0(t) of empty
droplets (r = 0) at time t is:
0 0 0 0 0 1 0 (0, ) (0, ) (0, ) ( , ) (0, ) p f t dpois m dpois k t k dpois k t k pk dpois p m pk dpois pkt k pk
(9)Or, from equation (8):
0 0 0 0 0 1 0 e e e e ! e m k t k t p m p pkt f t k k pk m p pk k pk
(10)This expression appears different from those published by Pound and La Mer (1952), and later by Akella et al. (2014). The differences are clarified in the following text.
First of all, let us suppose that the droplets are either without or with active nucleation sites, as was assumed by Pound and La Mer (1952). Equation (10) becomes:
0 0 0 0 1 1 e e e 0 e 1 e ! e e e e ! m k t p m k t pkt p p m k t m pkt p f t m p m p
(11)Besides the case where k >> k0, which hails back to
to equations (9) and (10), recalling that they apply to the situation where droplets with nucleation sites can nucleate homogeneously or heterogeneously. Akella and Fraden (2014), however, published the following equation under these assumptions:
0
0 e m e k t exp e kt
f t m (12)
It can be shown that this expression is the analytical expression for f0(t) that corresponds to the following
nu-cleation model:
0 0 1 (0, ) ( , ) ( , ) ( , ) where 0, r p f t dpois m dpois r k t dpois p m dpois r k pk t r
(13)This equation assigns a nucleation rate (k0 + pk) to the
probability of nucleation of droplets with active sites, when in actual fact, the probabilities of nucleation are different depending on whether these droplets nucleate homogeneously or heterogeneously. This oversight is of no consequence when predicting the time variation of
fr(t) in the case k >> k0. However, it becomes increasingly
significant when the difference between homogeneous and heterogeneous nucleation rates decreases, leading to incorrect estimates of nucleation parameters from the measured variation f0(t).
While providing the reader with a step-by-step deriva-tion of the probabilistic nucleaderiva-tion model, this secderiva-tion has highlighted that one must be careful and use the model that precisely matches the assumptions.
This simplifies to the expression derived by Pound and La Mer (1952):
0
0 e m e k t exp e kt 1
f t m (14)
whose equivalent in terms of Poisson distribution is:
0 0 1 (0, ) (0, ) ( , ) (0, ) p f t dpois m dpois k t dpois p m dpois pkt
(15)This is particularly critical when using the model to esti-mate nucleation model parameters from which phenomeno-logical analysis of the nucleation process can be inferred.
2.3 Analysis of probabilistic nucleation model usage
In addition to differences that may arise from model assumptions on the final form of the probabilistic nucle-ation model, differences will also occur depending on how it is implemented.
Assuming that droplets with active sites can nucleate homogeneously or heterogeneously, and that nucleation
events can yield any number of nuclei, equations (7) and (8) give the time variation of droplets with r crystals given nucleation parameters m, k0 and k.
For the sake of clarity, the behaviour and possible uses of this model are discussed below through numerical ex-amples. The mean number of active nucleation sites per droplet is set to m = –ln(0.5), which corresponds to an equal proportion of droplets with and droplets without ac-tive nucleation sites. The values of the nucleation rates for homogeneous and heterogeneous nucleation, noted k0 and k, respectively, will be varied in the examples that follow.
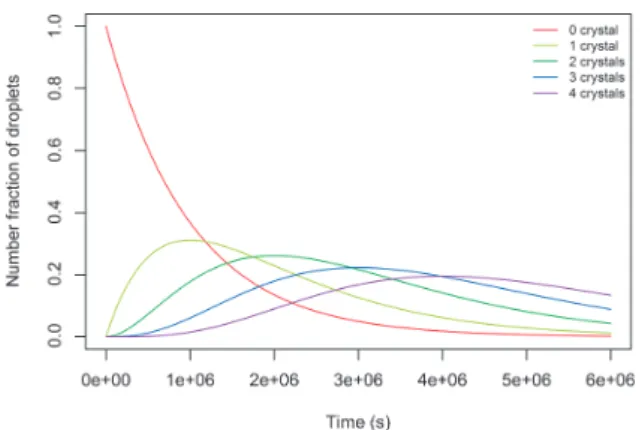
For the sake of readability, only predictions of f0(t)
through f4(t) are plotted, that is the fractions of droplets
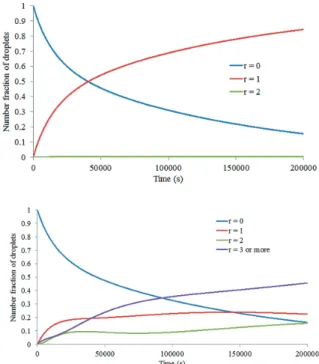
that bear up to 4 crystals. This is deemed sufficient to re-veal the pattern of the models. Fig. 1 shows the nucleation model behaviour for a decreasing ratio between homoge-neous and nucleation kinetic constants k0/k.
What these curves all have in common is that the pro-portion of droplets with a given number of crystals in-creases, goes through a maximum (or two), and then drops back to zero. When the ratio between homogeneous and heterogeneous kinetic constants k0/k is low, the curves
ex-hibit 2 modes. Theses modes relate to the occurrence of homogeneous and heterogeneous nucleation events, and the more different their nucleation rates the more separate and distinct the 2 modes. These curves evolve gradually towards single mode curves as the ratio k0/k increases;
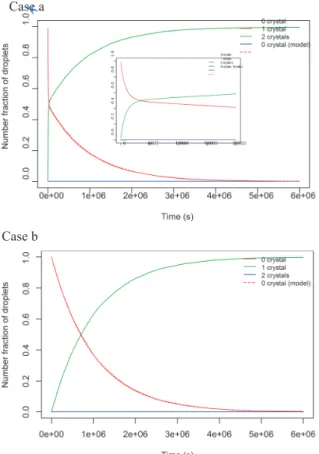
this is the behaviour that is most often portrayed in the literature (Dombrowski et al., 2010; Goh et al., 2010). The limiting case for this ratio corresponds to k = 0, which is that of purely homogeneous nucleation. Fig. 2 shows the result of the model for k = 0.
The underlying assumption behind all the model pre-dictions presented above is that droplets which have un-dergone a nucleation event at time t can sustain other nucleation events at a later time, with the same nucleation kinetics. This is equivalent to saying that the state of supersaturation inside individual droplets remains con-stant as time advances (i.e. the crystal growth rate is zero). We shall refer to this use of the nucleation model as
constant supersaturation mode.
Another way of using the nucleation model consists of allowing droplets to undergo only one nucleation event, with the outcome in terms of number of crystals deter-mined by the Poisson statistics of the model. This mode may offer a better representation of reality in microfluid-ics experiments where the constant supersaturation mode does not apply. We shall refer to this mode as the single
nucleation event mode. In this case, model predictions
can no longer be made analytically as they require using a Monte Carlo (MC) simulation scheme that predicts the nucleation of every single droplet in the system. Fig. 3 explains implementation of the nucleation model by Monte Carlo.
Fig. 4 shows the output of the probabilistic nucleation model, used in single nucleation event mode, for Fig. 1, Case a (mixed homogeneous/heterogeneous nucleation), and Fig. 2 (homogeneous nucleation only), recalling that they were obtained using the model in constant supersat-uration mode.
Predictions using the single nucleation event mode or
the constant supersaturation mode are totally different, as one would expect. Where the model with constant super-saturation predicts any number of crystals inside the droplets, the single nucleation event mode rarely predicts more than 1 crystal per droplet with the nucleation pa-rameters used.
It is important to recognise that f0(t) is the same
regard-less of the model used, i.e. whether it is used in single nu-cleation event mode or in constant supersaturation mode. This can be demonstrated analytically, and comes from the fact that the nucleation rate of droplets is independent of the path followed by the nucleation events that follow. This is confirmed in the previous figures, which show that the prediction for f0(t) using analytical equation (9) is
in-distinguishable from that calculated by the MC simulation scheme. This result fully endorses using the variation of empty droplets to estimate the nucleation parameters from microfluidics experiments.
3. Application of the probabilistic nucleation
model to the analysis of microfluidics
nucleation data
As discussed in section 2, the probabilistic nucleation model can be used to estimate nucleation parameters m,
k0 and k, directly from the measured variation of f0(t).
Once the nucleation parameters have been estimated, the model can then be applied to predict the variation of fr(t) for any value of the number r of crystals. This section re-views application of the model to both endeavours, and discusses the behaviour and validity of the probabilistic nucleation model through the prism of actual microfluid-ics experimental data sets.
3.1 Experimental data
The applicability of the probabilistic nucleation model, which includes estimation of nucleation parameters and Fig. 1 Illustration of the probabilistic nucleation model
be-haviour. Cases a, b and c show the effect of a decreas-ing ratio between homogeneous and heterogeneous nucleation kinetic constants k0/k. Inserts are used to
zoom on the heterogeneous nucleation period.
Case a: Mixed homogeneous/heterogeneous nucleation
with k0/k = 0.01 (m = –ln(0.5), k0 = 10–6 s–1, k = 10–4 s–1)
Case b: Mixed homogeneous/heterogeneous nucleation
with k0/k = 0.1 (m = –ln(0.5), k0 = 10–5 s–1, k = 10–4 s–1)
Case c: Mixed homogeneous/heterogeneous nucleation
with k0/k = 1 (m = –ln(0.5), k0 = k = 10–4 s–1)
Fig. 2 Model prediction with homogeneous nucleation only
prediction of nucleation events inside individual droplets, was tested using 4 data sets from the authors (see Teychené and Biscans, 2011), and two additional data sets from Akella et al., Figs. 25 and 29 (Akella et al., 2014). The lat-ter are used in section 5. Table 1 summarises the experi-mental conditions used to generate the microfluidics data. The experimental protocol is summarised below, how-ever, the reader is invited to refer to Teychené et al. (2011) for details. The data were generated using a glass micro-fluidics platform in the context of a study about the nucle-ation of eflucimibe crystals in octanol. Undersaturated droplets of eflucimibe dissolved in octanol were generated with water as the carrier fluid. These droplets were gener-ated using a flow-focusing geometry that generates highly monodispersed droplets. In these experiments, the varia-tion of volume between droplets is less than 0.1 nL.
Glass syringes, equipped with patterned filters (Milli-pores, pore diameter < 0.2 μm), are used to inject the flu-ids into the devices. The temperature of the syringe and the tubing that contain the organic solution are controlled to avoid crystallization by means of a small flexible heater. Flow rates are controlled by syringe pumps (PhD
2000, Harvard apparatus). The temperature of the micro-fluidic platform is precisely controlled using Peltier ele-ments. Platinum temperature sensors, which are embedded in the microfluidics chip, provide precise temperature monitoring. Owing to this temperature control, the drop-lets are generated at a temperature 5 °C above the satura-tion temperature (denoted as T* in Table 1) for all the experiments. As soon as the desired amount of droplets is obtained on the microfluidics chip, typically 600 to 800, the flow is stopped and the system is rapidly cooled (i.e. in less than 1 minute) down to the desired temperature in order to induce supersaturation (denoted as Tnucleation in
Table 1).
Digital images of the whole microfluidics chip were ac-quired using an inverted light microscope (Zeiss AXIO observer) equipped with a CCD colour camera (PCO Sen-sicam QE) at a frame rate ranging from 5 to 30 minutes. The optical resolution of the system is 1 μm/pixel with the 10´ objective, and the particle detection threshold is around 5 μm.
As unfrozen droplets can be identified without ambigu-ity, their number was determined automatically by image Fig. 3 Principle of the MC simulation scheme implementing equation (7), for one set of nucleation parameters (m, k0, k).
analysis. The number of crystals in frozen droplets, how-ever, was counted by visual inspection. With each experi-ment, the time at which the first visible crystallization event occurred was recorded. It varied between 25 and 70 minutes. This value was ultimately used to rescale the ex-perimental time.
3.2 Estimation of nucleation kinetic parameters
Under the assumption of normality of experimental er-rors, the model parameters m, k0 and k are estimated by
non-linear least squares minimization. Given the large amount of data points obtained at the end of a microfluid-ics experiment, the more so for empty droplets, the exper-imental data can confidently be bootstrapped in order to provide an estimate of the confidence intervals of
nucle-ation model parameters, as well as the model confidence and prediction intervals. Fig. 5 illustrates one bootstrap iteration of the parameter estimation scheme applied to data set D. Typically, 1000 bootstrap iterations are carried out for a data set that comprises over one hundred data points.
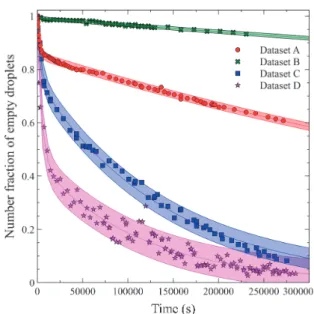
Each bootstrap iteration gives a set of model parame-ters (m, k0, k), and the combined bootstrap estimations
yield the model confidence and prediction intervals. Fig. 6 gives the estimated 95 % prediction intervals for data sets A through D, using 1000 bootstrap estimates in each case.
The bootstrap estimations yield the distribution of indi-vidual model parameters from which their confidence in-tervals can also be obtained. Table 2 gives the results that were obtained from the 4 selected data sets.
For all data sets, the relative standard deviation (RSD) of the estimated parameter k0, defined by Pound and La
Mer (1954) as the rate of volume nucleation (i.e. k0 = JvV,
cf. Eqn. 15), is small. This means that the experimental sampling frequency was high enough to capture the es-sential features of the homogeneous nucleation kinetic component of the nucleation model.
Parameters m and k relate to the heterogeneous nucle-ation kinetic component of the nuclenucle-ation model. Table 2 shows that parameter k is not estimated with the same Fig. 4 Model prediction using single nucleation event mode.
The dotted lines represent the analytical prediction of
f0(t) from model equations (9) or (10).
Case a: Simulation run output for the mixed
homo-geneous/heterogeneous nucleation case. m = –ln(0.5),
k0 = 10–6 s–1, k = 10–4 s–1, NT = 10000 droplets,
∆t = 100 s. At t = 106 seconds, the model predicts
18.29 % empty droplets, 81.67 % droplets with 1 crys-tal, 0.15 % droplets with 2 crystals, 0 % with 3 crystals.
Case b: Simulation run output for the pure
homoge-neous case. m = –ln(0.5), k0 = 10–6 s–1, k = 0 s–1,
NT = 10000 droplets, ∆t = 100 s. At t = 106 seconds, the
model predicts 36.1 % empty droplets, 63.9 % droplets with 1 crystal, 0 % droplets with 2 crystals.
Table 1 Experimental conditions used to produce the
micro-fluidics experimental data. The average droplet vol-ume is 11.5 ± 0.1 nL. Data sets (°C)T* Tnucleation(°C) 103 × x° 103 × x* Sx A 47 20 4.202 1.870 2.25 B 40 5 2.847 1.411 2.02 C 50 5 5.536 1.411 3.92 D 60 5 8.088 1.411 5.73
Fig. 5 Example of a bootstrap estimation of the nucleation
model parameters. The blue symbols are the experi-mental data points, the red symbols the bootstrap sam-ple, and the solid line is the model regression for the bootstrap sample.
precision as parameter k0. Heterogeneous nucleation is a
process that proceeds very fast at the beginning of the experiment because the energy barrier to form a critical nucleus is lower with surface nucleation than it is with volume nucleation. Moreover, the lower the number of impurities per drop, the rarer the occurrence of nucleation events. Sampling frequency at the start of an experiment is therefore critical for capturing the salient features of heterogeneous nucleation. The frame rate used to conduct the microfluidics experiments was not always sufficient and sometimes yielded only a handful of experimental points inside the heterogeneous nucleation period. This observation, which can be readily observed in Fig. 6, ex-plains that the lower the mean number of impurities per droplet, the broader the confidence interval associated with estimation of parameter k. The worst case occurred
with data sets A and B. This result is exacerbated by sam-pling statistics. Indeed, the fact that data set B contains
Nact. = 0.8 % of droplets with active nucleation sites means
that in a microfluidics experiment that uses 600 to 800 droplets, the number of droplets with active nucleation sites is on average no more than 7. Such a number is clearly too low to expect precise estimates of heteroge-neous nucleation rate parameters k and m. When the amount of impurities is high enough, as with data sets C and D, the sampling frame rate is sufficient and nucleation rate parameter k and m are estimated with good precision.
Notwithstanding the difficulty with estimation of k at low levels of impurities, Fig. 7 shows that the heteroge-neous nucleation parameters m and k are negatively cor-related. The interpretation of the correlation between the estimated values of k and m, where the latter increases with supersaturation as one would expect, is unclear. It is emphasised that the variation of k between experiments does not contradict the model assumption that k is the same for all active nucleation sites; it just indicates that the nature of active nucleation sites differs between ex-periments.
Although the purpose of this paper was not to venture into nucleation theory, it seemed justified to give some in-terpretation of the values of the estimated nucleation model parameters that were obtained.
In the framework of CNT, the homogeneous nucleation rate is related to the parameter of the nucleation model by the following equation (Kashchiev, 2000):
* v 0 3 2 B B 0 3 2 0exp 3(16π) lnm exp Δ v k T S A k TG k σ v J V A (16) According to equation (16), k0 is the product of the
vol-ume of the solution V where nucleation occurs and the rate of nucleation J (number of particles per unit time and unit volume). So, CNT for homogeneous nucleation im-plies that nucleation kinetics parameters are related to the volume of the droplets, and therefore the size, or size distribution of the droplets. In the context of this study, Fig. 6 Nucleation model 95 % prediction interval estimated
for data sets A through D.
Fig. 7 Illustration of the strong correlation between
heteroge-neous nucleation rate parameters m and k. The correla-tion plotted is: log10k = –3.82 – 0.48log10m.
Table 2 Estimated nucleation model parameters (m, k0, k) for
data sets A through D, and number fraction Nact. = 1–
e–m of droplets with active nucleation sites. The table
indicates the estimated mean and relative standard deviation (RSD). Data sets A B C D k0 × 106 (s–1) mean 1.26 0.26 7.05 8.78 RSD 0.9 % 5.5 % 1.6 % 3.0 % k × 104 (s–1) mean 4.55 9.61 2.24 1.71 RSD 17.9 % 91.5 % 16.5 % 14.7 % m mean 0.16 0.01 0.28 0.85 RSD 1.0 % 70.7 % 3.5 % 4.0 % Nact. mean 0.147 0.008 0.248 0.573 RSD 0.9 % 66.7 % 3.1 % 2.5 %
droplets are monodisperse and their volume is invariant during any given microfluidics experiment.
A0 is the nucleation rate prefactor which can be written
as (Kashchiev, 2000): * 0 N N B Δ 4π exp F A ρ Zj ρ Z ρDr k T (17) Where * B Δ 4π exp F j ρDr k T
is the rate at which a
monomer is added to the critical cluster, ρ is the number density of a monomer in the solution, D the diffusion co-efficient, r* the critical radius of the nuclei,
B Δ exp F k T
is the probability of effective collision between a cluster and a monomer, and ρN is the number density of nucleation
sites. As with homogeneous nucleation, every monomer can be a nucleation site ρ = ρN.
Similarly, the heterogeneous surface nucleation rate is written as (Kashchiev, 2000): * s ' s 0 B Δ exp G J A k k T (18)
As the main assumption of CNT is that the properties (shape, surface tension, etc.) of the pre-critical nuclei are the same as those of the post-critical nuclei and of the crystal, the pre-exponential factor has the same expres-sion. However, in that case, the number density of nucle-ation site is directly related to the number density of impurities and is much smaller than the number density of monomers.
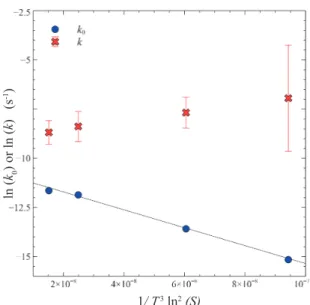
The evolution of the nucleation rate (k0) as a function of
temperature and supersaturation is given in Fig. 8. As predicted by CNT, it is found that ln(k0) varies linearly
with the term T–3ln–2S. The crystal solution interfacial
tension is calculated from the slope of the line, giving a value of 3 mJ·m–2 that is consistent with the data already
published (Teychené and Biscans, 2008). From the inter-cept, the pre-exponential factor of the nucleation rate was found to be in the range of 107, which is very low for a
purely homogeneous nucleation rate. Estimation of this factor from CNT in the case of a purely homogeneous nu-cleation yields values in the range 1010 to 1013 s–1. Because
the number of nucleation sites is smaller than the number of monomers in solution, the discrepancy can be attributed either to heterogeneous nucleation (with static heteroge-neities present in the solution from the start of the experi-ment, but with a lower activity than the impurities responsible for the fast nucleation rate), or to the inability of CNT to capture the complexity of crystal nucleation from solution (i.e. nucleation is catalysed by dynamic het-erogeneities, which are formed during the nucleation pro-cess, for instance). The limits of CNT have already been pointed out by a number of authors, including Vekilov (2010) for protein nucleation, Jawor-Baczynska et al. (2015)
for organic molecules and Gebauer et al. (2014) for salts. Fig. 8 also displays the variation of the heterogeneous surface nucleation rate k as a function of T–3ln–2S.
Be-cause m and k are strongly correlated, and beBe-cause of the large uncertainty associated with data set B in particular, it is difficult to interpret the measured trend of the hetero-geneous nucleation rate k. Nevertheless, the upward trend of ln(k) vs T–3ln–2S (which is directly related to the energy
barrier of the nucleation process) is lower than the one ob-tained in the case of volume nucleation. As the nucleation process is fast, it can be inferred that the energy barrier for heterogeneous nucleation is very low.
For the same reasons, it is difficult to interpret the evo-lution of the mean number of impurities m. Based on Pound and La Mer’s original paper (1954), this number depends both on temperature and concentration. For data sets A through D, it appears that m is proportional to the concentration of solute, which implies that the impurities come with the solute molecules. They are probably asso-ciated with molecules with a molecular structure that re-semble the solute molecules and cannot be purified.
This section has confirmed that provided the sampling frame rate is commensurate with the heterogeneous nu-cleation rate and that the number of observed droplets is high enough to eliminate sampling statistics issues, the measured variation of unfrozen droplets can yield good estimates of nucleation parameters. Discussion about the parameter estimates led to the assertion that nucleation microfluidics experiments should be performed at the same initial concentration but with a different final tem-perature in order to decorrelate the heterogeneous nucle-ation parameters m and k, and to study conclusively the influence of supersaturation and temperature on nucle-ation kinetics.
Fig. 8 Evolution of the nucleation rates k and k0 as a function
4. Prediction of the appearance of crystals
Model predictions of fr(t) were obtained using the prob-abilistic model employed in single event nucleation mode and using the MC simulation scheme presented earlier for the selected experimental data sets. The output of the MC scheme is dependent on the time step ∆t used as well as the total number NT of droplets. The MC simulation
re-quires using as small a time step ∆t as possible, which impacts computation time. The choice of time step ∆t used in the simulations is such that it is no greater than 1/k, the heterogeneous nucleation giving the fastest kinetics.
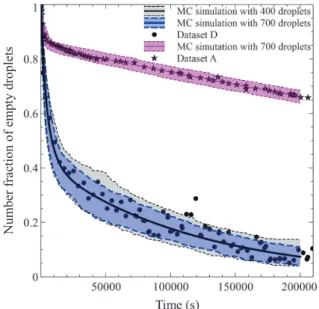
Fig.
9 shows the prediction of the fraction of empty droplets output by the MC simulation against the experi-mental microfluidics data. The prediction is good, as one would expect since the nucleation model parameters were estimated from the measured fraction of empty droplets. However, the point here is to recognise that the predic-tions are obtained by the MC simulation scheme, not from the analytical expressions for f0(t), which confirms the
correctness of the Monte-Carlo simulation code devel-oped by the authors to simulate the probabilistic nucle-ation model.
Fig. 9 also shows the predicted prediction intervals for data set D for two different total numbers NT of droplets.
The prediction intervals obtained for the simulation per-formed using 700 droplets (which correspond to the num-ber of the droplets analysed during the experiment) captures nicely the spread of the experimental data. As expected, the model predicts that had a lower number of droplets been observed, the spread of the experimental data would have been higher. This expected trend shows that the model can also be used to guide the
experimenta-tion in terms of setting the number of droplets to be ob-served. This is an important issue as the spread of the data controls the precision of the estimates of the nucle-ation model parameters.
The point was made in section 2.3 that the prediction of the number of crystals inside a droplet depends on the mode chosen to implement the nucleation model. The fol-lowing text analyses the capacity of the nucleation model to predict the appearance of crystals. It is worthy of note that, to the best of the authors’ knowledge, application of the probabilistic nucleation model to predict the appear-ance of crystals in microfluidics experiments has not yet been reported.
Experimentally, it was observed that for experiments performed at relatively low supersaturation, most of the droplets contained 1 crystal and very few droplets con-tained two crystals. This is the case for data set A, which produced 33 % of droplets with 1 crystal, 2 % with 2 crystals and 65 % without crystals. With experiment B, droplets that had nucleated contained only 1 crystal. Sim-ulation results of the probabilistic nucleation model used in single nucleation event mode are given in Fig. 10 for data sets A and B. It is emphasised here that the predic-tions use the parameters (k0, k, m) that were estimated in
section 3 from the time variation of empty droplets. The agreement between simulations and measurements is good, confirming that the single nucleation event mode gives a good account of the nucleation events that took place in experiments A and B. One explanation is that as supersaturation is low, when one crystal appears, it starts growing and consumes all the supersaturation. The deple-tion of solute induces a decrease in nucleadeple-tion probability such that no new nucleation event can occur inside the droplet. Such a situation will prevail when crystal growth kinetics are very fast, or when the ratio between the crys-tal nucleation rate and the cryscrys-tal growth rate is small.
It can be noticed in Fig. 10 that the measured fraction of droplets which bear one crystal is mainly inside the up-per portion of the model’s prediction interval, and that it is the opposite for the droplets with 2 crystals. One may recall that crystal number counting was done by visual inspection, and it is believed that the visual counting bi-ased the data by overestimating the number of droplets with 1 crystal at the expense of those with 2 crystals. Vi-sual counting of the number of crystals inside a droplet is difficult, and this nucleation-model-based analysis stressed the importance of this issue for analysis of mi-crofluidics experiments.
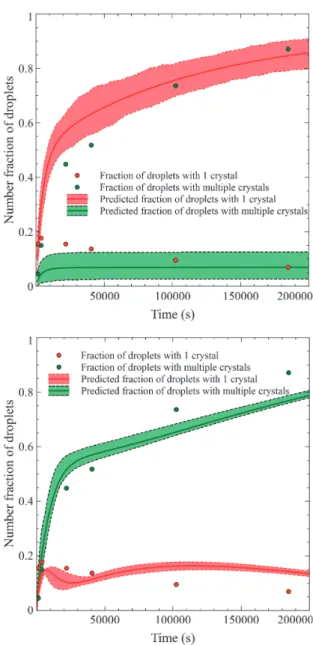
When the crystal nucleation rate to crystal growth rate ratio is high (with the limiting case of no crystal growth), not all the supersaturation is consumed by a single crys-tal, and successive nucleation events may occur over time. Let us consider data set D for which the initial supersatu-ration was twice that of data sets A and B. Fig. 11 shows Fig. 9 Prediction of the fraction of empty droplets as a
func-tion of time using MC simulafunc-tion for two representa-tive experiments and two total numbers of droplets.
the predictions of the probabilistic nucleation model used in both single nucleation event mode and constant super-saturation mode.
The variation of the number fraction of droplets that contain one crystal bears no resemblance with data sets A and B. Indeed, it shows a rapid increase at the beginning of the experiment to a maximum value, then a slow de-crease. The measured number fraction of droplets with 2 crystals or more shows a continuous increase over time. The upper plot in Fig. 11 shows the nucleation model pre-diction in single nucleation event mode. It is clear that this implementation mode of the nucleation model does not capture at all the nucleation events of data set D. The lower plot in Fig. 11 gives the prediction of the nucleation model in constant supersaturation mode. Notwithstanding the counting bias between droplets with one or more
crys-tals, it is clearly apparent that the constant supersaturation mode gives a much closer match to the measured data. With data set D, given its higher state of supersaturation and its higher k0/k ratio, which is more than 1 order of
magnitude higher than that of data sets A and B as seen in Table 3, it is not surprising to find that the hypotheses of the constant supersaturation mode give a better account of the measured microfluidics data.
Even though the single nucleation event mode can be a Fig. 10 Predicted and measured temporal evolution of the
fraction droplets containing one or two crystals in the droplets for data set A (upper) and data set B (lower).
Fig. 11 Predicted and measured temporal evolution of the
number fractions of droplets containing one or more crystals for data set D. Upper figure: single nucleation event mode. Lower figure: constant supersaturation mode.
Table 3 Values of the k0/k ratio for data sets A through D.
Data sets A B C D
close match to microfluidics data, as found with data sets A and B, both the single nucleation event and the constant supersaturation modes are limited in their ability to pre-dict nucleation in that they do not account for the crystal growth that follows nucleation. To further improve our ability to model microfluidics systems and gain even more value out of the valuable data produced by such systems, it is necessary to couple the probabilistic nucleation model with a crystal growth model that accounts for the con-sumption of supersaturation inside individual droplets. The Monte-Carlo simulation scheme, in which droplets are individualised, provides just the right environment for such a development. This requires both accurate measure-ments of crystal growth inside droplets, and a valid ther-modynamic model of the liquid phase.
5. Application to microfluidics data from
literature
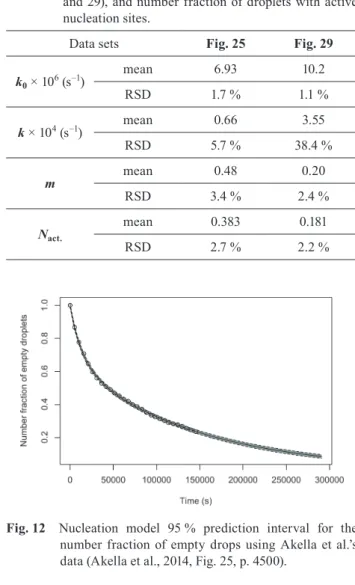
For the sake of rounding off the paper, it was deemed relevant to apply the probabilistic nucleation model to high-quality data published by researchers other than the present authors. The data selected was that of Figs. 25 and 29 from Akella et al. (2014). The estimated nucleation parameters, using the non-linear parameter estimation scheme presented earlier, are given in Table 4. The values
are close to those published by Akella et al., however, they differ due to the difference between equation (10), proposed by the authors and equation (14) used by Akella et al.
Figs. 12 and 13 show the corresponding 95 % predic-tion intervals for the number fracpredic-tion f0 of empty droplets.
The prediction intervals are narrower compared to those of data sets A through D. This is due to Akella et al. using a high number of droplets, typically 1200 to 4000 in each of their experiments, so that their raw measurements of f0
are extremely smooth.
Figs. 14 and 15 show the predictions made using both single nucleation event mode (NT = 1000 drops) and
con-stant supersaturation mode for the production of crystals. The results show that the single nucleation event mode predicts that after 15 hours, most droplets contain 1 crys-tal, with no more than 0.24 % and 0.62 % of droplets con-taining 2 crystals for the data from Figs. 25 and 29, respectively. The constant supersaturation mode predicts a significant proportion of droplets that bear 2 or more crystals.
It is anyone’s guess as to the actual number of crystals observed by Akella and co-workers (2014), as they did not report this information. The predictions are so distinct that it should be rather simple for them to decide whether their system behaves more like one mode or the other. By examining the images and movie frames provided in their
paper, and considering that their experiment is carried out at a low level of supersaturation, it is probable that their system follows the single nucleation event mode and pro-duced no more than 1 crystal per droplet.
Fig. 12 Nucleation model 95 % prediction interval for the
number fraction of empty drops using Akella et al.’s data (Akella et al., 2014, Fig. 25, p. 4500).
Fig. 13 Nucleation model 95 % prediction interval for the
number fraction of empty drops using Akella et al.’s data (Akella et al., 2014, Fig. 29, p. 4502).
Table 4 Estimated nucleation model parameters (m, k0, k) for
Akella et al’s data sets (Akella et al., 2014, Figs. 25 and 29), and number fraction of droplets with active nucleation sites.
Data sets Fig. 25 Fig. 29
k0 × 106 (s–1) mean 6.93 10.2 RSD 1.7 % 1.1 % k × 104 (s–1) mean 0.66 3.55 RSD 5.7 % 38.4 % m mean 0.48 0.20 RSD 3.4 % 2.4 % Nact. mean 0.383 0.181 RSD 2.7 % 2.2 %
Conclusions
The probabilistic nucleation model originally proposed by Pound and La Mer (1952) was revisited with the objec-tive of clarifying its underlying hypotheses and associated behaviour. The nucleation model considers two types of droplets, i.e. droplets without nucleation sites which can only undergo homogeneous nucleation events, and
drop-lets with active nucleation sites which can undergo homo-geneous and heterohomo-geneous nucleation events. Analytical expressions were derived for predicting the variation of the fraction of droplets that contain a given number of crystals, both in terms of Poisson distribution functions and exponential functions.
The paper emphasises that the same model can be im-plemented in different ways which yield different out-comes. The model was applied in constant supersaturation and single nucleation event modes. The first mode, which is often portrayed in the literature, corresponds to the droplets with no crystal growth, whereas the second one corresponds to droplets having a supersaturation that is just sufficient for one nucleation event and associated crystal growth.
Regardless of the implementation mode, the model pre-diction for the time variation of the fraction of empty or unfrozen droplets is the same, confirming that nucleation kinetic parameters m, k0 and k should indeed be estimated
using the experimental measurements of the fraction of empty droplets. This is a particularly favourable situation given that this is the fraction that is most accurately mea-sured in practice. Indeed, identifying droplets that contain 1 or more crystals is obviously more prone to measurement errors than identifying empty droplets. The estimation of nucleation model parameters showed the importance of frame rate and number of droplets as they impact the pre-cision of the parameter estimates.
In the context of microfluidics studies, it was confirmed that both modes of implementation of the nucleation model are applicable. The probabilistic nucleation model was used, possibly for the first time, to predict the rate of appearance of crystals for microfluidics systems. Experi-mental results with low supersaturation levels were well predicted by the single nucleation event mode. The single nucleation event mode was shown to yield droplets with no more than one or two crystals, a desirable situation from an industrial perspective. The constant supersaturation mode accounted better for the nucleation events observed for data sets with excess supersaturation. Comparison be-tween predicted and measured number fractions of drop-lets with one or more crystals indicated the possibility of bias in the number counting of crystals inside individual droplets, emphasising the need to develop reliable crystal counting methods for harvesting the full benefit of micro-fluidics systems.
The analysis confirmed the value and applicability of the probabilistic nucleation model for analysis of microfluid-ics data, particularly for estimation of nucleation parame-ters. The model showed limitations in its applicability for predicting the appearance of crystals inside droplets, al-though it gave reasonable predictions at low supersatura-tion levels. As the probabilistic nucleasupersatura-tion model alone cannot account for the consumption of the supersaturation Fig. 14 Prediction of crystal formation for Akella et al.’s data
from Fig. 25. (top: single nucleation event mode; bot-tom: constant supersaturation mode)
Fig. 15 Prediction of crystal formation for Akella et al.’s data
from Fig. 29. (top: single nucleation event mode; bot-tom: constant supersaturation mode)
inside droplets, the nucleation model cannot predict the number of crystals inside droplets. As the real situation is somewhere between the single nucleation event and the constant supersaturation modes, it is necessary for predic-tion of the rate of appearance of crystals inside individual droplets to merge the probabilistic nucleation model with a crystal growth model.
Nomenclature
dpois(k,λ) Probability density function of the Poisson
distribu-tion with mean λ
D Diffusion coefficient (m2·s–1)
fr(t) Number fraction of droplets containing r crystals at
time t
k Nucleation rate constant of an active nucleation site (s–1)
kB Boltzmann constant kB = 1.38064852 × 10⁻²³ m2
kg·s–2·K–1
k0 Homogeneous nucleation rate constant (s–1)
j Droplet index used in Monte-Carlo simulation (s)
Js Heterogeneous surface nucleation rate (s–1)
Jv Homogeneous nucleation rate (s–1·m–3)
m Mean number of active nucleation sites per droplet
Nact. Number fraction of droplets that contain active
nucleation sites at the start of a microfluidics experiment
Np Number of droplets with p active nucleation sites
NT Total number of droplets counted in a microfluidics
experiment
p Number of active nucleation sites in a droplet
r Number of nucleation events inside a droplet
r* Radius of the critical nuclei (m)
Sx Supersaturation defined as Sx = x°/x*
t Time (s)
T Temperature (K)
T* Saturation temperature (°C)
Tnucleation Final quench temperature (°C)
V Droplet volume (m3)
x° Initial molar fraction of eflucimibe in octanol or solubility molar fraction at T*
x* Solubility molar fraction at Tnucleation
Z Zeldovich factor
Δt Time increment used in the Monte-Carlo simulation (s)
ΔG* Free energy barrier of nucleation (J)
ρ Number density of monomers per unit of volume (m–3)
ρN Number density of nucleation sites (m–3)
σ Crystal solution interfacial tension (mJ·m–2)
References
Akella S.V., Mowitz A., Heymann M., Fraden S., Emulsion- based technique to measure protein crystal nucleation rates of lysozyme, Crystal Growth & Design, 14 (2014) 4487– 4509.
Dombrowski R.D., Litster J.D., Wagner N.J., He Y., Modeling the crystallization of proteins and small organic molecules in nanoliter drops, AIChE Journal, 56 (2010) 79–91. Gebauer D., Kellermeier M., Gale J.D., Bergstrom L., Colfen H.,
Pre-nucleation clusters as solute precursors in crystallisa-tion, Chemical Society Reviews, 43 (2014) 2348–2371. Goh L., Chen K., Bhamidi V., He G., Kee N.C.S., Kenis P.J.A.,
Zukoski C.F., Braatz R.D., A stochastic model for nucle-ation kinetics determinnucle-ation in droplet-based microfluidic systems, Crystal Growth & Design, 10 (2010) 2515–2521. Jawor-Baczynska A., Moore B.D., Sefcik J., Effect of mixing,
concentration and temperature on the formation of meso-structured solutions and their role in the nucleation of DL-valine crystals, Faraday Discussions, 179 (2015) 141– 154.
Kashchiev D., Clausse D., Jolivet-Dalmazzone C., Crystalliza-tion and critical supercooling of disperse liquids, Journal of Colloid and Interface Science, 165 (1994) 148–153.
Kashchiev D., Ed., Nucleation – Basic Theory with Applica-tions, Butterworth-Heinemann, Oxford (2000).
Laval P., Crombez A., Salmon J.-B., Microfluidic droplet method for nucleation kinetics measurements, Langmuir, 25 (2009) 1836–1841.
Pound G.M., Lar Mer V.K., Kinetics of crystalline nucleus for-mation in supercooled liquid tin, Journal of the American Chemical Society, 74 (1952) 2323–2332.
Sear R.P., Quantitative studies of crystal nucleation at constant supersaturation: Experimental data and models, CrystEng-Comm, 16 (2014) 6506–6522.
Selimović Š., Jia Y., Fraden S., Measuring the nucleation rate of lysozyme using microfluidics, Crystal Growth & Design, 9 (2009) 1806–1810.
Teychené S., Biscans B., Nucleation kinetics of polymorphs: induction period and interfacial energy measurements, Crystal Growth & Design, 8 (2008) 1133–1139.
Teychené S., Biscans B., Microfluidic device for the crystalliza-tion of organic molecules in organic solvents, Crystal Growth & Design, 11 (2011) 4810–4818.
Teychené S., Biscans B., Crystal nucleation in a droplet based microfluidic crystallizer, Chemical Engineering Science, 77 (2012) 242–248.
Vekilov P.G., The two-step mechanism of nucleation of crystals in solution, Nanoscale, 2 (2010) 2346–2357.
Vitry Y., Teychené S., Charton S., Lamadie F., Biscans B., Investigation of a microfluidic approach to study very high nucleation rates involved in precipitation processes, Chemi-cal Engineering Science, 133 (2015) 54–61.
Author’s short biography
Florent Bourgeois
Prof. Bourgeois received his PhD in extractive metallurgy from the University of Utah in 1993. He was affiliated to the University of Queensland from 1994 to 2000 with re-search and teaching activities related to mineral and coal processing, after which he spent 5 years with the French Geological Survey’s processing department. In 2006, he joined the Laboratoire de Génie Chimique at the University of Toulouse (France). His field of competence is particulate process design and modelling, with emphasis on solid -liquid separation, comminution, liberation and sampling, as they apply to mineral and waste beneficiation.
Sébastien Teychené
Dr Sébastien Teychené is assistant professor in chemical engineering at the Labo-ratoire de Génie Chimique of the University of Toulouse (France). He received his B. Eng. degree in chemical and environmental engineering from the Institut National de Sciences Appliquées (INSA, Toulouse) in 2000, and a master’s degree in chemical engi-neering in 2001. He was awarded his PhD in chemical engiengi-neering from the University of Toulouse in 2006, after which he joined Dr. Béatrice Biscans’ research team at the Laboratoire de Génie Chimique. His research work focuses on thermodynamics and kinetics aspects of nucleation and phase transitions in the crystallization processes of organic compounds.
Béatrice Biscans
Dr. Béatrice Biscans obtained her engineering degree in chemical engineering from the University of Toulouse in 1982 and was awarded her PhD in chemical and process engineering in 1985. From 1987 onwards, following a post-doctoral position, she worked for the National Centre for Scientific Research (CNRS) at the Laboratoire de Génie Chimique (Toulouse, France). Her research focuses on particle technology and process-ing. She leads a research group working on crystallization, formulation processes and the production of nanoparticles. Until recently, she was head of the Laboratoire de Génie Chimique. She is currently president of the Working Party on Crystallization of the European Federation of Chemical Engineering and of the Working Party on Powders and Particles of the French Society of Chemical Engineering. She is also the CNRS’ repre-sentative expert in chemical engineering.