O
pen
A
rchive
T
OULOUSE
A
rchive
O
uverte (
OATAO
)
OATAO is an open access repository that collects the work of Toulouse researchers and
makes it freely available over the web where possible.
This is an author-deposited version published in :
http://oatao.univ-toulouse.fr/
Eprints ID : 15207
The contribution was presented at PDP 2015:
http://www.pdp2015.org/
To cite this version :
Tsafack Chetsa, Ghislain Landry and Lefèvre, Laurent and
Pierson, Jean-Marc and Stolf, Patricia and Da Costa, Georges
Application-Agnostic Framework for Improving the Energy Efficiency of Multiple HPC
Subsystems. (2015) In: 23rd Euromicro International Conference on Parallel,
Distributed and network-based Processing (PDP 2015), 4 March 2015 - 6 March
2015 (Turku, Finland).
Any correspondence concerning this service should be sent to the repository
administrator:
[email protected]
Application-Agnostic Framework for Improving the
Energy Efficiency of Multiple HPC Subsystems
Ghislain Landry Tsafack Chetsa, Laurent Lefevre INRIA, LIP Laboratory (UMR CNRS, ENS, INRIA, UCB)
ENS Lyon, Universit´e de Lyon, France
Email:{ghislain.landry.tsafack.chetsa, laurent.lefevre}@ens-lyon.fr
Jean-Marc Pierson, Patricia Stolf, Georges Da Costa IRIT (UMR CNRS)
Universit´e de Toulouse, France Email:{pierson, stolf, dacosta}@irit.fr
Abstract—The subsystems that compose a High Performance Computing (HPC) platform (e.g. CPU, memory, storage and network) are often designed and configured to deliver exceptional performance to a wide range of workloads. As a result, a large part of the power that these subsystems consume is dissipated as heat even when executing workloads that do not require maximum performance. Attempts to tackle this problem include technologies whereby operating systems and applications can reconfigure subsystems dynamically, such as by using Dynamic Voltage and Frequency Scaling (DVFS) for CPUs, Low Power Idle (LPI) for network components, and variable disk spinning for HDDs. Most previous work has explored these technologies individually to optimise workload execution and reduce energy consumption. We propose a framework that performs on-line analysis of an HPC system in order to identify application execution patterns without a priori information of their workload. The framework takes advantage of reoccurring patterns to reconfigure multiple subsystems dynamically and reduce overall energy consumption. Performance evaluation was carried out on
Grid’50001 considering both traditional HPC benchmarks and
real-life applications.
I. INTRODUCTION
High Performance Computing (HPC) systems have become essential to many organisations working in the most diverse domains, including large-scale simulations, climate forecasts, homeland security, model prototyping, and drug discovery. HPC is often chosen to address complex problems in these areas due to the large amounts of computational power it can provide. Energy consumption, however, has become a factor limiting the growth and operation of HPC infrastructure. According to DARPA, in the foreseeable future an exaflop system is expected to consume 67MW, well above the 20MW-limit initially set to drive research in this field.
To ensure that HPC applications achieve maximum per-formance system designers generally focus on improving a few key components — here also termed subsystems — such as processor architecture, memory, storage, network communication, and management framework. Ensuring high performance of these components is generally synonymous of improving performance of most HPC applications/workloads2. These components, though configured to deliver maximum performance, may waste power when running an application that does not explore it.
1http://www.grid5000.fr
2We use the terms application and workload interchangeably.
Current hardware provides technologies whereby operating systems and resource allocation policies can dynamically re-configure individual subsystems to save power. Examples of technologies include Dynamic Voltage and Frequency Scaling (DVFS), Low Power Idle (LPI), and variable disk spinning. Software developers can leverage these techniques to make their applications consume less energy, but optimisations are not trivial and require understanding the trade-offs between performance and energy savings. In previous work, [1], we showed that the energy consumed by an HPC system can be reduced without changing existing applications or knowing their workload. The work attempted to detect recurring execu-tion patterns of an applicaexecu-tion workload and adjust processor frequency accordingly.
In this work, we describe Multi-Resource Energy Efficient Framework (MREEF) to reduce application runtime or opera-tional energy consumption of HPC systems by reconfiguring multiple subsystems. MREEF integrates power saving schemes for subsystems ranging from processor, memory to storage and communication interfaces. Here we focus on computing and storage, ignoring network equipments such as routers and switches because their consumption generally does not vary with utilisation. By using the concept of Execution Vectors (EVs), MREEF performs on-line detection and characterisation of application recurring patterns (i.e. phases) using a low-overhead pattern-matching technique for system reconfigura-tion decisions. An EV is a column vector of sensors relative to subsystems’ activities. A system reconfiguration is any action taken to modify the operating level of any HPC subsystem (e.g. adjusting CPU frequency). MREEF has been tested using both well-known HPC benchmarks and real-life applications. The rest of this paper is organised as follows. In Section II we describe the scenario considered in this work and the challenges to be addressed. Section III details the design and implementation of our multi-resource energy efficient framework. Section IV presents and discusses experimental results. In Section V we describe existing work on energy consumption of HPC systems, and Section VI concludes the paper.
II. SCENARIO ANDPROBLEMDEFINITION
This work considers an HPC cluster composed of M machines, on which one or more applications (i.e. also referred to as application set) are executed. These applications pose a workload W that influences how cluster resources are utilised. During the execution of an application workload w ∈ W ,
!"#$%&'()*"+,(-./(+01 .22%,%(/$-3+45(6*+7 8**+9%/4$*+ '(,*/2%0"+4$%*/-(/2*+,(+ !"#$%"&'()*&+,(-*&#&-.,#/+&./"01 ',.,-./"01(&0'()#,'/-./"0 23+.,4(5./%/+&./"0(4"0/."#/061 ,07"#-,4,0.("7()"8,#(+&9/06(',-/+/"0+ 23+.,4 :)./4/+&./"0 ',-/+/"0+ 23+.,4 5./%/+&./"0 4,.#/-+ :;(+4$%/0-<1)$(5 =>8-?*9(
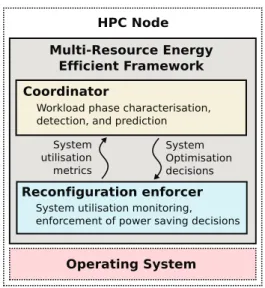
Fig. 1. Overview of MREEF architecture.
the machines on which w is placed go through multiple phases P where different quantities of resources are consumed depending on what w stresses (e.g. compute intensive, memory intensive, and storage-intensive). Each phase has its own set of applicable reconfiguration techniques that can used to adjust the performance of HPC subsystems in order to reduce the consumed energy. We assume that no a priori information regarding W is available.
The challenges are hence to identify the set of possible phases P = p1. . . pn that a machine m∈ M can go through and the hardware reconfiguration methods applicable to each phase pi∈ P . The second challenge arises when executing a w∈ W , and consists in: (i) determine the phase pi∈ P that the machine is going through and adjust the system configuration accordingly; and (ii) predict a future phase and adjust the configuration accordingly either at the end of the previous phase, or early during the execution of the predicted phase. We term the first challenge as phase detection and the second as phase characterisation and identification. The rest of this paper describes how the proposed framework aims to address these challenges.
III. MULTI-RESOURCEENERGYEFFICIENTFRAMEWORK
As depicted in Figure 1, MREEF architecture involves two components. Both coordinator and reconfiguration decision enforcer reside on each node of the platform and interact in a client-server manner. The coordinator performs system profiling tasks including phase detection, phase characterisa-tion and phase identificacharacterisa-tion. It notifies the reconfiguracharacterisa-tion decision enforcer to reconfigure the system whenever a phase identification process is successful. The reconfiguration deci-sion enforcer captures resource utilisation metrics by reading sensors and takes system reconfiguration decisions.
Although reconfiguration decisions are local to each node, coordinators are able to act in a centralised manner when required. On a distributed setting (see Figure 1), MREEF runs on each node and makes decisions local to the node regardless of others; i.e, an instance of MREEF is spawned of each
node. Decoupling system profiling (phase detection, phase characterisation, and phase identification) from enforcement of power-saving schemes provides the flexibility required by our framework.
MREEF attempts to reduce the overall energy consumption of an HPC system by considering not only the power used by processors, but also by exploring power saving mechanisms whenever it determines that running workloads are not using all available resources — e.g. processor, memory, network and disks. To accomplish this goal, MREEF performs three main operations:
• System phase detection: detects phase changes in the runtime execution pattern of a system.
• Phase characterisation or labelling: characterises detected phases.
• On-line EV classification and system adaptation: performs an on-line classification through which it predicts the system’s upcoming behaviour and dynam-ically reconfigures subsystems accordingly to reduce the overall energy consumption.
The following sections detail these operations. A. System Phase Detection
A system phase is an execution period throughout which a metric remains stable. A phase change is detected when the metric values diverge between two measurement points. A phase change results in a change of system (compute or storage node) behaviour. As system behaviour is generally determined by how its resources are used, the easiest way for detecting phase changes is to evaluate resource utilisation metrics.
EVs [2] are used for detecting phase changes. An EV is a 9-dimension column vector of sensors including hardware performance counters, number of bytes sent and received over the network, and number of reads and writes to disk — see Table I. Sensors related to hardware performance counters provide insight into processor and memory activities, whereas the others offer information concerning network and disk usage. An EV provides means to capture the behaviour of an individual compute or storage node over a time frame; a second in this work. In other words, EVs are collected on a per second basis.
The Manhattan distance does not depend on the translation of the coordinate system with respect to a coordinate axis, i.e., it weighs more heavily differences in each dimension. Consequently, the Manhattan distance between consecutive EVs is taken as similarity metric. That is, the Manhattan distance between two consecutive EVs is used for detecting phase changes by quantifying how close EVs are from one another. A phase change occurs (or a phase change is detected) when the Manhattan distance between two consecutive EVs exceeds a threshold.
The length of a phase depends on how long the system behaviour remains unchanged (with respect to the similarity metric). As a consequence, a large number of EVs may be collected during a phase, which makes storing EV data for further reuse often impractical. To tackle this issue, we
TABLE I. SENSORS DESCRIBING ANEV. Sensor Name HW INSTRUCTIONS HW CACHE MISSES HW CACHE REFERENCES HW BRANCH INSTRUCTIONS HW BRANCH MISSES netSENTbyte netRCVbyte Write IO Read IO
compress the data of a phase into a single EV that contains the arithmetic average of all EVs collected during the phase. Roughly speaking, only a single EV is stored for each phase, this makes the overhead associated with storing EV negligible. B. Phase Characterisation or Labelling
Although gathering EVs throughout a phase is straightfor-ward, extracting relevant information from the collected data can be difficult. Our characterisation process aims to determine the computational behaviour of a system throughout a phase. To do so, it attempts to associate each detected phase with a label that implicitly tells the type of applicable reconfiguration decisions. This prevents the framework from making reconfig-uration decisions that degrade system performance (and the performance of running workloads). Reconfiguration in this context means coercing a resource to operate at a specific performance level.
HPC workloads or their phases generally fall into one of the following groups: compute intensive, memory intensive, IO intensive, communication intensive, and a combination of these. We further divide communication intensive work-loads into network receive and network transmit because on most systems receiving packets requires more processing than sending. By grouping HPC workloads based on their use of available resources, we define six labels: compute-intensive, memory-intensive, mixed, IO-intensive, network-transmit, and network-received. All labels are self-explanatory except for mixed. Workloads or phases labelled as mixed can have alternating behaviours. They are neither sufficiently compute intensive to be labelled as compute-intensive nor memory intensive enough to be labelled as memory-intensive. In addi-tion, although a single phase of a workload could potentially combine two or more labels, for simplicity, we consider that compute-intensive, memory-intensive, and mixed labels are mutually exclusive.
Three different schemes are used to determine which label can be associated with a workload.
1) PCA-based Characterisation: This scheme uses Princi-pal Component Analysis (PCA). We create a set of reference HPC workloads (i.e. compute, memory, IO, and communi-cation intensive) on which we rely to extract characteristics shared by other workloads that exhibit similar predominant behaviour. PCA permits to identify the principal dimensions in which the data varies.
The sensors listed in Table I are used as features or variables describing a workload, and PCA considers each EV as an instance of the variables. The PCA problem is hence formulated as: reduce from 9-dimension to 2-dimension, (i.e.
find two vectors, Principal Components (PCs) 1 and 2) onto which the data can be projected so that the projection error is minimised; the way each variable (sensor) correlates with the PCs (the two vectors in the PCA problem formulation). As PCA precision improves as the amount of data increases — provided the right features are employed — we use nearly five thousand observations.
To characterise our workload set, we apply PCA to individ-ual datasets comprising EVs collected during the execution of each workload category and determine how variables correlate with PCs. The correlation of a variable with a PC is the PC value in the projected plane of PCs. Figure 2 offers a graphical representation of PCA results for CG, FT, MG, SP, and BT benchmarks of NAS Parallel Benchmark suite (NPB-3.33). They show that with the exception of CG, which is exclusively memory intensive, for all other benchmarks, PC 1 opposes memory related sensors (cache references and misses) to those related to processor (hardware instructions, branch instructions and misses). We can assume that for mixed workloads, memory sensors are negatively correlated to PC 1 whereas processor sensors are positively correlated to PC 1. The correlation of network and IO sensors is nearly zero for these workloads due to low network and IO utilisations. We can also assume that for workloads that are neither communication nor IO intensive, correlations of network and IO sensors with PC 1 and PC 2 are negligible. A similar analysis allows us to define characteristics specific to each workload category.
2) LLCRIR-driven Characterisation: This workload char-acterisation scheme relies on the memory sensitivity of running workloads. The memory sensitivity of a workload is given by its Last Level Cache References per Instruction Ratio (LLCRIR), where a high LLCRIR indicates stringent mem-ory requirements whereas a low LLCRIR suggests that the workload is not memory bound. Computing LLCRIR requires reading two hardware event counters, namely number of re-tired instructions and cache references. In addition, modern processors have on-chip event counting, so reading counter information does not pose additional overhead.
The goal is to associate labels with phases according to their magnitude of average LLCRIR. To that end, we execute the set of reference benchmarks representative of each workload category (compute intensive, memory intensive, communication intensive, and IO intensive), and observe how variables change from one workload category to another.
Table II summarises our findings, outlining the relation-ship between labels and the magnitude of LLCRIR over corresponding phases. The label-workload association also reflects our knowledge of workloads used for this purpose. Though LLCRIR allows us to determine whether a workload is compute-intensive, memory-intensive or mixed, it does not tell whether a workload is IO or communication intensive. Elimi-nation is used in this case; if the group to which a workload belongs is not known, it is treated as IO or communication intensive.
3) Sensor-based Characterisation: This characterisation scheme also uses PCA and the same data set of the first described technique. However, after applying PCA, the
1. 0 0. 5 0. 0 0 . 5 1 . 0 1 . 0 0 . 5 0 . 0 0 . 5 1 . 0 1s t pr i nc i pal axi s ( 54 . 2%) 2 n d p r i n c i p a l a x i s ( 2 1 . 3 % ) HwI ns Cac he Re f Cac he Mi s s Br Mi s s e s s e nt Byt e s
(a) CG. PC 1 and PC 2 explain 54,2% and PC 2 21.3% of the variability respec-tively. 1. 0 0. 5 0. 0 0. 5 1. 0 1 . 0 0 . 5 0 . 0 0 . 5 1 . 0 1s t pr i nc i pal axi s ( 63. 9%) 2 n d p r i n c i p a l a x i s ( 2 3 . 4 % ) HwI ns Cac he Re f Cac he Mi s s Br I ns r e c vByt e s (b) FT. PC 1 and PC 2 explain 63,9% and PC 2 23.4% of the variability respec-tively. 1. 0 0. 5 0. 0 0. 5 1. 0 1 . 0 0 . 5 0 . 0 0 . 5 1 . 0 1s t pr i nc i pal axi s ( 70. 5%) 2 n d p r i n c i p a l a x i s ( 1 8 . 6 % ) HwI ns Cac he Re f Cac he Mi s s Br I ns Br Mi s s e s r e c vByt e s (c) BT. PC 1 and PC 2 explain 70,5% and PC 2 18.6% of the variability respec-tively. 1. 0 0. 5 0 . 0 0. 5 1. 0 1 . 0 0 . 5 0 . 0 0 . 5 1 . 0 1 s t pr i nc i pa l axi s ( 6 8. 7%) 2 n d p r i n c i p a l a x i s ( 2 2 . 3 % ) HwI ns Cac he Re f Cac he Mi s s Br I ns r e c vByt e s (d) MG. PC 1 and PC 2 explain 68,7% and PC 2 22.3% of the variability respec-tively. 1. 0 0. 5 0. 0 0. 5 1. 0 1 . 0 0 . 5 0 . 0 0 . 5 1 . 0 1s t pr i nc i pal axi s ( 86. 9%) 2 n d p r i n c i p a l a x i s ( 7 . 7 % ) HwI ns Cac he Re f Cac he Mi s s Br I ns r e c vByt e s
(e) SP. PC 1 and PC 2 explain 86,9% and PC 2 7.7% of the variability respectively.
Fig. 2. PCA of NPB benchmarks. Variables, projected on a PC1-PC2 plane, may differ across cases as correlated variables are removed before applying PCA.
TABLE II. LLCRIRAND ASSOCIATED LABELS.
Workload label Order of magnitudeof LLCRIR Compute intensive ≤ 10−4
memory bound ≥ 10−2
mixed (both memory and
compute intensive) 10
−3
based characterisation selects five sensors out of those con-tributing the least to the first PC. Five sensors are used because there are four workload types. Since selecting four sensors could result in one sensor falling in each workload category, a fifth sensor is used to break even so that we can always have at least two sensors related to a specific type of workload.
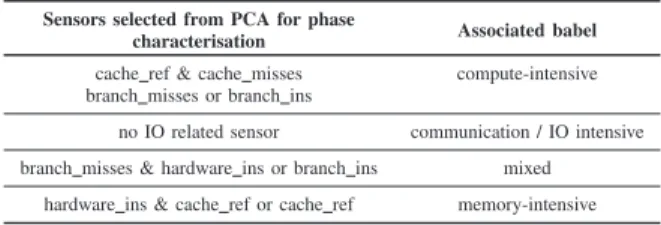
Selected sensors are further interpreted to associate the corresponding phase with a label. Table II outlines a set of empirical rules linking sensors selected from PCA to workload labels. For example, when the system selects as sensors the number of cache references and misses combined with branch misses or branch instructions, the workload is prone to be compute intensive.
4) Characterisation Algorithm: To avoid performance degradation, the characterisation must be carefully performed as the effectiveness of system reconfiguration depends on its accuracy. A majority-rule characterisation algorithm is
TABLE III. RULES FOR ASSOCIATING LABELS WITH PHASE SENSORS
SELECTED FROMPCA.
Sensors selected from PCA for phase
characterisation Associated babel cache ref & cache misses compute-intensive branch misses or branch ins
no IO related sensor communication / IO intensive branch misses & hardware ins or branch ins mixed
hardware ins & cache ref or cache ref memory-intensive
employed to select the most relevant label for a given phase. For each phase, the algorithm applies the three proposed phase characterisation schemes and uses the majority-rule to select the appropriate label. When the majority-rule cannot be used (i.e., labels returned by schemes differ), the result of the characterisation scheme considered the most accurate is selected. The LLCRIR phase characterisation predicts compute intensive workloads with higher accuracy. Hence, if it suggests that the workload is compute intensive, then the compute-intensive label is selected. Likewise, as the PCA approach is the most accurate for memory intensive, IO intensive, and communication intensive workloads, when the majority-rule does not apply, the PCA result is considered the most relevant if the workload is considered to fall into these categories. The PCA result is also employed when the majority-rule fails and PCA characterises the workload as mixed.
C. On-line EV Classification and System Adaptation
Predicting a phase is required to reconfigure the system within the boundaries accepted by the ongoing phase before the new one starts. Unfortunately, it is difficult to determine the next phase without information on the pattern of running workloads. The following approach is proposed to deal with this challenge.
As a phase is represented by a single EV resulting from the component-wise arithmetic average of EVs collected during the phase, we cluster the newly sampled EVs to classes represented by reference EVs obtained from known phases. This is simply a comparison of the new EV with reference EVs. A match is found when the distance between the EVs of at least one phase is small (refer to the following paragraphs for further details). Once a match is found, we employ a simple prediction algorithm to determine the system behaviour over the next time unit (a second to be more precise). In a more formal manner, we use an approach similar to the temporal locality for caching algorithms. Hence, to predict the system behaviour at time t+ 1, we consider that its behaviour will be the same of time t. By so doing, the decision applicable at time t remains valid at time t+ 1. This process is performed independently of phase detection.
The process of matching a candidate pattern (an EV just sampled) to reference EVs, considers the matching error to be a vector of component-wise absolute differences between vectors. For example, given two vectors X(x1, x2, . . . , xn) and Y(y1, y2, . . . , yn) in an n-dimensional space, the error resulting from matching them is given by a new vector W(abs(y1− x1), . . . , abs(yn− xn)); the Manhattan distance between X and Y is obtained by summing elements of W .
Entries of W , hereafter referred to as “component-wise” errors, represent how each component of X differs from its counterpart in Y , whereas the Manhattan distance be-tween X and Y shows how X differs from Y . Relying on empirical evidences, we assume that an EV matches a reference vector when none of their component-wise error is greater than a threshold th. In the literature, X matches Y if wi≤ th, ∀wi∈ {abs(y1− x1), . . . , abs(yn− xn)}. We use th= 0.1.
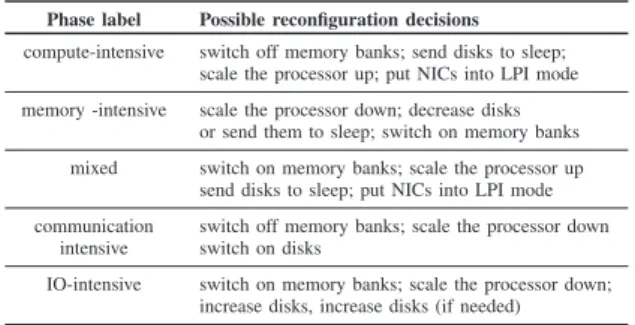
A match being found represents that the workloads the system is running belong to the group represented by the matched reference EVs. This allows us to trigger resource reconfiguration decisions based on the label associated with the reference vector. Table IV demonstrates how labels are translated into reconfiguration decisions. For example, during a compute intensive phase, actions like switching off memory banks, sending disks to sleep, and putting the Network Inter-face Card (NIC) into LPI mode can be considered. If a phase has more than one label, the decision making is “performance oriented”. For instance, if a phase is labelled both as memory intensive and communication intensive, then memory banks will not be switched off as suggested by the fourth row of Table IV. Likewise, processor settings will be set to those of a memory-intensive workload. The decisions of Table IV reflect our knowledge on which type of workload belongs to each label class.
TABLE IV. PHASE LABELS AND ASSOCIATED ENERGY REDUCTION
SCHEMES.
Phase label Possible reconfiguration decisions compute-intensive switch off memory banks; send disks to sleep;
scale the processor up; put NICs into LPI mode memory -intensive scale the processor down; decrease disks
or send them to sleep; switch on memory banks mixed switch on memory banks; scale the processor up
send disks to sleep; put NICs into LPI mode communication switch off memory banks; scale the processor down
intensive switch on disks
IO-intensive switch on memory banks; scale the processor down; increase disks, increase disks (if needed)
IV. EXPERIMENTALRESULTS ANDDISCUSSION
This section describes experiments and results on evaluat-ing MREEF ability to manage CPU frequency efficiently and reduce the overall energy consumption of a computing infras-tructure without significantly degrading performance. Signifi-cant performance degradation here is an overhead greater than 10%.
A. Evaluation Using Micro Benchmarks
Evaluating MREEF with micro benchmarks can save time when using it for long-running applications because results indicate how good the framework performs on very stable applications. For these experiments, we consider a single node and use the following micro benchmarks: IOzone4, iperf5, stream6, and stress7. IOzone is IO intensive, iperf is network intensive, stream is memory intensive and stress is compute intensive.
Three configurations are taken into account:
1) Ideal where the desired CPU frequency and network bandwidth are explicitly set for each category of workload before its execution.
2) MREEF, leaves allows MREEF to select the most convenient CPU frequency; for this specific case, the network bandwidth is left unchanged.
3) MREEF-NET, where MREEF, in addition to adjust-ing CPU frequency, scales the network bandwidth down/up whenever appropriate.
Figure 3 summarises the results on energy consumption and execution time of the micro benchmarks under the three sys-tem configurations. MREEF approaches the results achieved by specifying the appropriate CPU frequency and network bandwidth before running the benchmarks. However, when MREEF-NET results in slightly higher execution time and energy consumption. While investigating this issue, we found that changing the NIC speed takes a long time compared to adjusting CPU frequency. Also, we notice that stream MREEF is slightly better than Ideal for stream under. This happens because MREEF takes decisions at runtime which might sometimes leads to better CPU-cache affinity. Overall, the experiment indicates that MREEF is capable of making
4IOzone: http://www.iozone.org
5https://iperf.fr/
6http://www.cs.virginia.edu/stream/ref.html
appropriate decisions while taking into account workload re-quirements. In addition, MREEF has a negligible overhead in terms of CPU usage, as the Linux Top utility indicates an average CPU time usage of less than 2%.
B. Evaluation Using Real Workloads
The following section evaluates MREEF — ignoring the Ideal scenarios — on a larger system using real applications along with benchmarks. The experimental platform consists of a 34-node cluster set up over the French large scale experi-mental platform Grid’5000. Each node is an Intel Xeon X3440 (which provides DVFS) with 4 cores and 16 GB of RAM (total of 136 CPU cores). Among the frequencies available, during the experiments we used four: 2.53 GHz for compute intensive; 2.27 GHz for mixed, 2.00 GHz for memory intensive, and 1.20 GHz for IO and communication intensive workloads. However, when the CPU frequency scaling governor is set to on-demand, the processor can basically scale to any frequency among those available according to the workload being accommodated.
Class B problem set of NPB benchmarks — including Conjugate Gradient (CG), Multi-Grid (MG) (NPB-3.3) — along with real-life applications (Molecular Dynamics Sim-ulation8(MDS), the Advance Research Weather Research and Forecasting (WRF-ARW) model9, Parallel Ocean Program (POP) X1 benchmark10, and GeneHunter [3]) are used for the experiments. NPB benchmarks use OpenMPI library, whereas MDS, WRF-ARW, POP and GeneHunter use MPICH. The power consumption of each node of the cluster is measured on a per-second basis using a powermeter.
MDS and WRF have significantly long execution time as they are executed on 25 nodes (100 cores), NPB benchmarks on 9 nodes (36 cores), and POP X1 and GeneHunter on 4 nodes. Some applications are launched simultaneously when enough resources are available. The reason is that WRF and MDS run on 25 nodes and they cannot be run at the same time. NBP benchmarks, POP X1 or GeneHunter can run in parallel with WRF or MDS. In addition, since NPB benchmarks run on 9 nodes, neither POP X1 nor GeneHunter is executed in parallel with NPB benchmarks.
We compare the case where each node runs MREEF or MREEF-NET to setting each node to use Linux on-demand and performance governors. The performance governor is configured to use the maximum available frequency, whereas under the on-demand governor uses the default configuration. Figure 4(a) (a) shows the energy consumption (in Joule) of applications under different system configurations, whereas Figure 4(b) (b) presents the runtime in seconds of corre-sponding applications. Figure 4(a) (a) and Figure 4(b) (b) indicate that our applications have the same execution time and energy consumption under performance and on-demand configurations. Consequently, they can be treated alike. On-demand governor uses a thresholding algorithm which scales the CPU frequency depending on the processor load. In our case, although all the workloads are not compute intensive, their CPU load is significantly high. Thus, the on-demand
8http://ringo.ams.sunysb.edu/index.php/MD Simulation: Protein in Water
9http://wrf-model.org
10http://climate.lanl.gov/Models/POP/index.shtml
governor will select the highest frequency available, which in turn makes it behave like the performance governor.
Still on Figure 4(a), we notice MREEF-NET that performs slightly better than MREEF except for POP X1. POP X1 per-forms a lot of communications, which makes it very sensitive to NIC speed. However, as mentioned earlier herein, scaling NIC speed is not well supported by current hardware and takes a relatively long amount of time. As a consequence, POP X1 runs slightly longer than expected because it spends some of its computational time waiting for the interconnect to be ready for used. Overall, save POP X1, the execution time of applications is relatively the same either under MREEF or MREEF-NET. This is justified by the fact that they do not have stringent network requirements.
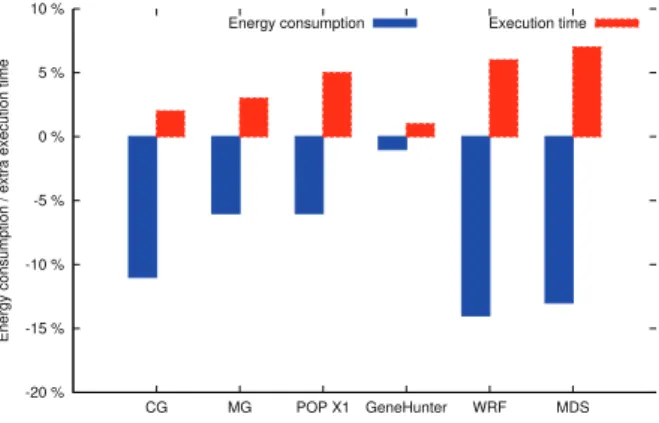
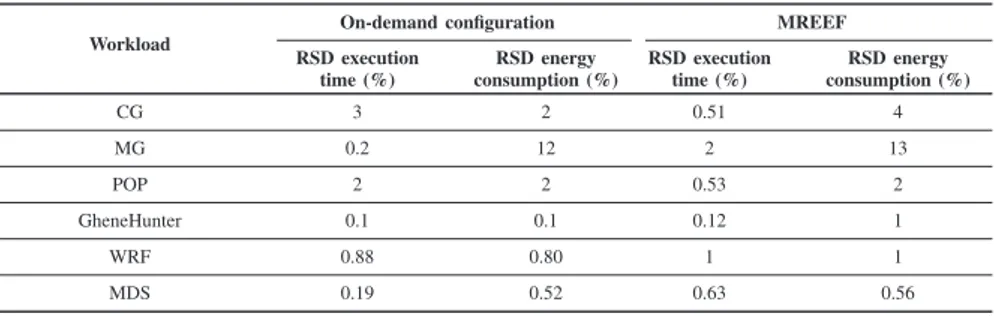
Figure 5 compares MREEF with on-demand configuration. Performance degradation depends on the workload, but re-mains below 7%. The maximum achievable energy saving is 15%, but it depends on the type of workload at hand. MREEF is performance oriented in the sense that it does not make decisions that are likely to degrade performance (according to what the characterization says). Hence, as Figure 5 re-veals, memory-bound codes allow more energy savings than compute-bound applications (MG, POP X1 partially memory-bound, and GeneHunter). The values are averaged over multi-ple executions, and the relative standard deviation of the energy consumption and execution time of each workload is provided in Table V, where RSD is the short for relative standard deviation. Table V indicates a very low variability in our data set. -20 % -15 % -10 % -5 % 0 % 5 % 10 % CG MG POP X1 GeneHunter WRF MDS
Energy consumption / extra execution time
Energy consumption Execution time
Fig. 5. Execution time and energy of MREEF under on-demand configuration.
V. RELATEDWORK
Equipment vendors have designed multi-configuration HPC subsystems — including processor, network devices, memory and storage — that can be dynamically reconfigured to reduce the energy consumed by the overall infrastructure without sacrificing much performance. For instance, the majority of modern processors enable DVFS, which permits operating systems and applications to adapt operating frequency to specific workload demands. Another emerging technology is LPI for NICs.
Some hardware manufacturers address the energy issue by employing state-of-art and efficient components in their equip-ments. For instance, certain chip manufacturers are pushing
0 5000 10000 15000 20000 25000
iozone iperf stream stress
Average energy consumption (J)
(a) Energy consumed by micro benchmarks under different configurations.
20 40 60 80 100 120 140
iozone iperf stream stress
Average execution time (s)
(b) Execution time of micro benchmarks under different configurations.
Ideal MREEF MREEF-NET
Fig. 3. Energy consumption and execution time of micro benchmarks under different system configurations. They are averaged over 20 executions of each
micro benchmark under each system configuration.
0 2 4 6 8 10 12 CG MG POP X1 GeneHunter WRF MDS Energy consumption *10 6 (J)
(a) Energy consumed by each application under different configurations.
0 0.5 1 1.5 2 2.5 3 3.5 4 4.5 CG MG POP X1 GeneHunter WRF MDS Execution time *10 3 (S)
(b) Execution time of each application under different configurations.
Performance On-demand MREEF MREEF-NET
Fig. 4. Energy consumption and execution time of each application under different system configurations. They are averaged over 20 executions of each
workload under each system configuration.
TABLE V. RELATIVESTANDARDDEVIATION(RSD)OF ENERGY CONSUMPTION AND EXECUTION TIME
Workload
On-demand configuration MREEF RSD execution time (%) RSD energy consumption (%) RSD execution time (%) RSD energy consumption (%) CG 3 2 0.51 4 MG 0.2 12 2 13 POP 2 2 0.53 2 GheneHunter 0.1 0.1 0.12 1 WRF 0.88 0.80 1 1 MDS 0.19 0.52 0.63 0.56
for low voltage Dynamic Random Access Memory (DRAM). Although major efforts have been made in the hardware do-main, progress is generally slow due to high costs in equipment design and always growing demands to improve performance. Software initiatives for reducing energy consumption of HPC usually leverages hardware-level optimisations during the execution of specific workloads. The solutions in this area can be divided into two groups, namely off-line and on-line. Off-line approaches require human intervention and involve several steps. With DVFS, for example, the steps may consist of source code instrumentation and workload execution for performance profiling; determination of appropriate CPU-frequency for each workload phase; and source code instrumentation for inserting DVFS directives. Freeh et al. [4] exploit PMPI to time MPI calls and based on their duration insert DVFS scheduling instructions, whereas Cameron et al. [5] profile MPI commu-nications. Although PMPI appears to be a generalised way to understand application communication patterns, estimating the duration of MPI communication calls requires knowledge on what data is being transferred. Tawari et al. [6] automate the process of finding phases and optimal frequencies using power models. Kimura et al. [7] instrument source code to insert DVFS directives according to application behaviour in order to reduce energy consumption without degrading much performance.
On-line approaches, like the one proposed in this work, aim to determine application execution phases during work-load execution to drive energy-reduction decisions. In [8], [9] authors use on-line techniques to detect and characterise application execution phases, and choose the appropriate CPU frequency. For detecting and characterising phase changes, they rely on hardware monitoring counters used to compute runtime statistics (e.g. cache hit/miss ratio, memory access counts, retired instructions counts). Many of proposed policies focus on single task environments [8], [9].
The techniques described above attempt to reduce the energy consumed by the infrastructure from an application perspective — i.e., they focus on the application instead of the infrastructure itself. This is not always easy to achieve as it may require expert knowledge from application designers on the energy saving mechanisms in place. Moreover, for security reasons the operator of the HPC infrastructure may not have access to details of an application workload.
Our previous work [10] introduced a system-wide, appli-cation independent methodology for reducing the energy con-sumed by an HPC system. The methodology we describe in the present paper bypasses the limitation of other approaches by focusing on the system instead of individual applications. Our approach is hence application agnostic and can be used across different systems without significant performance issues.
VI. CONCLUSIONS ANDFUTUREDIRECTIONS
In this paper, we present a Multi-Resource Energy Efficient Framework (MREEF) to manage the energy consumption of HPC systems. It takes advantage of recurring execution patterns in HPC workloads to reduce the energy consumption of the overall system. It accomplishes this by implementing three key features: (i) phase changes detection, which attempts to detect system phase changes; (ii) phase characterisation; and
(iii) phase identification along with a technique for matching execution vectors with known phases.
We demonstrate the effectiveness of MREEF by evaluat-ing it on a 34-node cluster usevaluat-ing benchmarks and real-life applications. Comparison with baseline unmanaged execution indicates that the amount of energy saved when using MREEF varies with workloads. However, we noticed that performance degradation remains below 7% and energy savings of up to 15%. As MREEF does not require any a priori knowledge of applications or workloads being executed on the HPC infrastructure, it can be easily extended to a wide range of power aware systems for reducing their energy consumption. In addition, MREEF can easily integrate power saving schemes other than CPU frequency scaling. Future directions include implementing and evaluating the effectiveness of other power saving schemes.
ACKNOWLEDGMENTS
This work is supported by the INRIA large scale initiative Hemera. Some experiments were performed on the Grid’5000 testbed.The authors thank Marcos Dias de Assunc¸˜ao for his com-ments, which helped improve the quality of this work.
REFERENCES
[1] G. L. Tsafack, L. Lefevre, J.-M. Pierson, P. Stolf, and G. Da Costa,
“A runtime framework for energy efficient hpc systems without a priori knowledge of applications,” in 18th International Conference on Parallel and Distributed Systems, (Singapore), pp. 660–667, IEEE, Dec 2012.
[2] G. L. Tsafack, L. Lefevre, J.-M. Pierson, P. Stolf, and G. Da Costa, “A
user friendly phase detection methodology for hpc systems’ analysis,” in GreenCom 2013 : The 2013 IEEE International Conference on Green Computing and Communications, (Beijing, China), IEEE, Aug. 2013.
[3] G. C. Conant, S. J. Plimpton, W. Old, A. Wagner, P. R. Fain, T. R.
Pacheco, and G. Heffelfinger, “Parallel genehunter: implementation of a linkage analysis package for distributed-memory architectures,” J. Parallel Distrib. Comput., vol. 63, pp. 674–682, July 2003.
[4] V. W. Freeh and D. K. Lowenthal, “Using multiple energy gears in
mpi programs on a power-scalable cluster,” in Proceedings of the tenth ACM SIGPLAN symposium on Principles and practice of parallel programming, PPoPP ’05, (New York, NY, USA), pp. 164–173, ACM, 2005.
[5] K. W. Cameron, R. Ge, and X. Feng, “High-performance, power-aware
distributed computing for scientific applications,” Computer, vol. 38, pp. 40–47, Nov. 2005.
[6] A. Tiwari, M. Laurenzano, J. Peraza, L. Carrington, and A. Snavely,
“Green queue: Customized large-scale clock frequency scaling,” in CGC’12, pp. 260–267, 2012.
[7] H. Kimura, T. Imada, and M. Sato, “Runtime energy adaptation with
low-impact instrumented code in a power-scalable cluster system,” in CCGRID ’10, (Washington, DC, USA), pp. 378–387, IEEE Computer Society, 2010.
[8] K. Choi, R. Soma, and M. Pedram, “Fine-grained dynamic voltage and
frequency scaling for precise energy and performance tradeoff based on the ratio of off-chip access to on-chip computation times,” Trans. Comp.-Aided Des. Integ. Cir. Sys., vol. 24, pp. 18–28, Nov. 2006.
[9] C. Isci, G. Contreras, and M. Martonosi, “Live, runtime phase
monitor-ing and prediction on real systems with application to dynamic power management,” in Proceedings of MICRO 39, (Washington, DC, USA), pp. 359–370, IEEE Computer Society, 2006.
[10] G. L. Tsafack, L. Lefevre, and P. Stolf, “A three step blind approach
for improving hpc systems’ energy performance,” in EE-LSDS 2013 : Energy Efficiency in Large Scale Distributed Systems conference, (Vienna, Austria), Springer, Apr. 2013.